注釈
Go to the end をクリックすると完全なサンプルコードをダウンロードできます.
グリフを使ったムービーの保存#
glyph() と pyvista.Sphere() を使用してグリフを生成し,アニメーションGIFを作成します.
from __future__ import annotations

import numpy as np

import pyvista as pv
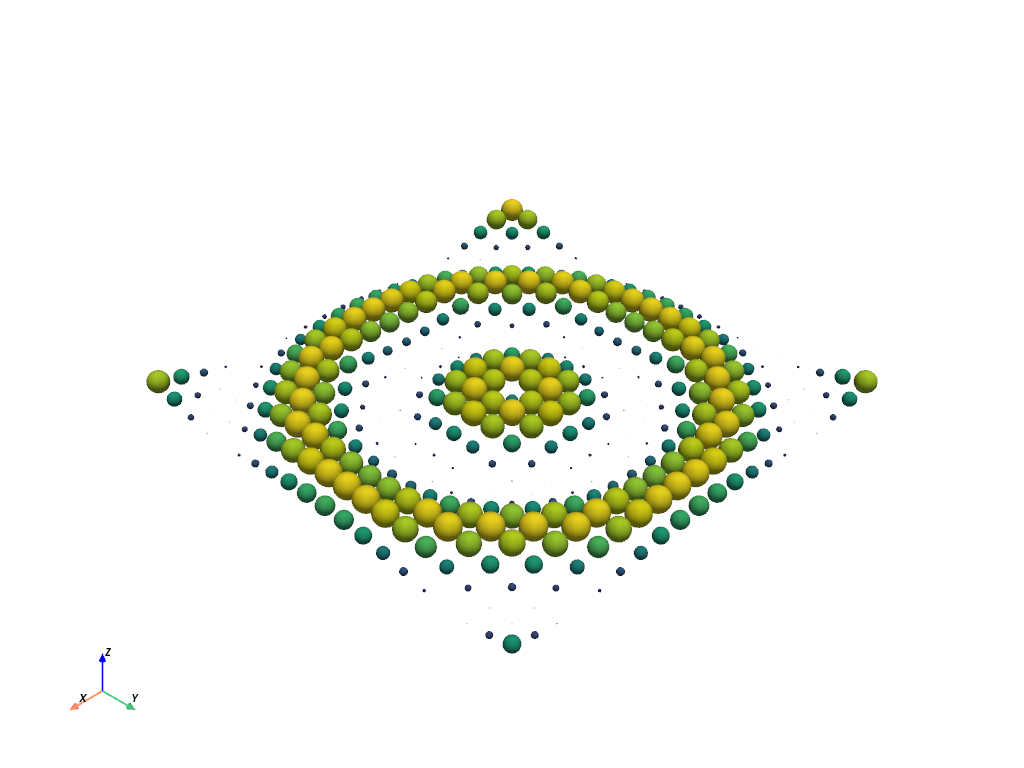
球体グリフの作成#
x = np.arange(-10, 10, 1, dtype=float)
y = np.arange(-10, 10, 1, dtype=float)
x, y = np.meshgrid(x, y)
r = np.sqrt(x**2 + y**2)
z = (np.sin(r) + 1) / 2

# Create and structured surface
grid = pv.StructuredGrid(x, y, z)
grid.point_data['size'] = z.ravel()

# generate glyphs with varying size
sphere = pv.Sphere()
spheres = grid.glyph(scale='size', geom=sphere, orient=False)

spheres.plot(show_scalar_bar=False)
ムービーを作成する#
# Create a plotter object and set the scalars to the Z height
plotter = pv.Plotter(notebook=False)
plotter.add_mesh(
    spheres,
    show_edges=False,
    show_scalar_bar=False,
    clim=[0, 1],
    cmap='bwr',
)

# Open a gif
plotter.open_gif('glyph_wave.gif')

# Update Z and write a frame for each updated mesh
nframe = 30
for phase in np.linspace(0, 2 * np.pi, nframe + 1)[:nframe]:
    z = (np.sin(r + phase) + 1) / 2

    # regenerate spheres
    grid = pv.StructuredGrid(x, y, z)
    grid.point_data['size'] = z.ravel()
    new_spheres = grid.glyph(scale='size', geom=sphere, orient=False)

    spheres.copy_from(new_spheres)

    # Write a frame. This triggers a render.
    plotter.write_frame()

# Close and finalize the gif
plotter.close()
Total running time of the script: (0 minutes 15.366 seconds)