注釈
Go to the end to download the full example code.
スプラインの作成#
pyvista.Spline() を使用してXYZ頂点の数の多い配列からスプライン/ポリラインを作成します
from __future__ import annotations

import numpy as np

import pyvista as pv
プロットするデータセットを作成する
def make_points():
    """Make XYZ points."""
    theta = np.linspace(-4 * np.pi, 4 * np.pi, 100)
    z = np.linspace(-2, 2, 100)
    r = z**2 + 1
    x = r * np.sin(theta)
    y = r * np.cos(theta)
    return np.column_stack((x, y, z))


points = make_points()
points[0:5, :]
array([[ 2.44929360e-15,  5.00000000e+00, -2.00000000e+00],
       [ 1.21556036e+00,  4.68488752e+00, -1.95959596e+00],
       [ 2.27700402e+00,  4.09249671e+00, -1.91919192e+00],
       [ 3.12595020e+00,  3.27840221e+00, -1.87878788e+00],
       [ 3.72150434e+00,  2.30906573e+00, -1.83838384e+00]])
ここで, pyvista.PolyData メッシュ上にラインセルを作成できる関数を作成しましょう.
def lines_from_points(points):
    """Given an array of points, make a line set"""
    poly = pv.PolyData()
    poly.points = points
    cells = np.full((len(points) - 1, 3), 2, dtype=np.int_)
    cells[:, 1] = np.arange(0, len(points) - 1, dtype=np.int_)
    cells[:, 2] = np.arange(1, len(points), dtype=np.int_)
    poly.lines = cells
    return poly


line = lines_from_points(points)
line
line['scalars'] = np.arange(line.n_points)
tube = line.tube(radius=0.1)
tube.plot(smooth_shading=True)
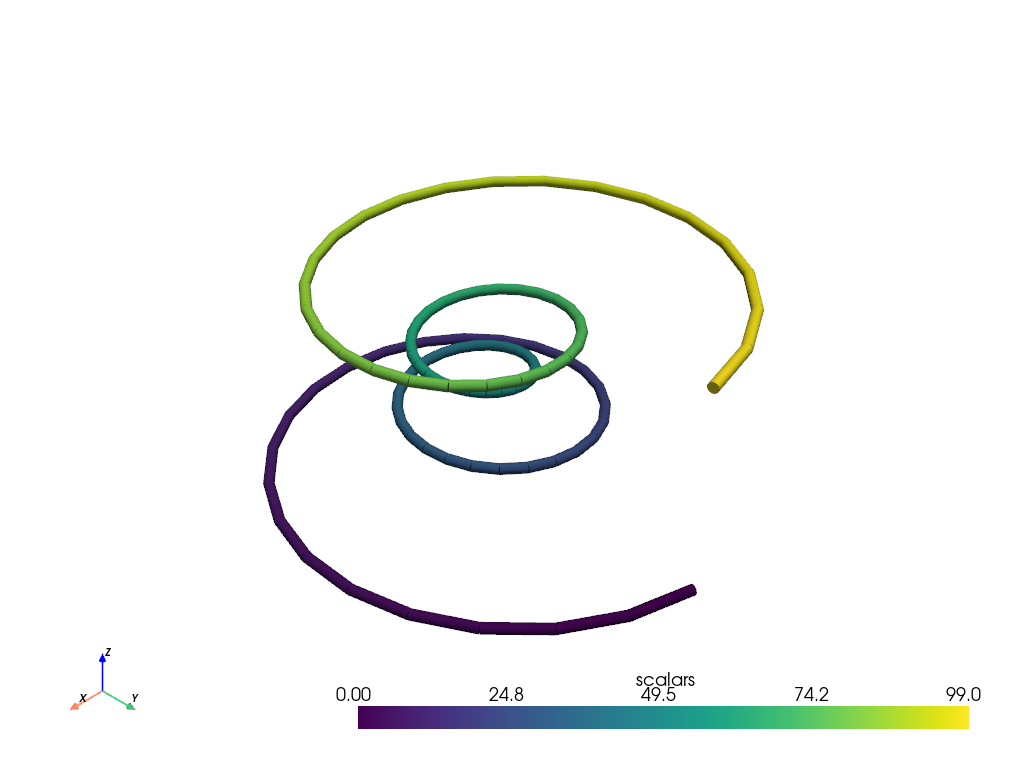
そのチューブは,各線分セグメントに鋭いエッジを持っています.これは,すべての点に対して単一のポリラインセルを作成することで緩和できます.
def polyline_from_points(points):
    poly = pv.PolyData()
    poly.points = points
    the_cell = np.arange(0, len(points), dtype=np.int_)
    the_cell = np.insert(the_cell, 0, len(points))
    poly.lines = the_cell
    return poly


polyline = polyline_from_points(points)
polyline['scalars'] = np.arange(polyline.n_points)
tube = polyline.tube(radius=0.1)
tube.plot(smooth_shading=True)

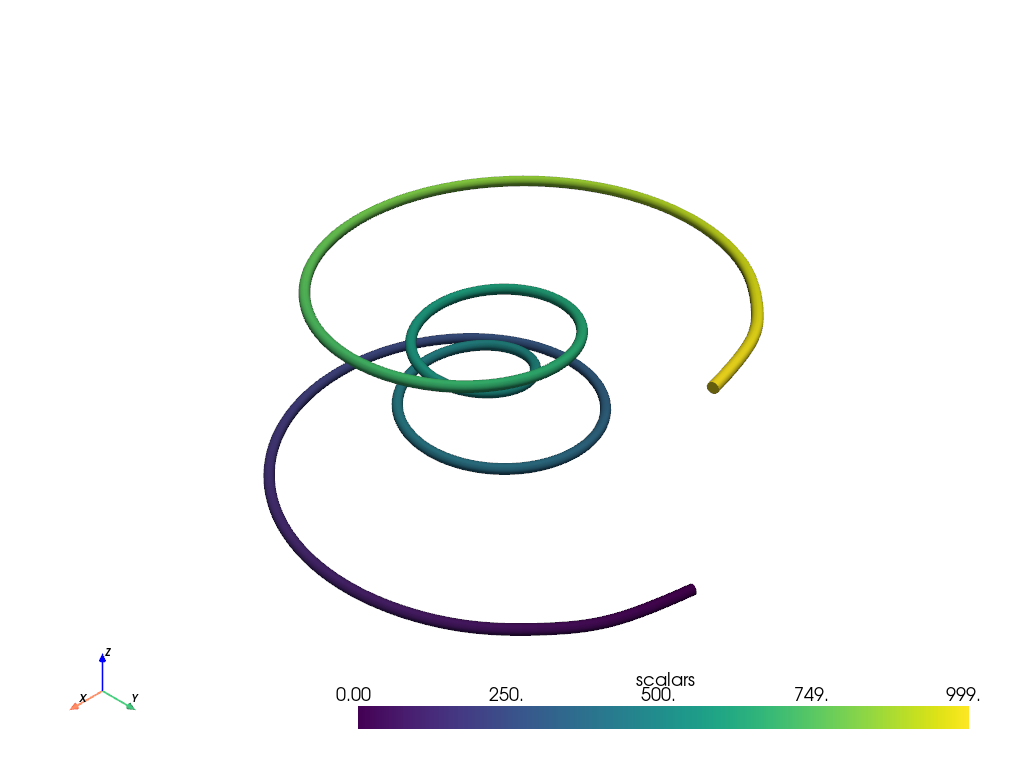
これらの点をパラメトリックスプライン上に補間することもできます.
# Create spline with 1000 interpolation points
spline = pv.Spline(points, 1000)
スプラインをチューブとしてプロットします
# add scalars to spline and plot it
spline['scalars'] = np.arange(spline.n_points)
tube = spline.tube(radius=0.1)
tube.plot(smooth_shading=True)
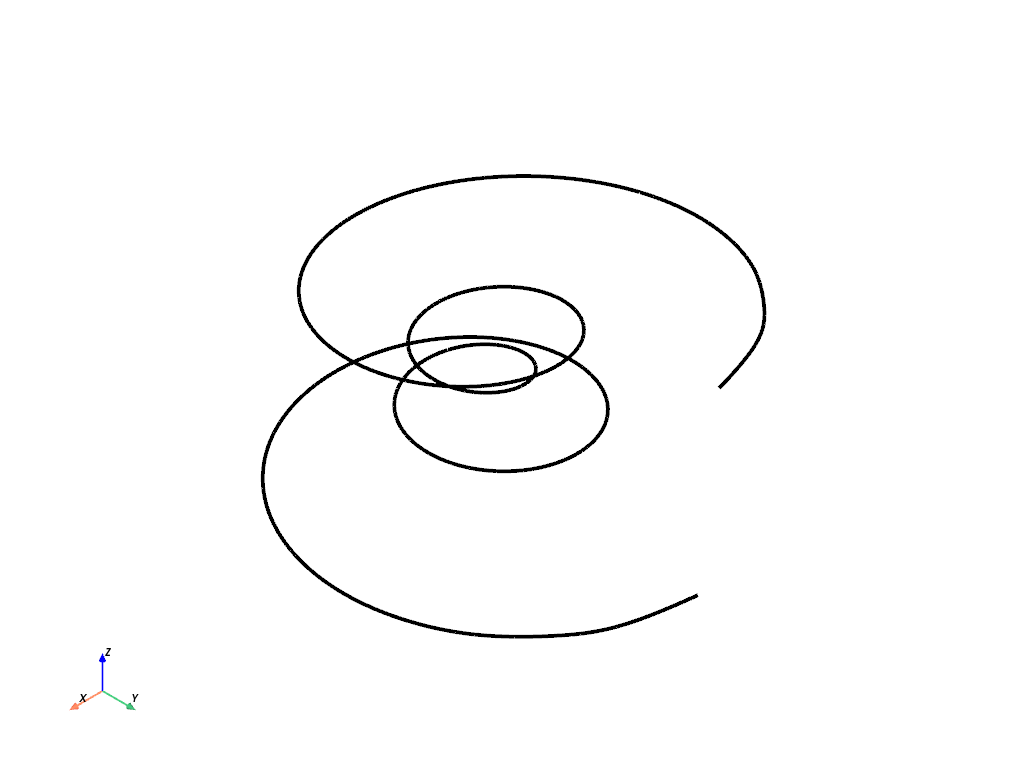
スプラインは,プレーンラインとしてプロットすることもできます.
# generate same spline with 400 interpolation points
spline = pv.Spline(points, 400)

# plot without scalars
spline.plot(line_width=4, color='k')
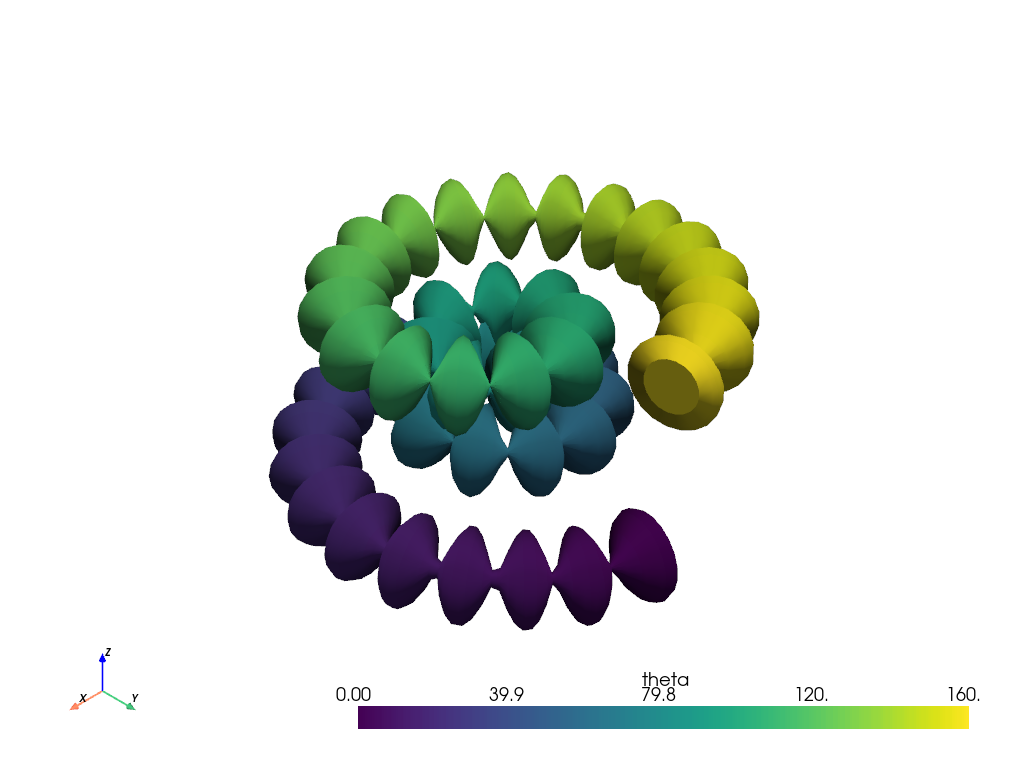
チューブの半径は,スカラーで変調することができます.
リボン#
上記の例の線のAyyを使用してリボンを作成できます. pyvista.PolyDataFilters.ribbon() フィルタを見てください.
ribbon = spline.compute_arc_length().ribbon(width=0.75, scalars='arc_length')
ribbon.plot(color=True)

Total running time of the script: (0 minutes 1.763 seconds)