注釈
Go to the end to download the full example code.
磁場をプロットする#
次の例は,PyVistaを使用して磁場をプロットする方法を示しています.
This example relies on streamlines_from_source() to
generate streamlines and add_volume() to plot
the strength of the magnetic field.
このデータセットは,素晴らしいライブラリ magpylib の Coil Field Lines の例から作成しました.
from __future__ import annotations

import numpy as np

import pyvista as pv
from pyvista import examples
データセットのダウンロード#
まず,例のデータセットをダウンロードし,それが pyvista.ImageData で,磁場は point_data の 'B' 配列として格納されていることを示します.
grid = examples.download_coil_magnetic_field()
grid.point_data
pyvista DataSetAttributes
Association     : POINT
Active Scalars  : B
Active Vectors  : B
Active Texture  : None
Active Normals  : None
Contains arrays :
    B                       float64    (531441, 3)          VECTORS
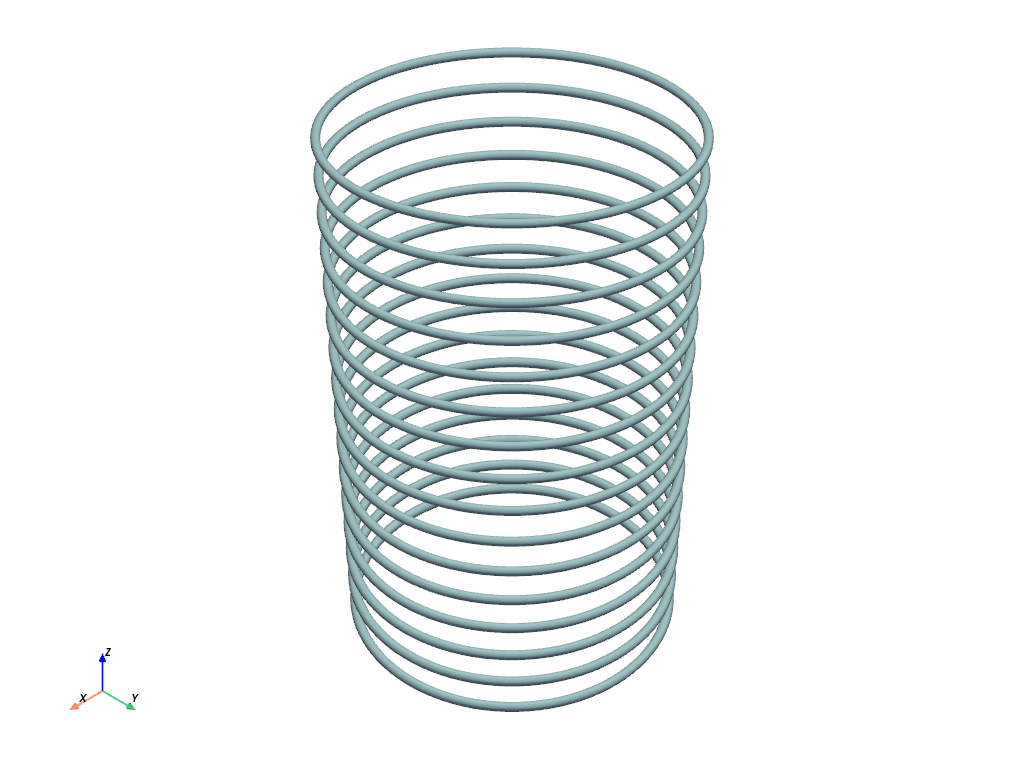
コイルを作る#
コイルを表現するためにいくつかのフープを作成します.これは,元の例のジオメトリと一致します.
coils = [pv.Polygon((0, 0, z), radius=5, n_sides=100, fill=False) for z in np.linspace(-8, 8, 16)]
coil_block = pv.MultiBlock(coils)
coil_block.plot(render_lines_as_tubes=True, line_width=10)
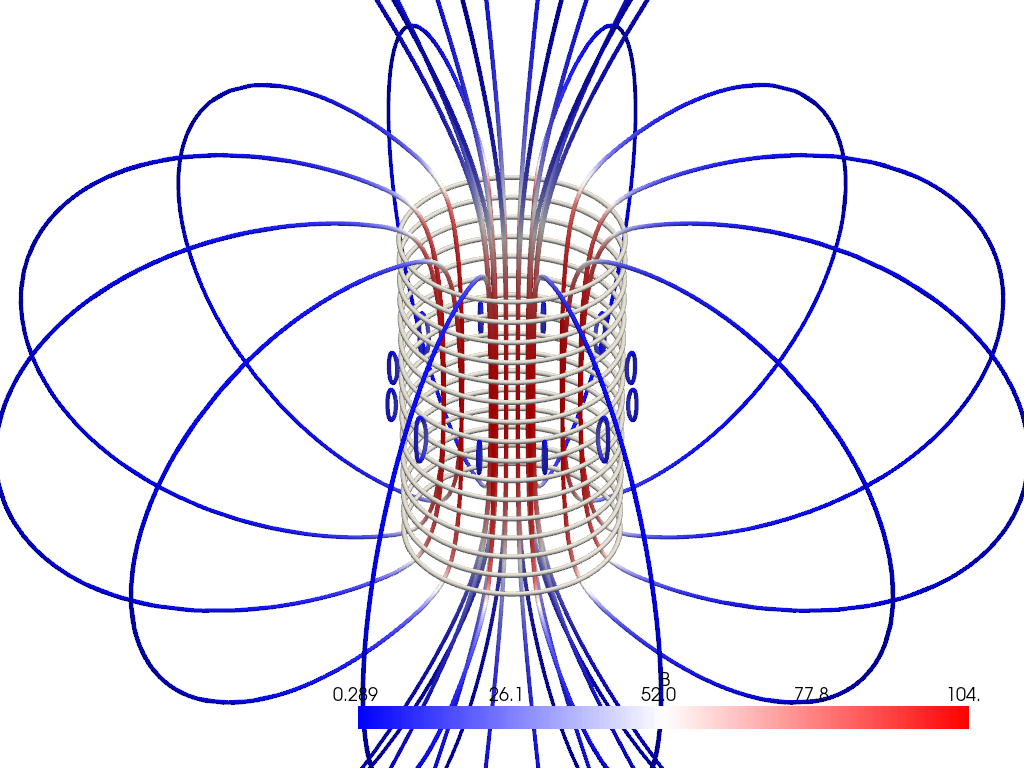
フィールドラインの計算とプロット#
次に,磁力の方向を表すために,コイルの中心からの流線を計算しましょう.これには,単純な pyvista.Disc() を作成し,それを流線のソースとして使用することができます.
seed = pv.Disc(inner=1, outer=5.4, r_res=2, c_res=12)
strl = grid.streamlines_from_source(
    seed,
    vectors='B',
    max_length=180,
    initial_step_length=0.1,
    integration_direction='both',
)

pl = pv.Plotter()
pl.add_mesh(
    strl.tube(radius=0.1),
    cmap='bwr',
    ambient=0.2,
)
pl.add_mesh(coil_block, render_lines_as_tubes=True, line_width=5, color='w')
pl.camera.zoom(3)
pl.show()
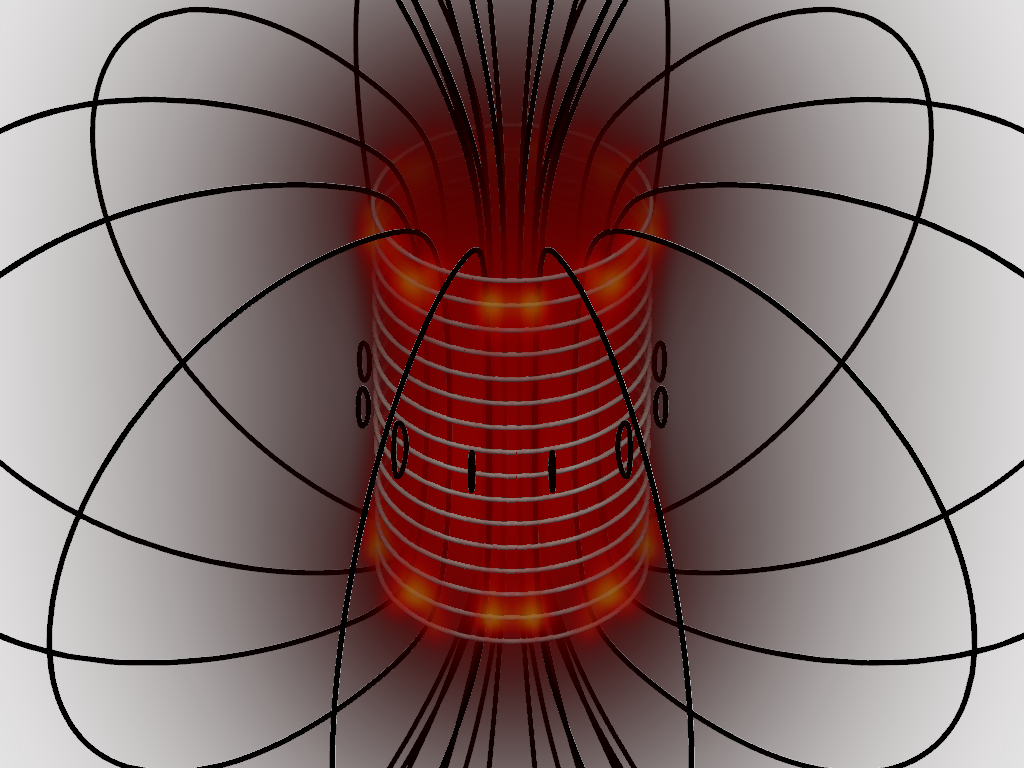
磁石の磁場強度をプロットする#
最後に,磁場の強さをプロットしながら,流線とコイルをプロットして,全体をまとめましょう.
# Take the norm of the magnetic field
scalars = np.linalg.norm(grid['B'], axis=1)

# Customize the opacity to make it easier to visualize the strength of the
# field nearby the coil
opacity = 1 - np.geomspace(1.0, 0.05, 10)


# Add this all to the plotter
pl = pv.Plotter()
pl.add_mesh(
    strl.tube(radius=0.1),
    color='black',
)
pl.add_mesh(coil_block, render_lines_as_tubes=True, line_width=5, color='w')
vol = pl.add_volume(
    grid,
    scalars=scalars,
    opacity=opacity,
    cmap='hot',
    show_scalar_bar=False,
)
vol.prop.interpolation_type = 'linear'
pl.camera.zoom(5)
pl.show()
Total running time of the script: (0 minutes 14.065 seconds)