注釈
Go to the end をクリックすると完全なサンプルコードをダウンロードできます.
字形のプロット (ベクトルかPolyData)#
データセット内のベクトルを使用して,記号/ジオメトリオブジェクトを印刷したり方向を設定します.
from __future__ import annotations

import numpy as np

import pyvista as pv
from pyvista import examples
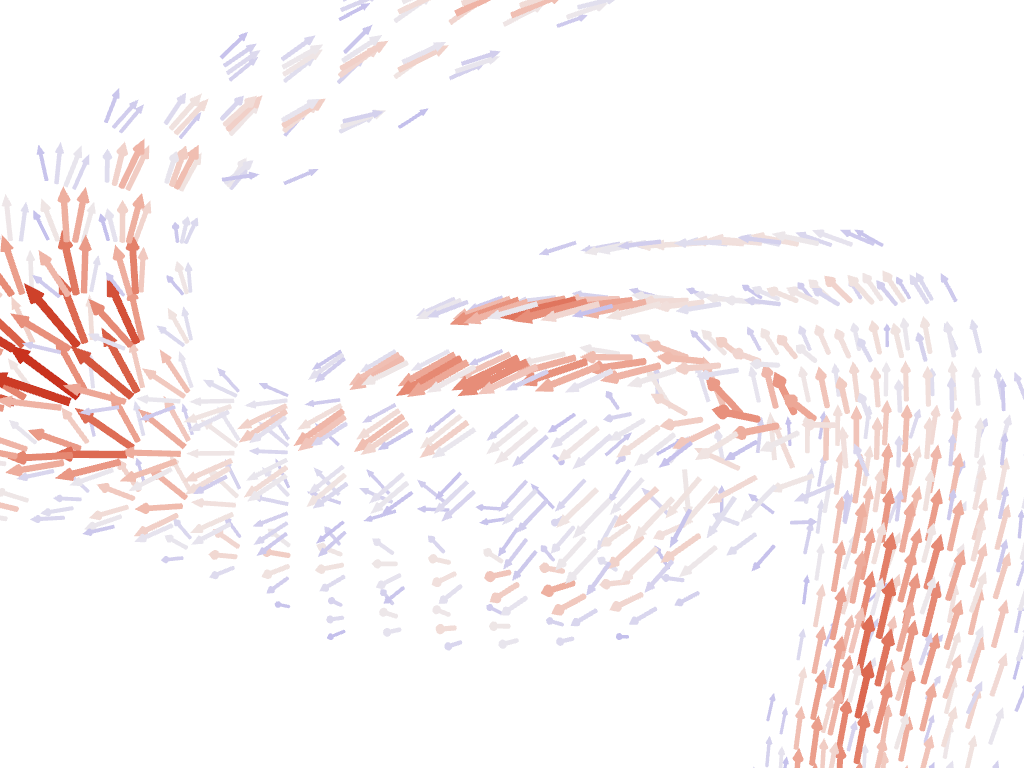
グリフィイングは pyvista.DataSetFilters.glyph() フィルターを介して行うことができる
mesh = examples.download_carotid().threshold(145, scalars='scalars')
mask = mesh['scalars'] < 210
mesh['scalars'][mask] = 0  # null out smaller vectors

# Make a geometric object to use as the glyph
geom = pv.Arrow()  # This could be any dataset

# Perform the glyph
glyphs = mesh.glyph(orient='vectors', scale='scalars', factor=0.003, geom=geom)

# plot using the plotting class
pl = pv.Plotter()
pl.add_mesh(glyphs, show_scalar_bar=False, lighting=False, cmap='coolwarm')
pl.camera_position = [
    (146.53, 91.28, 21.70),
    (125.00, 94.45, 19.81),
    (-0.086, 0.007, 0.996),
]  # view only part of the vector field
cpos = pl.show(return_cpos=True)
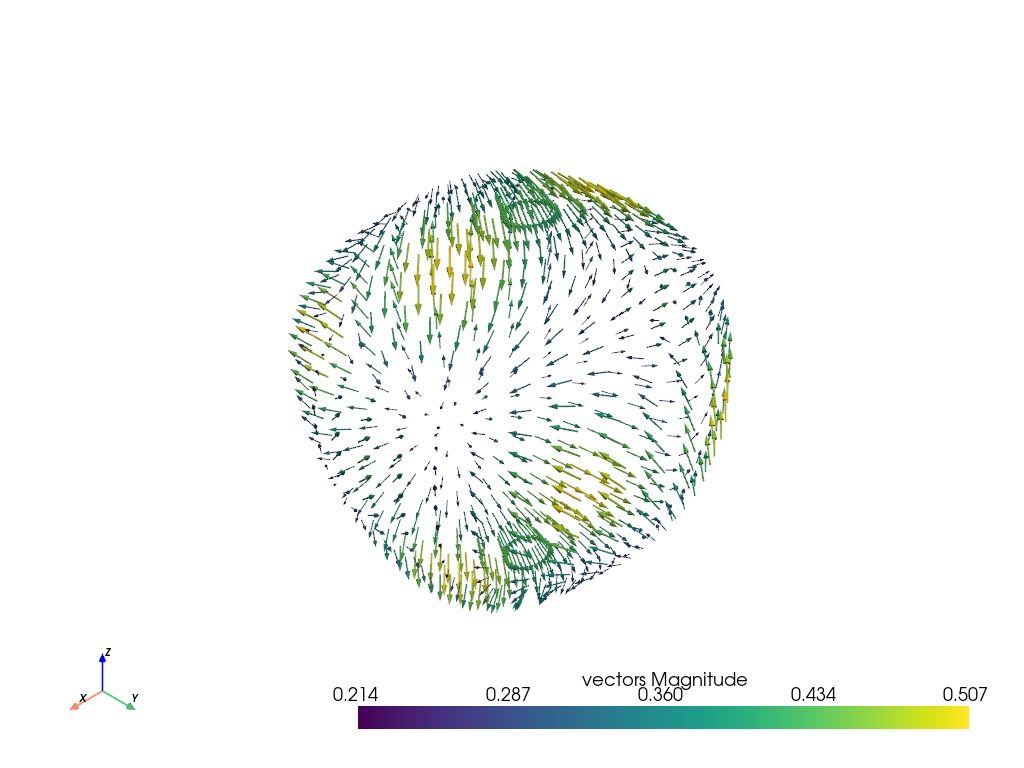
もう1つの方法は,ベクトルを直接メッシュオブジェクトにロードし, pyvista.DataSet.arrows プロパティにアクセスすることです.
sphere = pv.Sphere(radius=3.14)

# make cool swirly pattern
vectors = np.vstack(
    (
        np.sin(sphere.points[:, 0]),
        np.cos(sphere.points[:, 1]),
        np.cos(sphere.points[:, 2]),
    ),
).T

# add and scale
sphere['vectors'] = vectors * 0.3
sphere.set_active_vectors('vectors')

# plot just the arrows
sphere.arrows.plot()
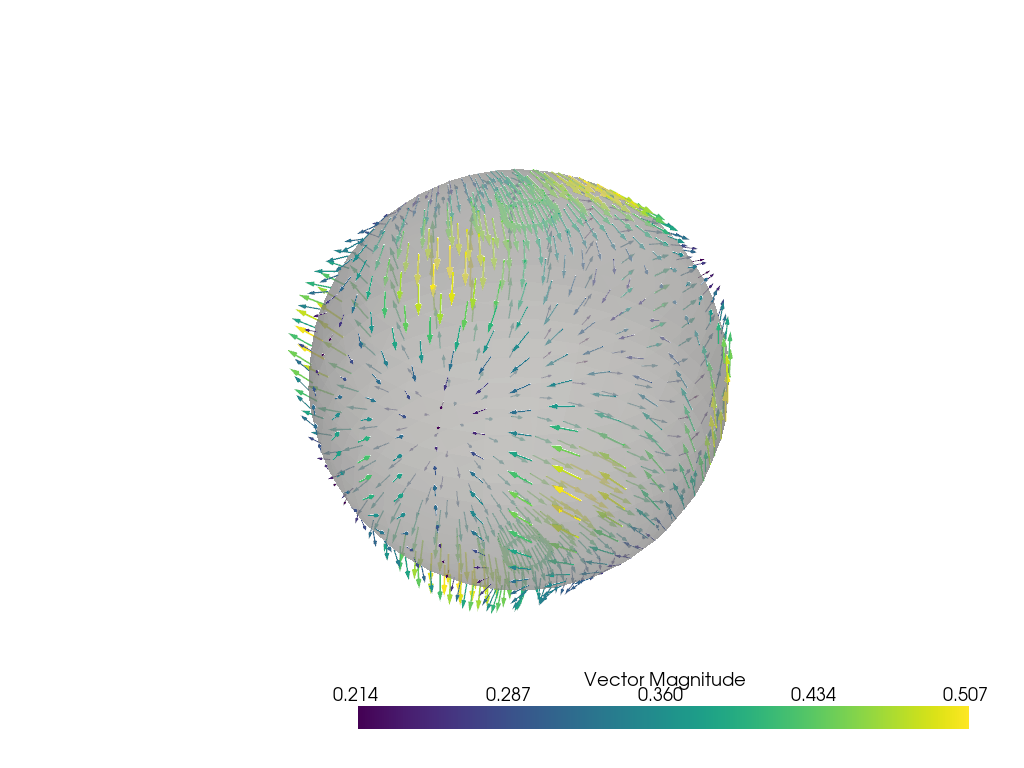
矢印と球体をプロットします.
p = pv.Plotter()
p.add_mesh(sphere.arrows, lighting=False, scalar_bar_args={'title': 'Vector Magnitude'})
p.add_mesh(sphere, color='grey', ambient=0.6, opacity=0.5, show_edges=False)
p.show()
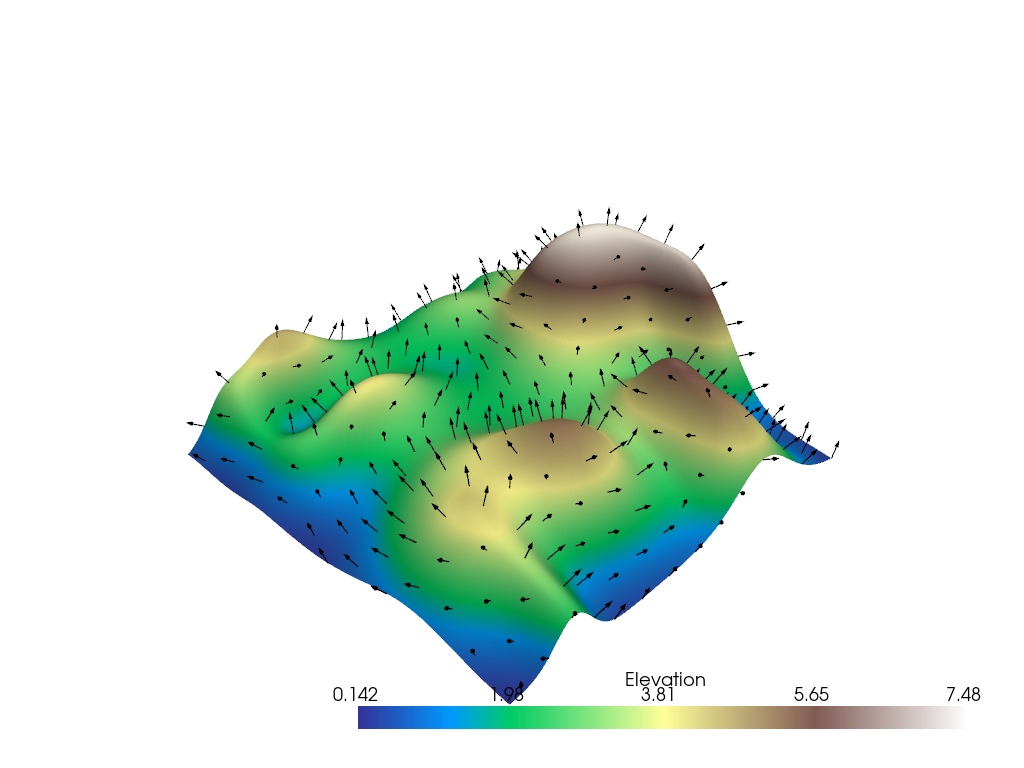
字形のサブセット#
入力データセットのすべてのノードにグリフが必要ない場合があります.この場合,マージ許容値を使用して,入力データセットのサブセットのグリフを作成することを選択できます.ここでは,5パーセントのマージ許容値を指定します.これは,バウンディングボックスの長さの5パーセントに相当します.
# Example dataset with normals
mesh = examples.load_random_hills()

# create a subset of arrows using the glyph filter
arrows = mesh.glyph(scale='Normals', orient='Normals', tolerance=0.05)

p = pv.Plotter()
p.add_mesh(arrows, color='black')
p.add_mesh(mesh, scalars='Elevation', cmap='terrain', smooth_shading=True)
p.show()
Total running time of the script: (0 minutes 11.817 seconds)