注釈
Go to the end to download the full example code.
Visualize Anatomical Groups#
This example visualizes different anatomical groups using the segmentation
labels available from the downloadable datasets
download_whole_body_ct_female() and
download_whole_body_ct_male().
These datasets include labels for 117 anatomical structures. In this example, the labels are grouped by filtering the list of labels and coloring the labels with the recommended RGB values used by the 3DSlicer TotalSegmentator Extension.
from __future__ import annotations

import pyvista as pv
from pyvista import examples
Load Dataset#
Load a TotalSegmentator dataset. Can be the
male or
female female
subjects included with PyVista, or any other subject from the
TotalSegmentator dataset.
dataset = examples.download_whole_body_ct_female()
Get the label map used for plotting different anatomical groups.
label_map = dataset['label_map']
Get metadata associated with the dataset
# Get a list of all label names. This list will be filtered by group.
label_names = dataset['segmentations'].keys()

# Get color and id mappings included with the dataset. These are used to filter and
# color the contours.
names_to_colors = dataset.user_dict['names_to_colors']
names_to_ids = dataset.user_dict['names_to_ids']
ids_to_colors = dataset.user_dict['ids_to_colors']
Color Mapping#
Show the color mapping included with the dataset. Print the dictionary and format it to visually align the RGB values. The formatted dictionary is valid python code.
print(
    '{\n'
    + '\n'.join(
        f'    {"'" + name + "':":<32} ({R:>3}, {G:>3}, {B:>3}),'
        for name, (R, G, B) in names_to_colors.items()
    )
    + '\n}',
)
{
    'adrenal_gland_left':            (249, 186, 150),
    'adrenal_gland_right':           (249, 186, 150),
    'aorta':                         (224,  97,  76),
    'atrial_appendage_left':         (  0, 161, 196),
    'autochthon_left':               (171,  85,  68),
    'autochthon_right':              (171,  85,  68),
    'brachiocephalic_trunk':         (196, 121,  79),
    'brachiocephalic_vein_left':     (  0, 161, 196),
    'brachiocephalic_vein_right':    (  0, 151, 206),
    'brain':                         (250, 250, 225),
    'clavicula_left':                (205, 179, 108),
    'clavicula_right':               (205, 179, 108),
    'colon':                         (204, 168, 143),
    'common_carotid_artery_left':    (  0, 112, 165),
    'common_carotid_artery_right':   ( 10, 105, 155),
    'costal_cartilages':             (111, 184, 210),
    'duodenum':                      (255, 253, 229),
    'esophagus':                     (211, 171, 143),
    'femur_left':                    (255, 238, 170),
    'femur_right':                   (255, 238, 170),
    'gallbladder':                   (139, 150,  98),
    'gluteus_maximus_left':          (188,  95,  76),
    'gluteus_maximus_right':         (188,  95,  76),
    'gluteus_medius_left':           (178, 105,  76),
    'gluteus_medius_right':          (178, 105,  76),
    'gluteus_minimus_left':          (178,  95,  86),
    'gluteus_minimus_right':         (178,  95,  86),
    'heart':                         (206, 110,  84),
    'hip_left':                      (212, 188, 102),
    'hip_right':                     (212, 188, 102),
    'humerus_left':                  (205, 179, 108),
    'humerus_right':                 (205, 179, 108),
    'iliac_artery_left':             (216, 101,  79),
    'iliac_artery_right':            (216, 101,  79),
    'iliac_vena_left':               (  0, 151, 206),
    'iliac_vena_right':              (  0, 151, 206),
    'iliopsoas_left':                (188,  95,  76),
    'iliopsoas_right':               (188,  95,  76),
    'inferior_vena_cava':            (  0, 151, 206),
    'kidney_cyst_left':              (205, 205, 100),
    'kidney_cyst_right':             (205, 205, 100),
    'kidney_left':                   (185, 102,  83),
    'kidney_right':                  (185, 102,  83),
    'liver':                         (221, 130, 101),
    'lung_lower_lobe_left':          (224, 186, 162),
    'lung_lower_lobe_right':         (224, 186, 162),
    'lung_middle_lobe_right':        (202, 164, 140),
    'lung_upper_lobe_left':          (172, 138, 115),
    'lung_upper_lobe_right':         (172, 138, 115),
    'pancreas':                      (249, 180, 111),
    'portal_vein_and_splenic_vein':  (  0, 151, 206),
    'prostate':                      (230, 158, 140),
    'pulmonary_vein':                (  0, 122, 171),
    'rib_left_1':                    (253, 232, 158),
    'rib_left_10':                   (253, 232, 158),
    'rib_left_11':                   (253, 232, 158),
    'rib_left_12':                   (253, 232, 158),
    'rib_left_2':                    (253, 232, 158),
    'rib_left_3':                    (253, 232, 158),
    'rib_left_4':                    (253, 232, 158),
    'rib_left_5':                    (253, 232, 158),
    'rib_left_6':                    (253, 232, 158),
    'rib_left_7':                    (253, 232, 158),
    'rib_left_8':                    (253, 232, 158),
    'rib_left_9':                    (253, 232, 158),
    'rib_right_1':                   (253, 232, 158),
    'rib_right_10':                  (253, 232, 158),
    'rib_right_11':                  (253, 232, 158),
    'rib_right_12':                  (253, 232, 158),
    'rib_right_2':                   (253, 232, 158),
    'rib_right_3':                   (253, 232, 158),
    'rib_right_4':                   (253, 232, 158),
    'rib_right_5':                   (253, 232, 158),
    'rib_right_6':                   (253, 232, 158),
    'rib_right_7':                   (253, 232, 158),
    'rib_right_8':                   (253, 232, 158),
    'rib_right_9':                   (253, 232, 158),
    'sacrum':                        (212, 188, 102),
    'scapula_left':                  (212, 188, 102),
    'scapula_right':                 (212, 188, 102),
    'skull':                         (241, 213, 144),
    'small_bowel':                   (205, 167, 142),
    'spinal_cord':                   (244, 214,  49),
    'spleen':                        (157, 108, 162),
    'sternum':                       (244, 217, 154),
    'stomach':                       (216, 132, 105),
    'subclavian_artery_left':        (216, 101,  69),
    'subclavian_artery_right':       (216, 101,  89),
    'superior_vena_cava':            (  0, 141, 226),
    'thyroid_gland':                 (220, 160,  30),
    'trachea':                       (182, 228, 255),
    'urinary_bladder':               (222, 154, 132),
    'vertebrae_C1':                  (255, 255, 207),
    'vertebrae_C2':                  (255, 255, 207),
    'vertebrae_C3':                  (255, 255, 207),
    'vertebrae_C4':                  (255, 255, 207),
    'vertebrae_C5':                  (255, 255, 207),
    'vertebrae_C6':                  (255, 255, 207),
    'vertebrae_C7':                  (255, 255, 207),
    'vertebrae_L1':                  (212, 188, 102),
    'vertebrae_L2':                  (212, 188, 102),
    'vertebrae_L3':                  (212, 188, 102),
    'vertebrae_L4':                  (212, 188, 102),
    'vertebrae_L5':                  (212, 188, 102),
    'vertebrae_S1':                  (212, 208, 122),
    'vertebrae_T1':                  (226, 202, 134),
    'vertebrae_T10':                 (226, 202, 134),
    'vertebrae_T11':                 (226, 202, 134),
    'vertebrae_T12':                 (226, 202, 134),
    'vertebrae_T2':                  (226, 202, 134),
    'vertebrae_T3':                  (226, 202, 134),
    'vertebrae_T4':                  (226, 202, 134),
    'vertebrae_T5':                  (226, 202, 134),
    'vertebrae_T6':                  (226, 202, 134),
    'vertebrae_T7':                  (226, 202, 134),
    'vertebrae_T8':                  (226, 202, 134),
    'vertebrae_T9':                  (226, 202, 134),
}
Utility Functions#
Define helper functions to visualize the data.
filter_labels#
To visualize a particular group of anatomic regions, we first define a function to filter the labels by name. Given a list of terms, the function returns any label which contains any of the search terms.
def filter_labels(label_names: list[str], search_terms: list[str]):
    def include_label(label_name: str):
        return any(target in label_name for target in search_terms)

    return [label for label in label_names if include_label(label)]
plot_anatomy#
Define a function which, given a list of terms, will look up labels associated
with those terms, generate contours for the labels, and plot the result. The function
uses contour_labels() for generating contours and
color_labels() for coloring them.
def plot_anatomy(search_terms: list[str]):
    # Get a list of labels which contain any of the listed terms.
    group_names = filter_labels(label_names, search_terms)

    # Get the label ids corresponding to the matched labels.
    group_ids = [names_to_ids[name] for name in group_names]

    # Selectively generate surfaces for the specified labels
    group_surface = dataset['label_map'].contour_labels(select_inputs=group_ids)

    # Color the labels with the color mapping
    colored_surface = group_surface.color_labels(colors=ids_to_colors)

    # Plot the label map.
    pl = pv.Plotter()
    pl.add_mesh(colored_surface)
    pl.view_zx()
    pl.camera.up = (0, 0, 1)
    pl.show()
Anatomical Groups#
Group the labels and visualize the result.
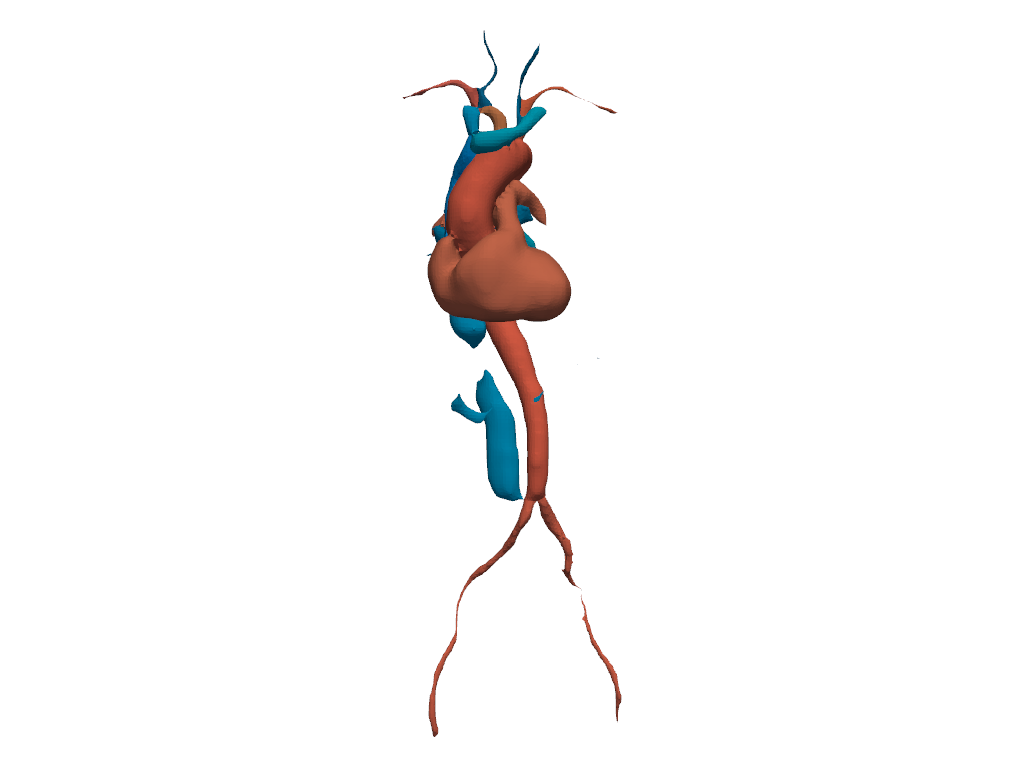
Cardiovascular System#
Show segments of the cardiovascular system.
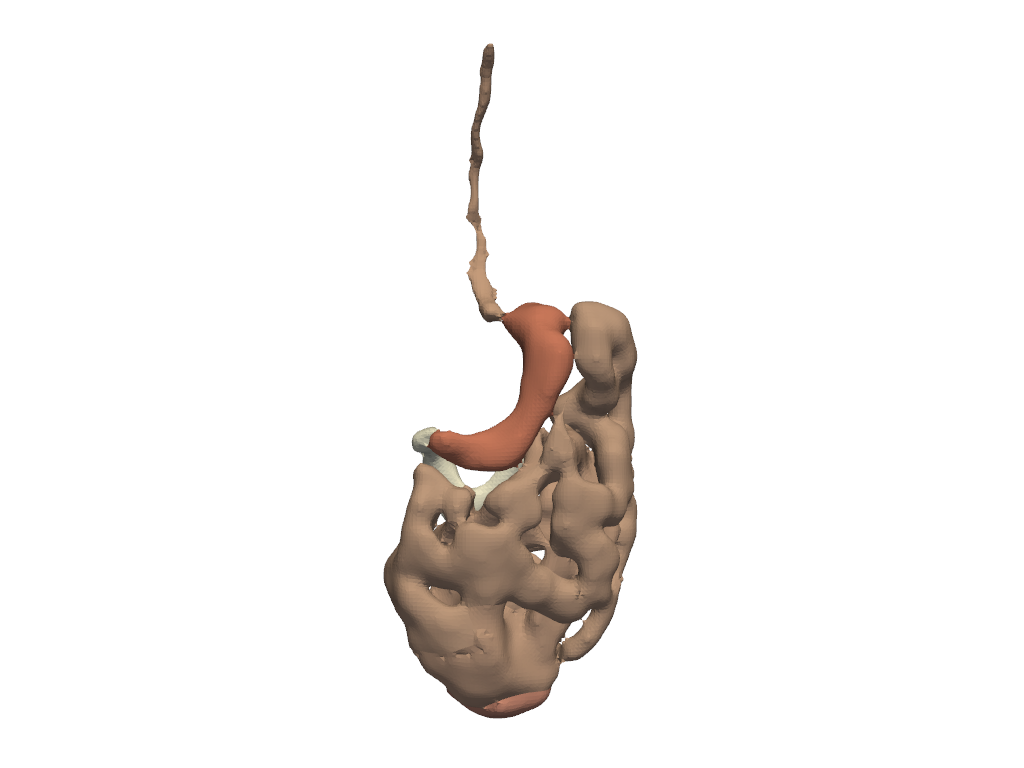
Gastrointestinal System#
Show segments of the gastrointestinal system.
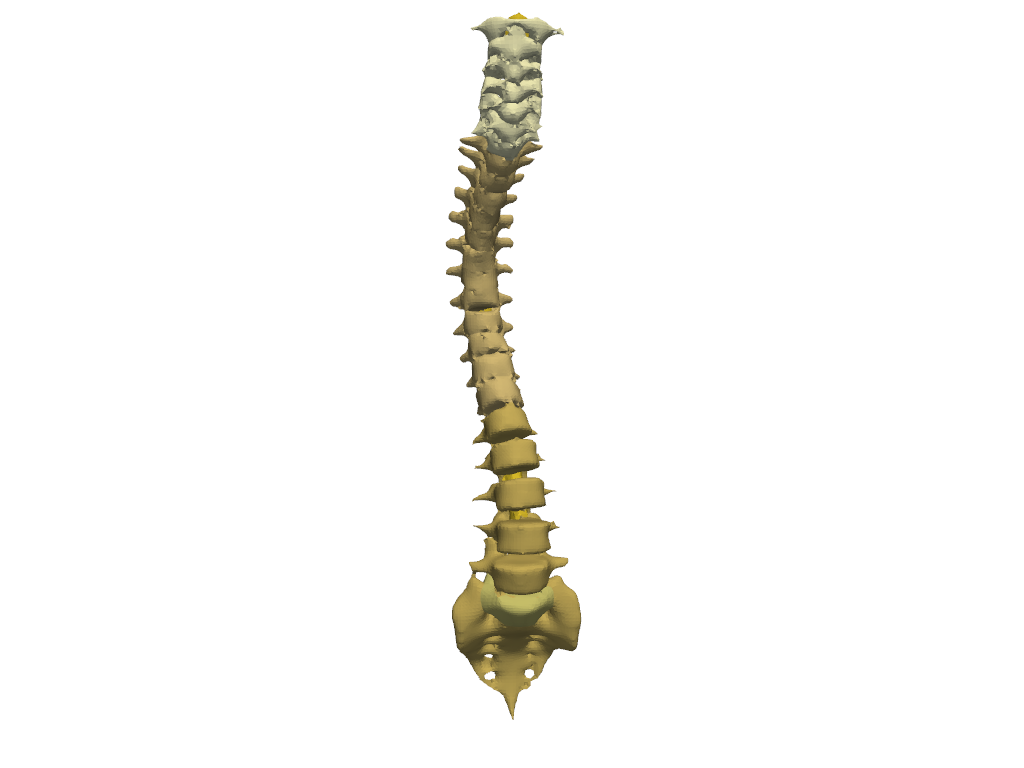
Spine#
Show segments of the spinal.
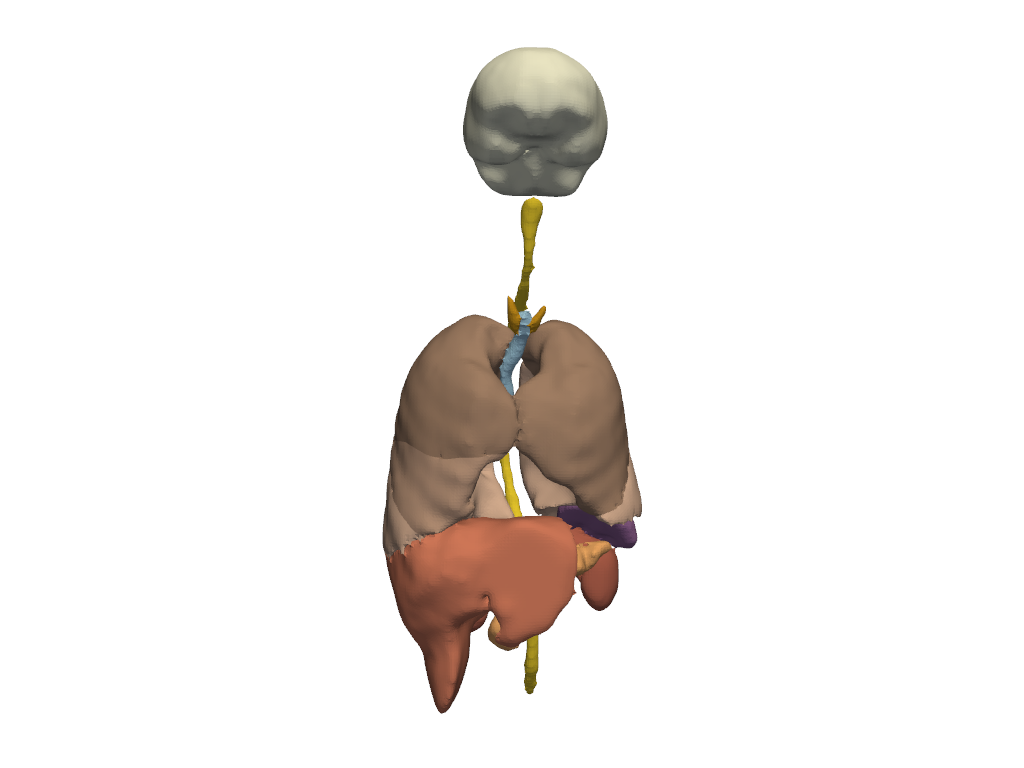
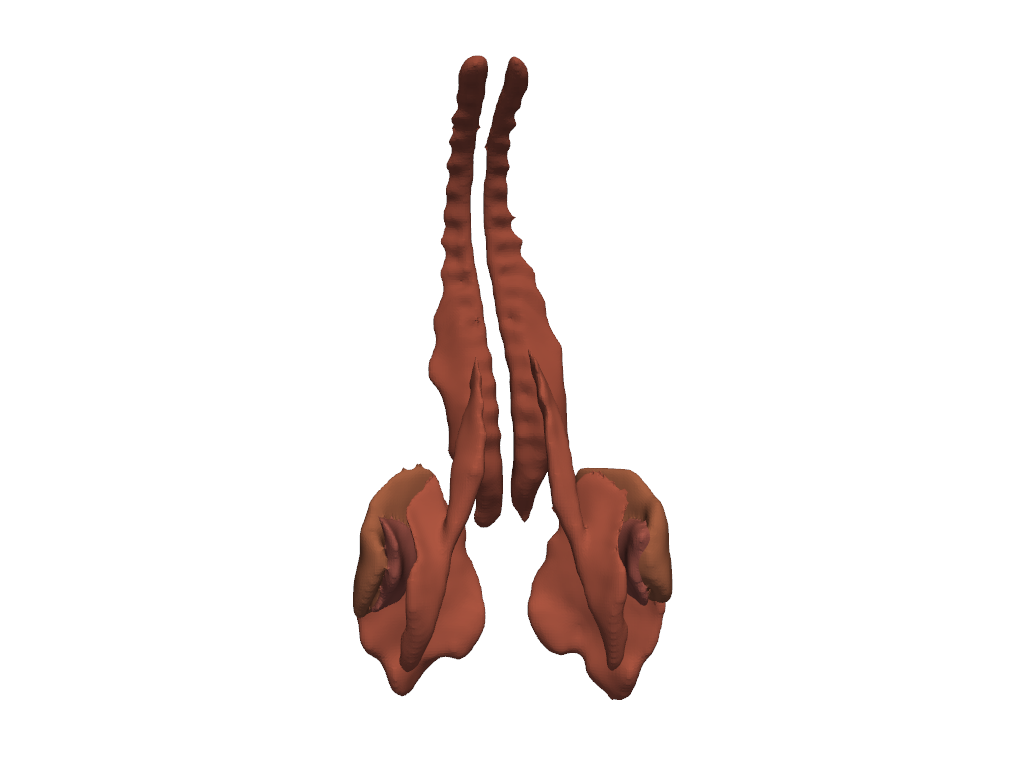
Other Organs#
Show other organs not included in the cardiovascular or gastrointestinal systems.
# Define terms which describe all relevant segments.
other_organs = [
    'brain',
    'spinal_cord',
    'thyroid_gland',
    'trachea',
    'lung',
    'adrenal_gland',
    'spleen',
    'liver',
    'gallbladder',
    'kidney',
    'pancreas',
    'prostate',
]

# Plot the labels associated with these terms.
plot_anatomy(other_organs)
Muscles#
Show the muscles.
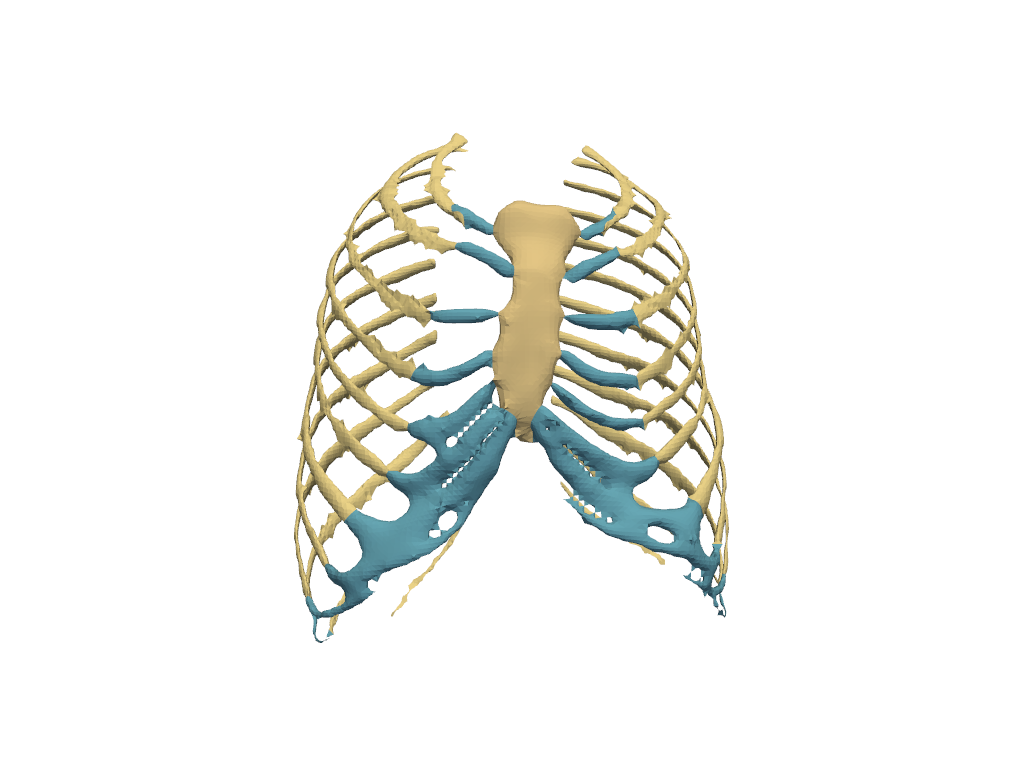
Ribs#
Show the ribs.
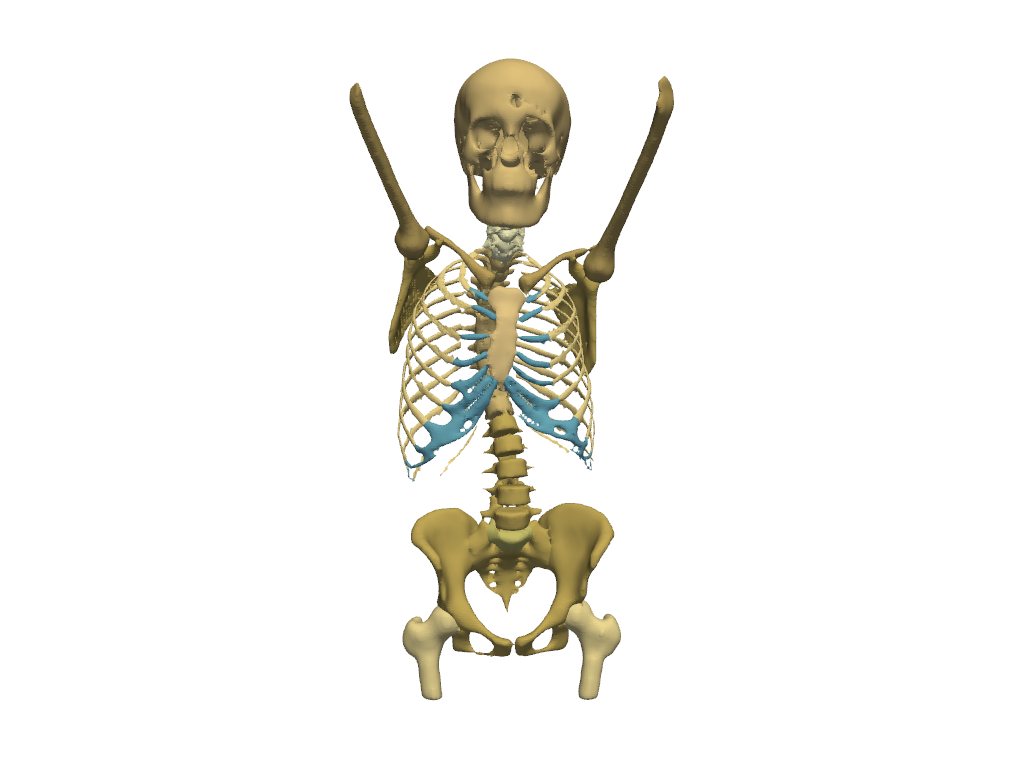
Skeleton#
Show the skeleton.
Total running time of the script: (0 minutes 11.668 seconds)