注釈
Go to the end をクリックすると完全なサンプルコードをダウンロードできます.
テクスチャを適用する#
イメージをテクスチャとして投影したメッシュをプロットします.
from __future__ import annotations

from matplotlib.pyplot import get_cmap
import numpy as np

import pyvista as pv
from pyvista import examples
テクスチャマッピングは,PyVistaを使用して簡単に実装できます.多くのジオメトリックオブジェクトには,テクスチャ座標があらかじめロードされているため,サーフェスをすばやく作成してイメージを表示するのは,次のように簡単です:
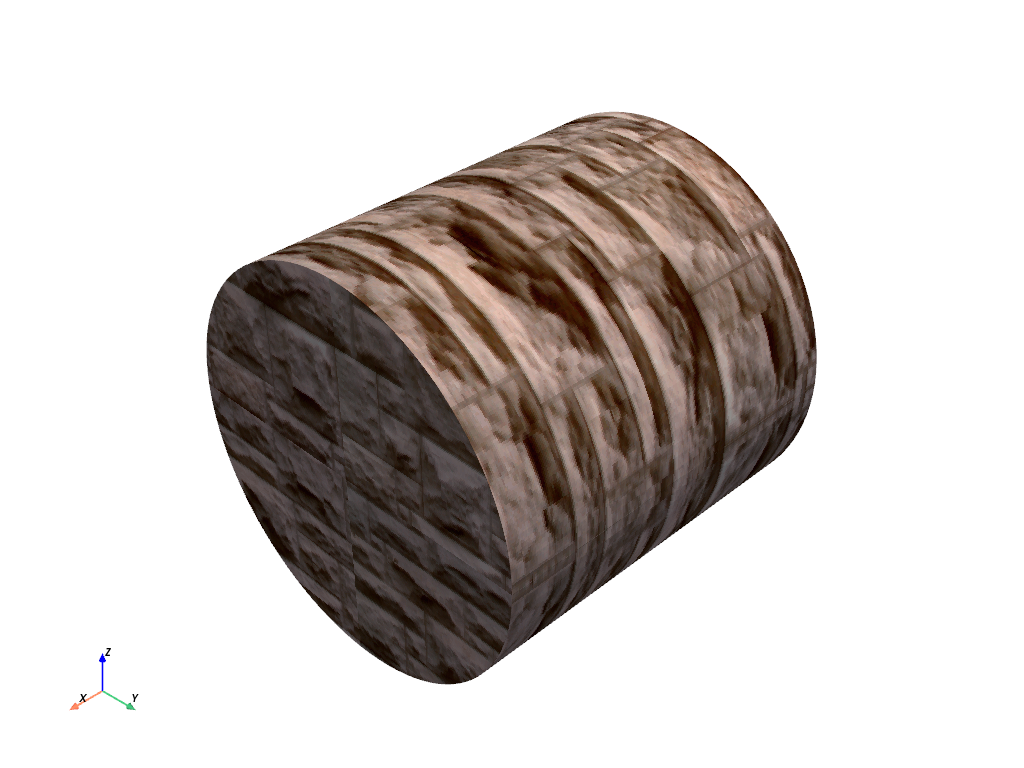
# load a sample texture
tex = examples.download_masonry_texture()

# create a surface to host this texture
surf = pv.Cylinder()

surf.plot(texture=tex)
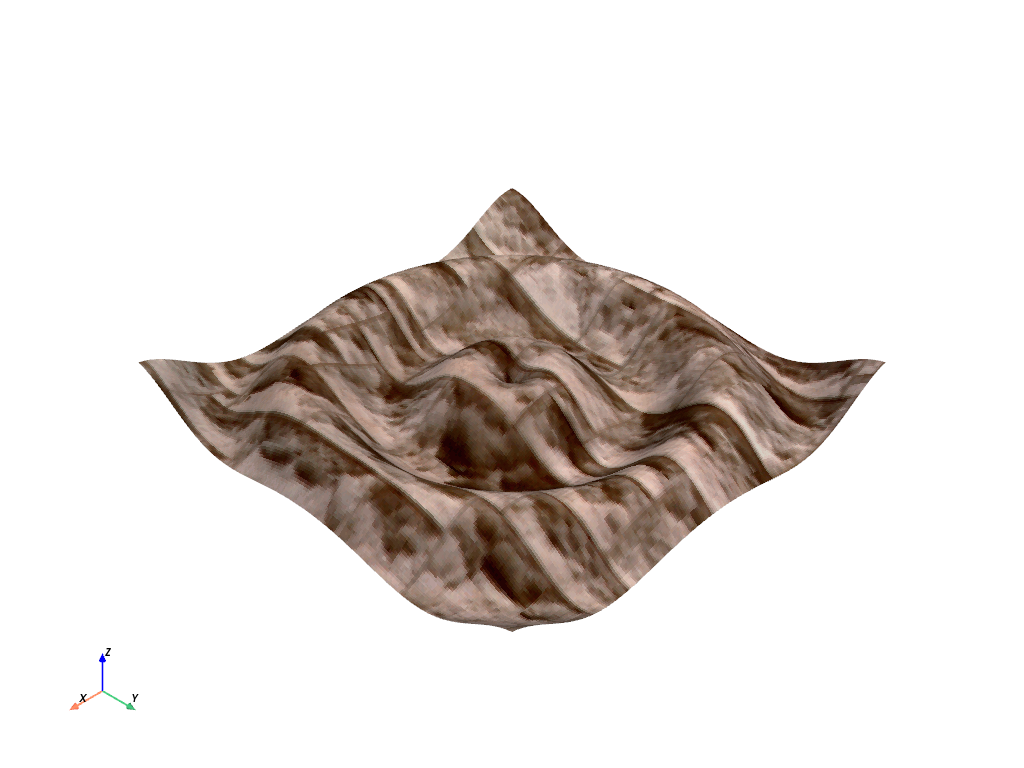
しかし,データセットにテクスチャ座標がない場合はどうでしょうか.その後, pyvista.DataSetFilters.texture_map_to_plane() フィルタを利用して,イメージをデータセットのサーフェスに適切にマッピングできます.たとえば,同じレンガのイメージをカーブサーフェスにマップします.
# create a structured surface
x = np.arange(-10, 10, 0.25)
y = np.arange(-10, 10, 0.25)
x, y = np.meshgrid(x, y)
r = np.sqrt(x**2 + y**2)
z = np.sin(r)
curvsurf = pv.StructuredGrid(x, y, z)

# Map the curved surface to a plane - use best fitting plane
curvsurf.texture_map_to_plane(inplace=True)

curvsurf.plot(texture=tex)
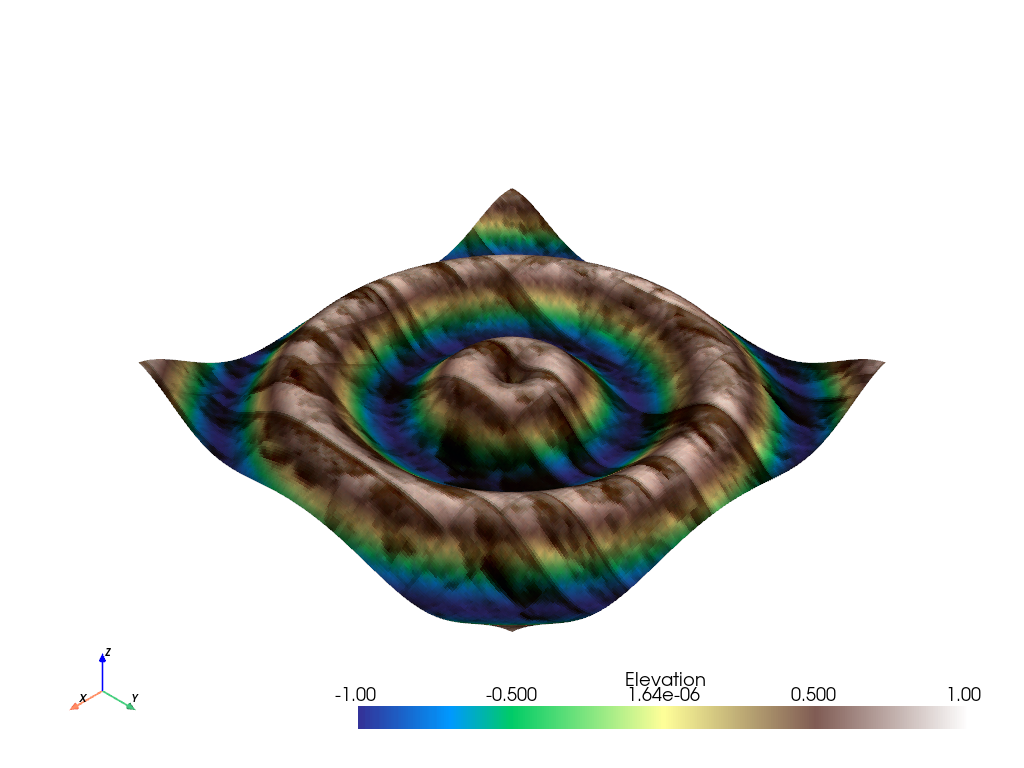
Display scalar data along with a texture by ensuring the
interpolate_before_map setting is False and specifying both the
texture and scalars arguments.
elevated = curvsurf.elevation()

elevated.plot(scalars='Elevation', cmap='terrain', texture=tex, interpolate_before_map=False)
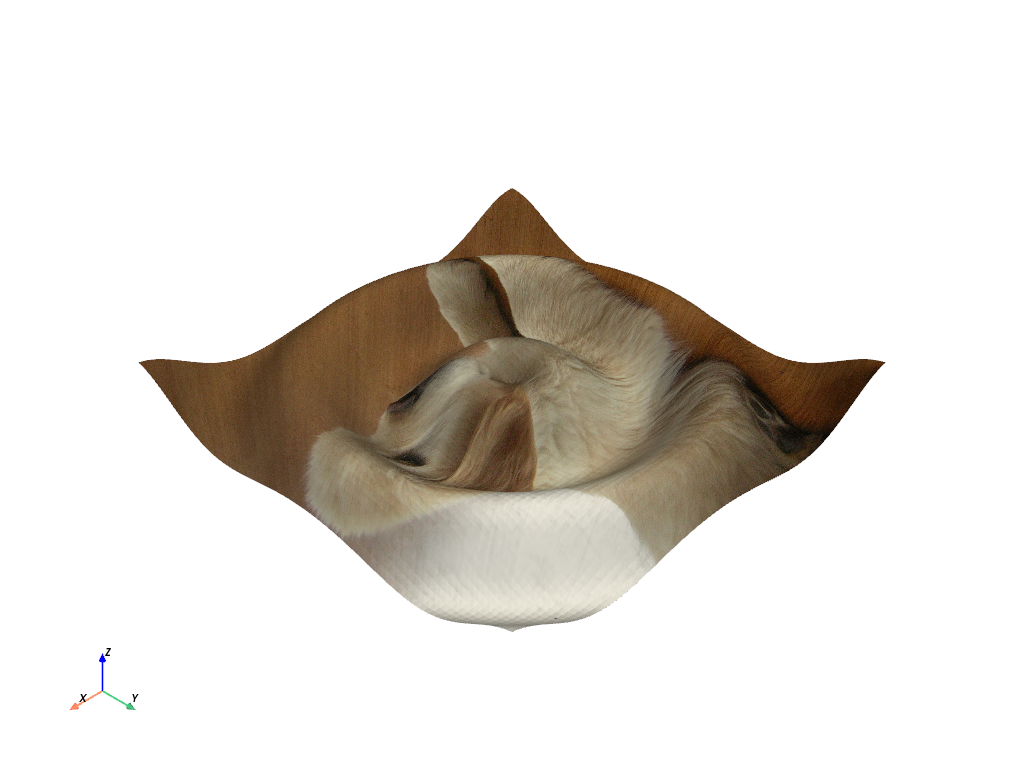
このプロセスは任意のイメージテクスチャで完了できることに注意してください.
# use the puppy image
tex = examples.download_puppy_texture()
curvsurf.plot(texture=tex)
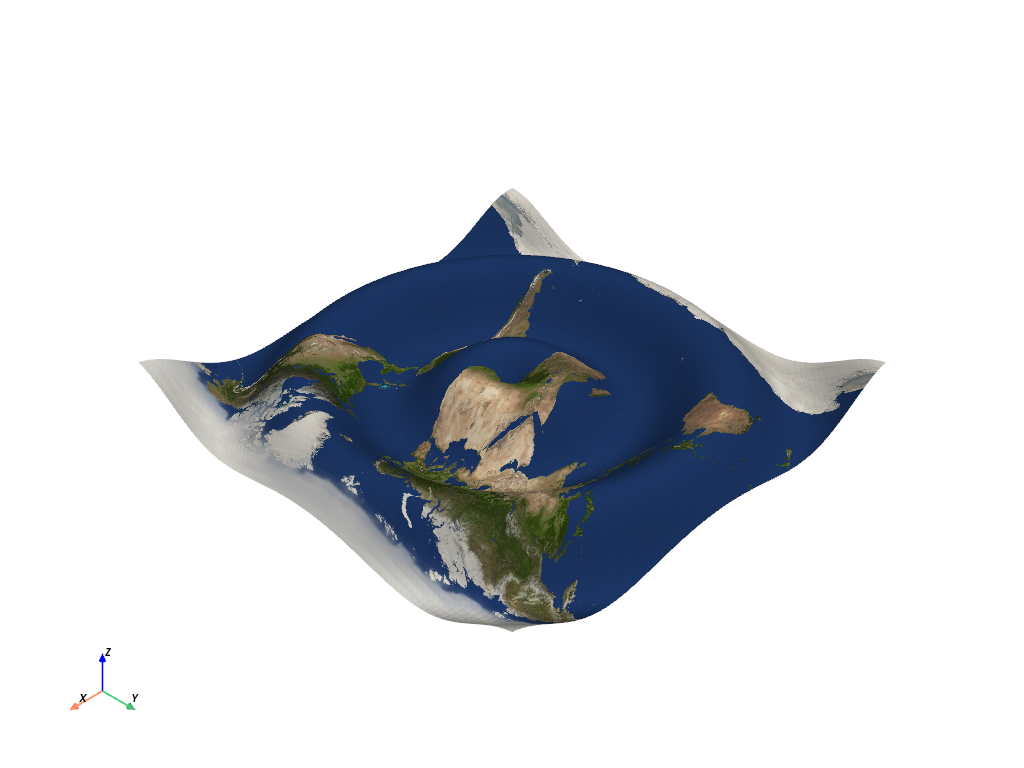
ファイルからのテクスチャ#
イメージから独自のテクスチャをロードするのはどうでしょうか.これは多くの場合, pyvista.read_texture() 関数を使用して最も簡単に行うことができます-単に画像ファイルのパスを渡すだけで,この関数はあなたが使用するために vtkTexture を作るハンドルを持っています.
image_file = examples.mapfile
tex = pv.read_texture(image_file)
curvsurf.plot(texture=tex)
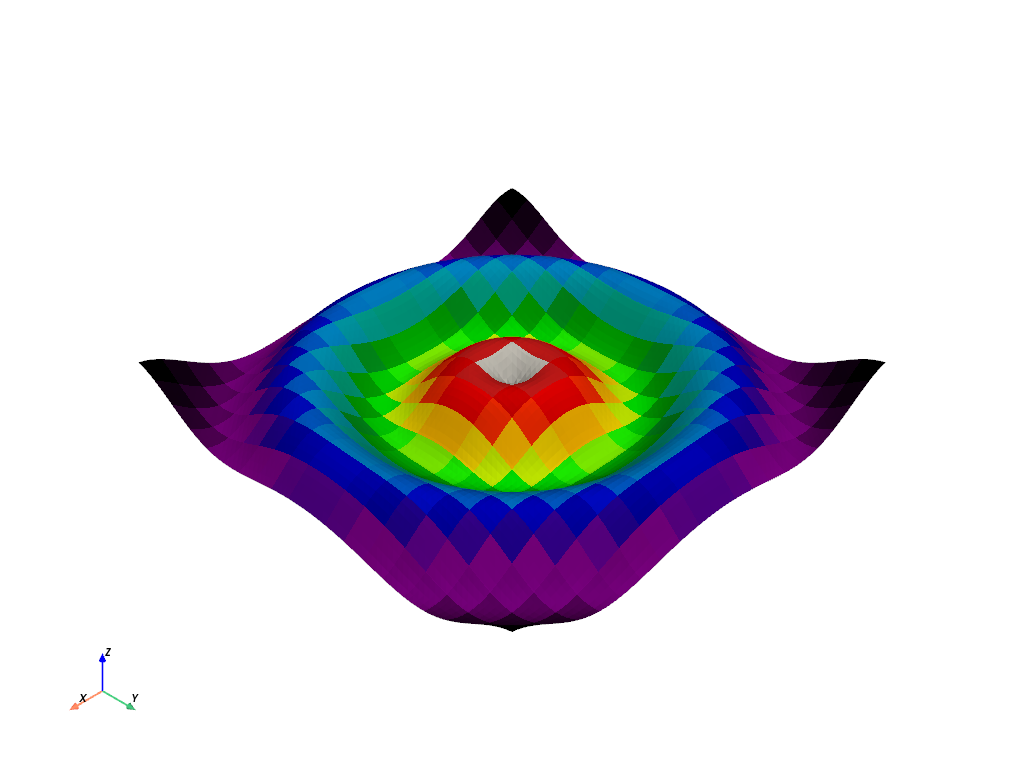
テクスチャとしてのNumPy配列#
プログラムで作成されたイメージを使用したい場合? pyvista.ImageData オブジェクトは pyvista.image_to_texture() を使用してテクスチャに変換でき,3 D NumPy (X x Y,RGB)配列は pyvista.numpy_to_texture() を使用してテクスチャに変換できます.
# create an image using numpy,
xx, yy = np.meshgrid(np.linspace(-200, 200, 20), np.linspace(-200, 200, 20))
A, b = 500, 100
zz = A * np.exp(-0.5 * ((xx / b) ** 2.0 + (yy / b) ** 2.0))

# Creating a custom RGB image
cmap = get_cmap('nipy_spectral')
norm = lambda x: (x - np.nanmin(x)) / (np.nanmax(x) - np.nanmin(x))
hue = norm(zz.ravel())
colors = (cmap(hue)[:, 0:3] * 255.0).astype(np.uint8)
image = colors.reshape((xx.shape[0], xx.shape[1], 3), order='F')

# Convert 3D numpy array to texture
tex = pv.numpy_to_texture(image)

# Render it
curvsurf.plot(texture=tex)
テクスチャを更新しながらGIFムービーを作成#
テクスチャを更新しながら,アクティブなプロッタから動くgifを生成します.
mesh = curvsurf.extract_surface()

# Create a plotter object
plotter = pv.Plotter(notebook=False, off_screen=True)

actor = plotter.add_mesh(mesh, smooth_shading=True, color='white')

# Open a gif
plotter.open_gif('texture.gif')

# Update Z and write a frame for each updated position
nframe = 15
for phase in np.linspace(0, 2 * np.pi, nframe + 1)[:nframe]:
    # create an image using numpy,
    z = np.sin(r + phase)
    mesh.points[:, -1] = z.ravel()

    # Creating a custom RGB image
    zz = A * np.exp(-0.5 * ((xx / b) ** 2.0 + (yy / b) ** 2.0))
    hue = norm(zz.ravel()) * 0.5 * (1.0 + np.sin(phase))
    colors = (cmap(hue)[:, 0:3] * 255.0).astype(np.uint8)
    image = colors.reshape((xx.shape[0], xx.shape[1], 3), order='F')

    # Convert 3D numpy array to texture
    actor.texture = pv.numpy_to_texture(image)

    # must update normals when smooth shading is enabled
    mesh.compute_normals(cell_normals=False, inplace=True)
    plotter.write_frame()
    plotter.clear()

# Closes and finalizes movie
plotter.close()
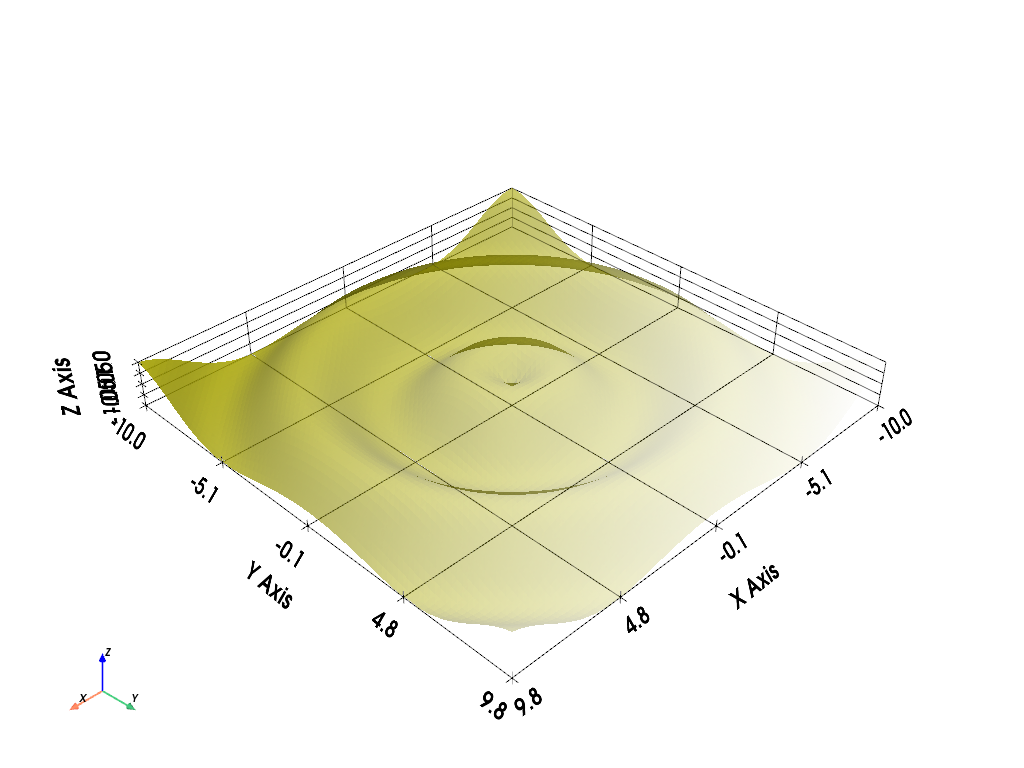
透明度のあるテクスチャ#
テクスチャでは,ピクセル単位の不透明度値も指定できます.画像は0 [透明]から255 [不透明]までの不透明度値を指定する第4チャンネルを含まなければなりません.この機能を有効にするためには,画像の第4チャンネルとして不透明度配列を形[行,例, 4] pyvista.numpy_to_texture() の3次元マトリックスとして渡すだけです.
ここでは,アルファチャンネルを含むイメージをダウンロードできます:
rgba = examples.download_rgba_texture()
rgba.n_components
4
# Render it
curvsurf.plot(texture=rgba, show_grid=True)
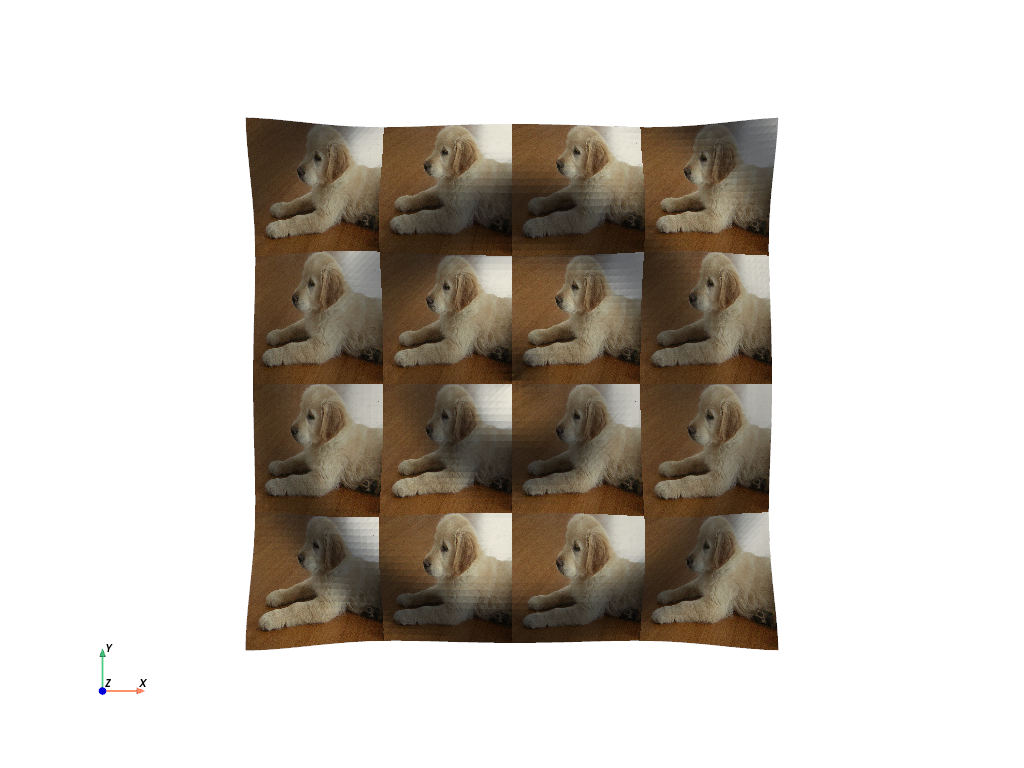
テクスチャを繰り返す#
単一のテクスチャをメッシュ全体で繰り返したい場合はどうすればよいですか.すべてのノードのテクスチャ座標を明示的に定義するだけです.
ここでは,テクスチャ座標を作成して,1つのテクスチャの複数のマッピングでグリッドを埋めます.これを行うには,一般的な (0, 1) 範囲外のテクスチャ座標を定義する必要があります.
axial_num_puppies = 4
xc = np.linspace(0, axial_num_puppies, curvsurf.dimensions[0])
yc = np.linspace(0, axial_num_puppies, curvsurf.dimensions[1])

xxc, yyc = np.meshgrid(xc, yc)
puppy_coords = np.c_[yyc.ravel(), xxc.ravel()]
各軸で (0, 4) の範囲のテクスチャ座標を定義することにより,このメッシュ上に同じテクスチャの4つの反復を生成します.
次に, pyvista.DataSet.active_texture_coordinates プロパティを使用して,これらのテクスチャ座標をメッシュに関連付ける必要があります.
curvsurf.active_texture_coordinates = puppy_coords
今子犬を全部展示しています.
# use the puppy image
tex = examples.download_puppy_texture()
curvsurf.plot(texture=tex, cpos='xy')
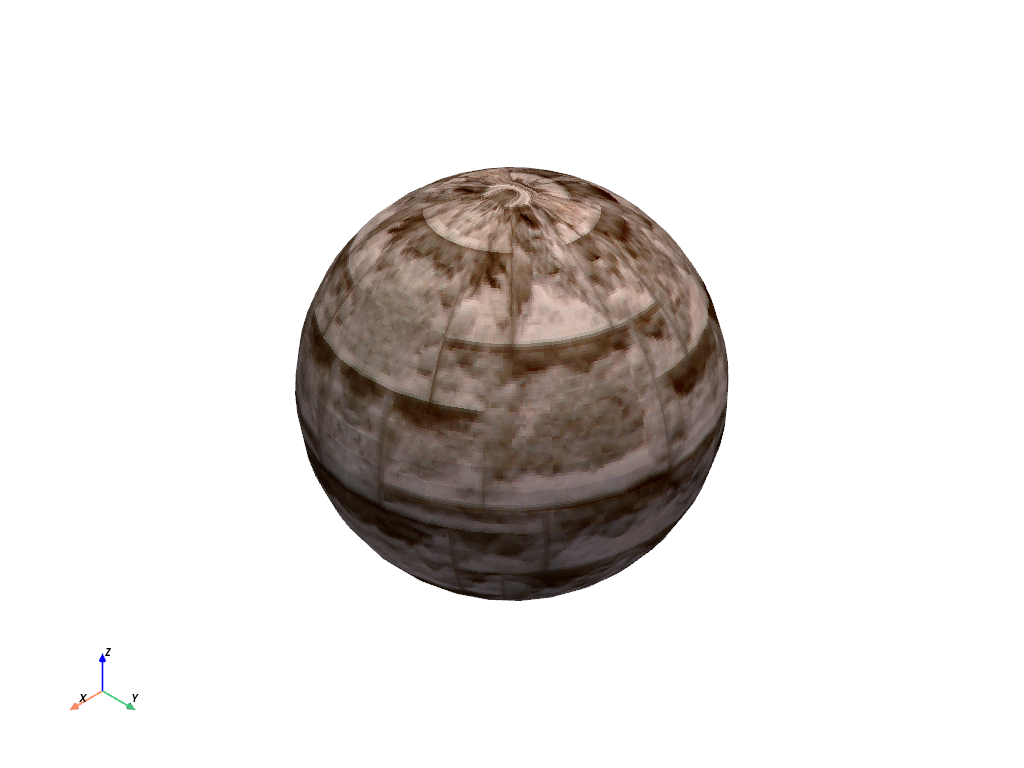
球状テクスチャ座標#
上でデモした平面マッピングのように,テクスチャを球座標系にマッピングするための組み込みの方法があります.
mesh = pv.Sphere()
tex = examples.download_masonry_texture()

mesh.texture_map_to_sphere(inplace=True)
mesh.plot(texture=tex)
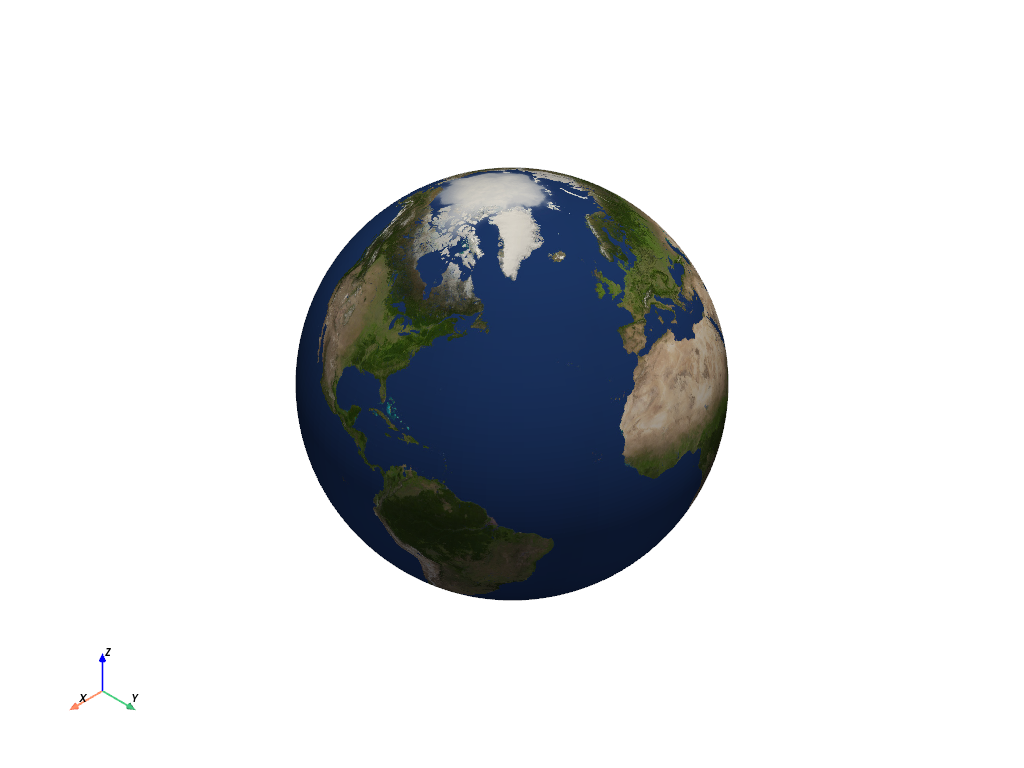
上記のヘルパーメソッドは,必ずしも目的のテクスチャ座標を生成するわけではないため,手動で行う必要がある場合があります.これは このサポートイシュー からの素晴らしいユーザ投稿の例です.
地球マップのテクスチャ座標を手動で作成します.まず,地球として使用するメッシュを作成します. start_theta に若干の重複があることに注意してください.
sphere = pv.Sphere(
    radius=1,
    theta_resolution=120,
    phi_resolution=120,
    start_theta=270.001,
    end_theta=270,
)

# Initialize the texture coordinates array
sphere.active_texture_coordinates = np.zeros((sphere.points.shape[0], 2))

# Populate by manually calculating
for i in range(sphere.points.shape[0]):
    sphere.active_texture_coordinates[i] = [
        0.5 + np.arctan2(-sphere.points[i, 0], sphere.points[i, 1]) / (2 * np.pi),
        0.5 + np.arcsin(sphere.points[i, 2]) / np.pi,
    ]

# And let's display it with a world map
tex = examples.load_globe_texture()
sphere.plot(texture=tex)
Total running time of the script: (0 minutes 7.682 seconds)