注釈
Go to the end をクリックすると完全なサンプルコードをダウンロードできます.
ラベルポイント#
ポイントセットで文字列配列を使用してポイントにラベルを付ける
from __future__ import annotations

import numpy as np

import pyvista as pv


from pyvista import examples
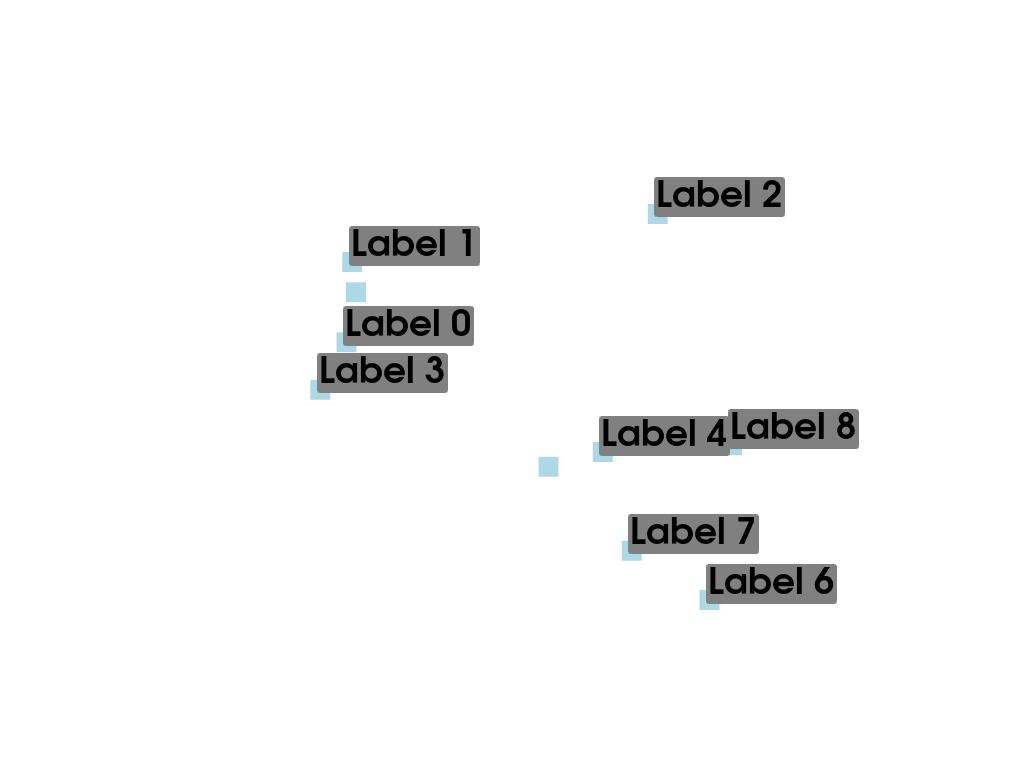
ラベル文字列配列#
この例では,各ノードの文字列ラベルの配列を使用して,メッシュのノードにラベルを付けます.
# Make some random points. Seed the rng for reproducibility.
rng = np.random.default_rng(seed=0)
poly = pv.PolyData(rng.random((10, 3)))
文字列ラベルをポイントデータに追加します.これにより,各ノードにラベルが関連付けられます.
poly['My Labels'] = [f'Label {i}' for i in range(poly.n_points)]
poly
Now plot the points with labels using add_point_labels().
plotter = pv.Plotter()
plotter.add_point_labels(poly, 'My Labels', point_size=20, font_size=36)
plotter.show()
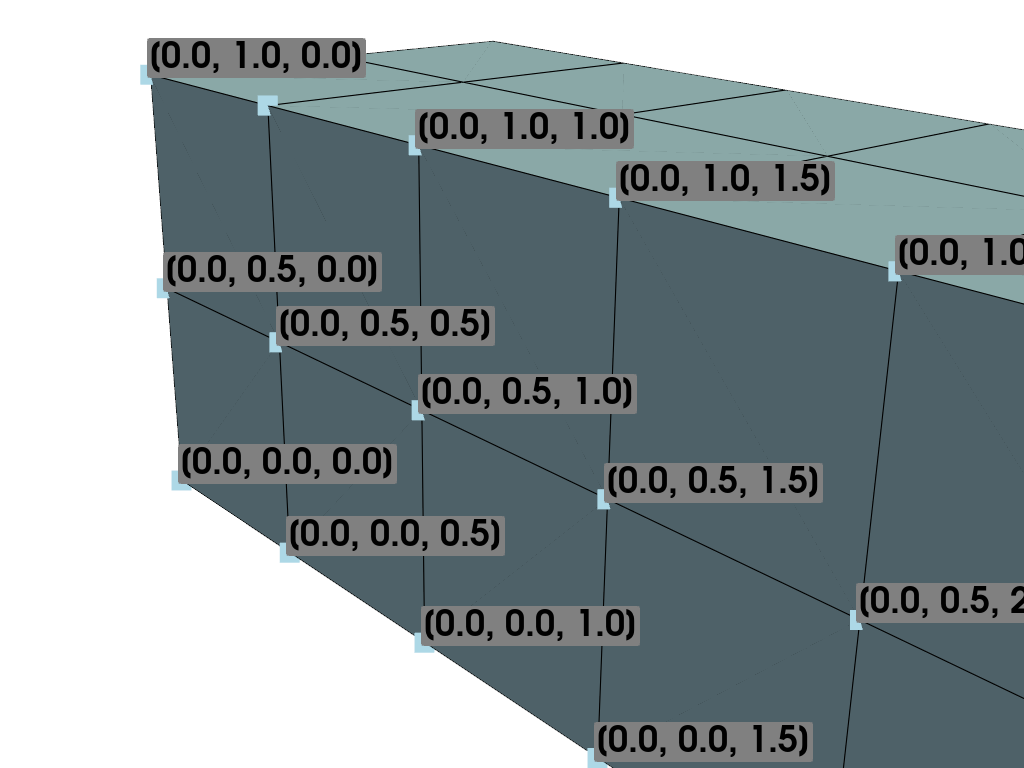
ラベルノードの位置#
この例では,メッシュの節点に座標位置のラベルを付けます.
# Load example beam file
grid = pv.UnstructuredGrid(examples.hexbeamfile)
プロッティングクラスを作成し,非構造化グリッドを追加します
plotter = pv.Plotter()
plotter.add_mesh(grid, show_edges=True, color='lightblue')

# Add labels to points on the yz plane (where x == 0)
points = grid.points
mask = points[:, 0] == 0
plotter.add_point_labels(points[mask], points[mask].tolist(), point_size=20, font_size=36)

plotter.camera_position = [(-1.5, 1.5, 3.0), (0.05, 0.6, 1.2), (0.2, 0.9, -0.25)]

plotter.show()
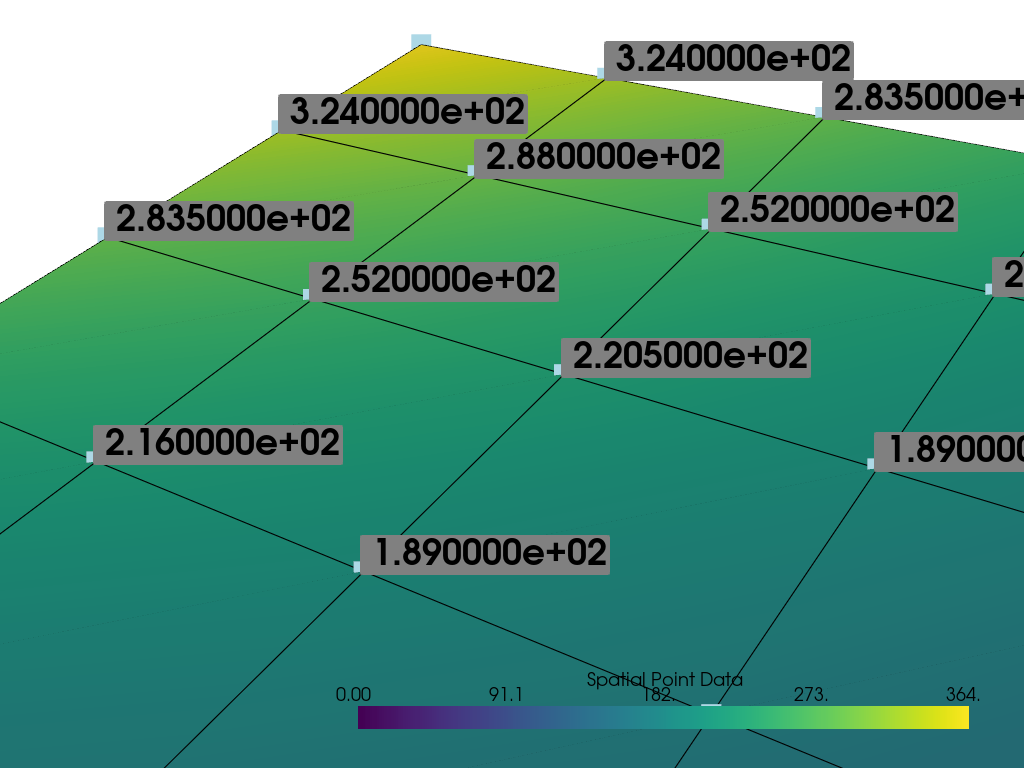
ラベルスカラー値#
この例では,各ポイントにスカラー値のラベルを付けます.
mesh = examples.load_uniform().slice()
p = pv.Plotter()

# Add the mesh:
p.add_mesh(mesh, scalars='Spatial Point Data', show_edges=True)
# Add the points with scalar labels:
p.add_point_scalar_labels(mesh, 'Spatial Point Data', point_size=20, font_size=36)

# Use a nice camera position:
p.camera_position = [(7, 4, 5), (4.4, 7.0, 7.2), (0.8, 0.5, 0.25)]

p.show()
Total running time of the script: (0 minutes 0.790 seconds)