注釈
Go to the end をクリックすると完全なサンプルコードをダウンロードできます.
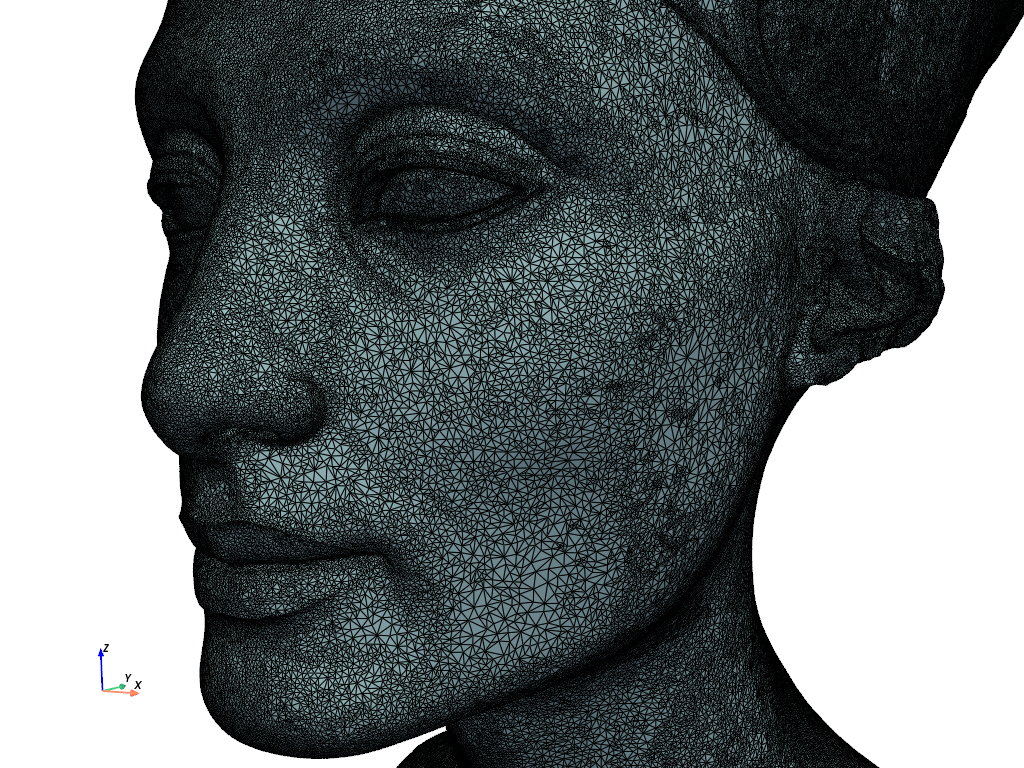
エッジを表示#
メッシュ内のすべてのジオメトリのエッジを表示
レンダリング時にメッシュのすべてのエッジを表示して,解像度などのデータセットの側面を伝えると便利な場合があります.
レンダリングされたデータセットのエッジを表示するには,データセットをプロットするときに True に show_edges キーワード引数を指定するだけです.
from __future__ import annotations

from pyvista import examples

nefertiti = examples.download_nefertiti()

# Camera position to zoom to face
face_view = [
    (194.57658338658473, -327.5539184202715, 28.106692235139377),
    (-10.46795453395034, -67.33281919301498, -19.938084799559192),
    (-0.05444711191580967, 0.13964269728441056, 0.9887039137674948),
]


nefertiti.plot(cpos=face_view, show_edges=True, color=True)
Total running time of the script: (0 minutes 11.980 seconds)