注釈
Go to the end to download the full example code.
スカラーバーをカスタマイズ#
スカラーバーのさまざまな機能と,ユーザーによるスカラーバーのカスタマイズ方法について説明します.
from __future__ import annotations

import pyvista as pv
from pyvista import examples
By default, when plotting a dataset with a scalar array, a scalar bar for that
array is added. To turn off this behavior, a user could specify
show_scalar_bar=False when calling add_mesh().
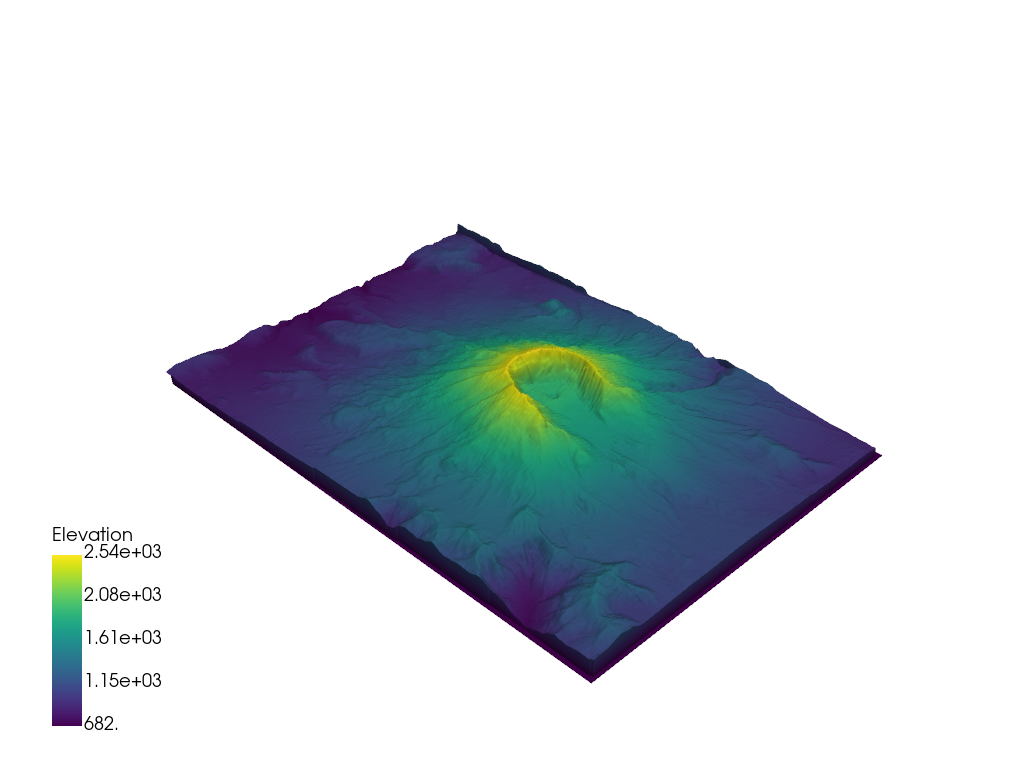
Let's start with a sample dataset provide via PyVista to demonstrate the default behavior of
scalar bar plotting:
# Load St Helens DEM and warp the topography
mesh = examples.download_st_helens().warp_by_scalar()

# First a default plot with jet colormap
p = pv.Plotter()
# Add the data, use active scalar for coloring, and show the scalar bar
p.add_mesh(mesh)
# Display the scene
p.show()

pyvista.Plotter.add_mesh() の scalar_bar_args パラメータを介してスカラーバーを制御するキーワード引数を渡すことにより,インタラクティブなスカラーバーでシーンをプロットして好きな場所に移動することもできます.スカラーバーを制御するキーワード引数は pyvista.Plotter.add_scalar_bar() で定義されます.
# create dictionary of parameters to control scalar bar
sargs = dict(interactive=True)  # Simply make the bar interactive

p = pv.Plotter(notebook=False)  # If in IPython, be sure to show the scene
p.add_mesh(mesh, scalar_bar_args=sargs)
p.show()
# Remove from plotters so output is not produced in docs
pv.plotting.plotter._ALL_PLOTTERS.clear()
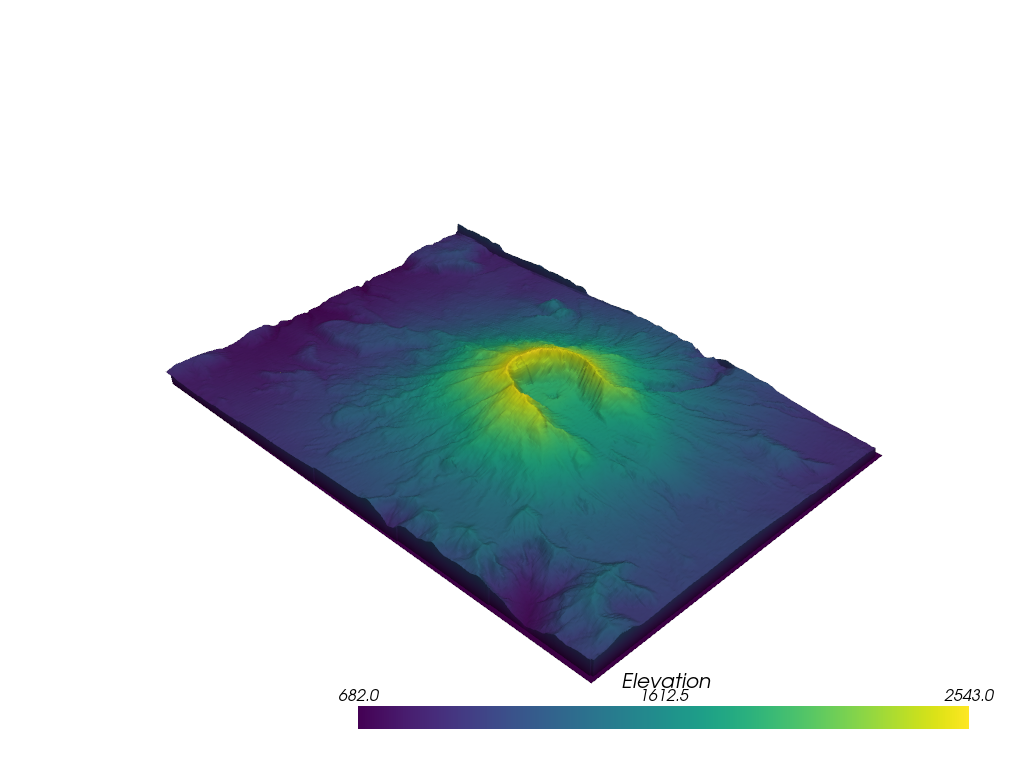
または,スカラーバーの位置を手動で定義します:
スカラーバーのテキストプロパティも制御できます:
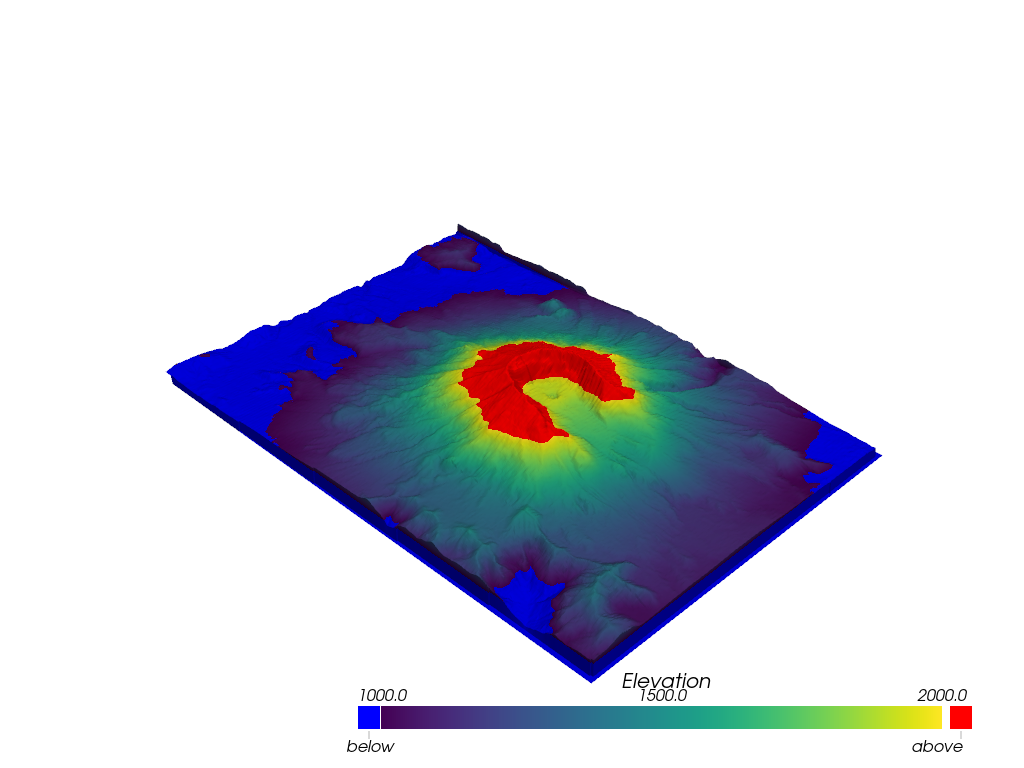
スカラー範囲外の値のラベル付け
p = pv.Plotter()
p.add_mesh(mesh, clim=[1000, 2000], below_color='blue', above_color='red', scalar_bar_args=sargs)
p.show()
辞書を使用して目的の値に注釈を付けます.ディクショナリのキーは注釈を付ける値で,値は文字列ラベルである必要があります.
# Make a dictionary for the annotations
annotations = {
    2300: 'High',
    805.3: 'Cutoff value',
}

p = pv.Plotter()
p.add_mesh(mesh, scalars='Elevation', annotations=annotations)
p.show()

Total running time of the script: (0 minutes 10.915 seconds)