注釈
Go to the end をクリックすると完全なサンプルコードをダウンロードできます.
フィールドの勾配を計算する#
Estimate the gradient of a scalar or vector field in a data set.
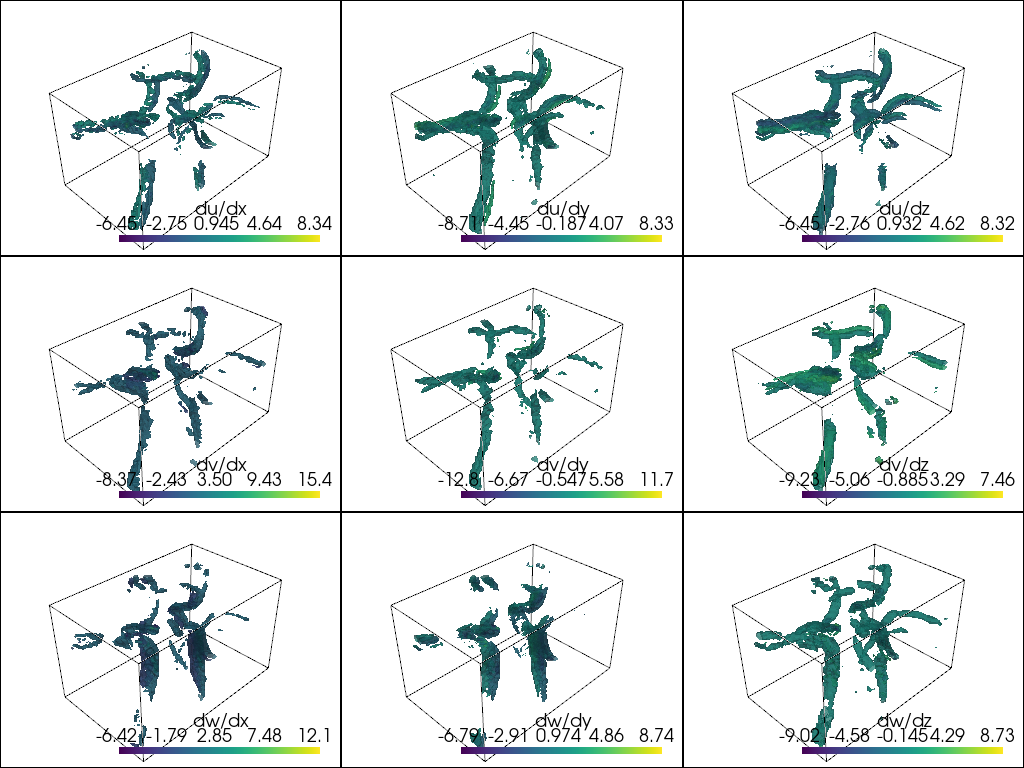
入力配列 {u, v, w} の場合,出力グラディエントタプルの順序は {du/dx, du/dy, du/dz, dv/dx, dv/dy, dv/dz, dw/dx, dw/dy, dw/dz} になります.
pyvista.DataSetFilters.compute_derivative() フィルタを表示します.
from __future__ import annotations

import numpy as np

import pyvista as pv
from pyvista import examples

# A vtkStructuredGrid - but could be any mesh type
mesh = examples.download_carotid()
mesh
ここで,そのメッシュの点データにおける vectors ベクトルフィールドの勾配を計算する.これは pyvista.DataSetFilters.compute_derivative() を呼び出すのと同じくらい簡単です.
mesh_g = mesh.compute_derivative(scalars='vectors')
mesh_g['gradient']
pyvista_ndarray([[ 7.2189998e-03,  7.6569999e-03,  3.8799997e-03, ...,
                  -7.3850001e-03,  1.0060001e-03, -2.1000043e-05],
                 [ 4.2885002e-03,  9.3000010e-04, -6.5520001e-03, ...,
                  -6.1399997e-03,  3.6770001e-03,  1.1730000e-02],
                 [ 5.4014996e-03,  1.2539998e-03, -4.6510003e-03, ...,
                   3.4900010e-04,  8.0140000e-03,  8.1439996e-03],
                 ...,
                 [-6.3999998e-04, -2.6340000e-03,  6.1740000e-03, ...,
                  -4.3205000e-03, -1.2229999e-03, -1.8960000e-03],
                 [-1.5900000e-03, -3.4460002e-03,  4.1279998e-03, ...,
                  -2.9000000e-03, -5.9960000e-03, -5.8140000e-03],
                 [-9.1199996e-04, -4.0670000e-03, -1.5819999e-03, ...,
                  -2.4759998e-03, -8.5290000e-03, -5.3939996e-03]],
                dtype=float32)
注釈
また, pyvista.DataSetFilters.compute_derivative() を使用して,発散,渦度,Q基準など,他の導関数ベースの量を計算することもできます.オプションについては,関数のマニュアルを参照してください.
mesh_g["gradient"] は勾配の 9 NumPy 配列による N なので,勾配のNumPy配列の辞書を作ることができます:
def gradients_to_dict(arr):
    """Label the gradients into a dictionary."""
    keys = np.array(
        ['du/dx', 'du/dy', 'du/dz', 'dv/dx', 'dv/dy', 'dv/dz', 'dw/dx', 'dw/dy', 'dw/dz'],
    )
    keys = keys.reshape((3, 3))[:, : arr.shape[1]].ravel()
    return dict(zip(keys, mesh_g['gradient'].T))


gradients = gradients_to_dict(mesh_g['gradient'])
gradients
{np.str_('du/dx'): pyvista_ndarray([ 0.007219 ,  0.0042885,  0.0054015, ..., -0.00064  ,
                 -0.00159  , -0.000912 ], dtype=float32), np.str_('du/dy'): pyvista_ndarray([ 0.007657,  0.00093 ,  0.001254, ..., -0.002634,
                 -0.003446, -0.004067], dtype=float32), np.str_('du/dz'): pyvista_ndarray([ 0.00388 , -0.006552, -0.004651, ...,  0.006174,
                  0.004128, -0.001582], dtype=float32), np.str_('dv/dx'): pyvista_ndarray([-7.5999997e-04, -1.0585000e-03, -2.9600000e-03, ...,
                 -1.9554999e-03,  9.9999888e-06,  2.6600000e-03],
                dtype=float32), np.str_('dv/dy'): pyvista_ndarray([ 0.000226, -0.00503 , -0.003388, ..., -0.0059  ,
                 -0.008274, -0.000512], dtype=float32), np.str_('dv/dz'): pyvista_ndarray([-0.006821, -0.000382,  0.006909, ..., -0.001991,
                 -0.003061, -0.00189 ], dtype=float32), np.str_('dw/dx'): pyvista_ndarray([-0.007385 , -0.00614  ,  0.000349 , ..., -0.0043205,
                 -0.0029   , -0.002476 ], dtype=float32), np.str_('dw/dy'): pyvista_ndarray([ 0.001006,  0.003677,  0.008014, ..., -0.001223,
                 -0.005996, -0.008529], dtype=float32), np.str_('dw/dz'): pyvista_ndarray([-2.1000043e-05,  1.1730000e-02,  8.1439996e-03, ...,
                 -1.8960000e-03, -5.8140000e-03, -5.3939996e-03],
                dtype=float32)}
これらのコンポーネントを個別の配列としてメッシュに追加するには,次のようにします.
mesh_g.point_data.update(gradients)
mesh_g
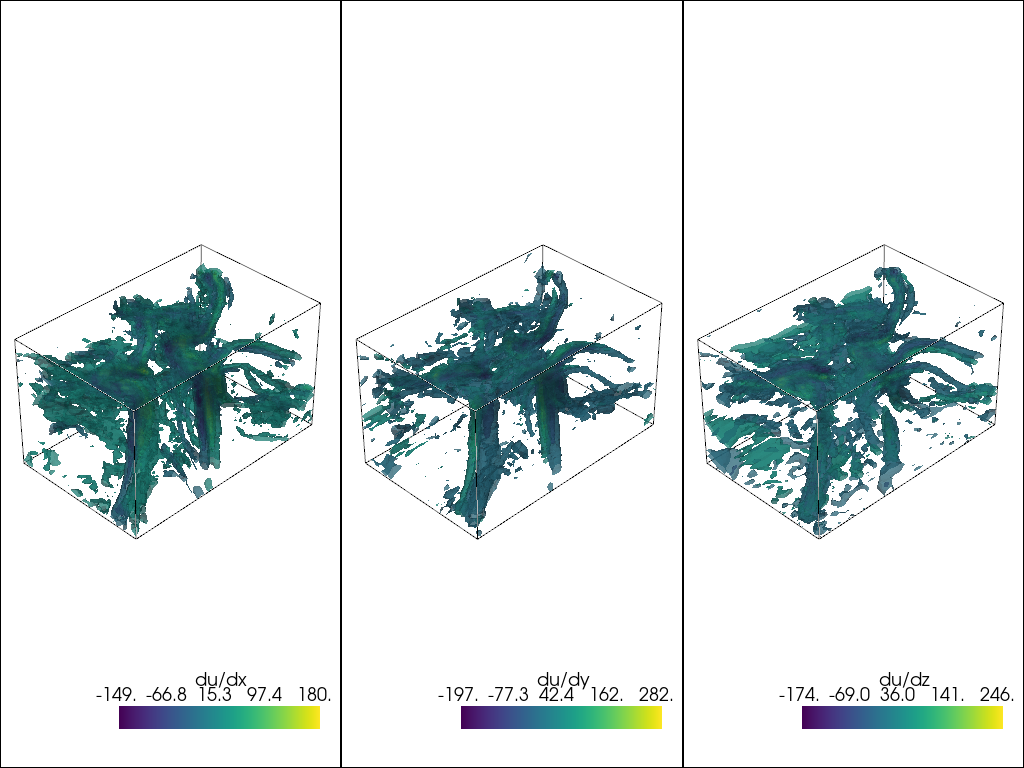
これがベクトル場の勾配です.また,与えられたデータセットの scalars フィールドのようなスカラーフィールドに対してもこれを行うことができます.
{np.str_('du/dx'): pyvista_ndarray([-7. , -7. , -4. , ..., -0.5, -1.5, -2. ], dtype=float32), np.str_('du/dy'): pyvista_ndarray([ 0., 5., 12., ..., -3., -1., -3.], dtype=float32), np.str_('du/dz'): pyvista_ndarray([-13., -8., -3., ..., 4., 4., 1.], dtype=float32)}
mesh_g.point_data.update(gradients)

keys = np.array(list(gradients.keys())).reshape(1, 3)

p = pv.Plotter(shape=keys.shape)

for (i, j), name in np.ndenumerate(keys):
    name = keys[i, j]
    p.subplot(i, j)
    p.add_mesh(mesh_g.contour(scalars=name), scalars=name, opacity=0.75)
    p.add_mesh(mesh_g.outline(), color='k')
p.link_views()
p.view_isometric()
p.show()
Total running time of the script: (0 minutes 3.469 seconds)