注釈
Go to the end をクリックすると完全なサンプルコードをダウンロードできます.
補間/サンプリング法の比較#
PyVistaでターゲットメッシュからデータを補間またはサンプリングするには,主に2つの方法があります. pyvista.DataSetFilters.interpolate() は距離重み付けカーネルを使って,ターゲットメッシュの近くの点から目的の点に点データを補間します. pyvista.DataSetFilters.sample() は,ターゲットメッシュのセルを囲むセルの補間スキームを使ってデータを補間します.
ターゲットメッシュが点群である場合,つまりセル構造に連結性がない場合は,一般的に pyvista.DataSetFilters.interpolate() が推奨されます.ターゲットメッシュのセル内で補間を行いたい場合は,一般的に pyvista.DataSetFilters.sample() を使用します.
ここでは、矩形領域のメッシュからデータをサンプリングする単純な例を用いて、2つの方法を比較対照します。 この例は,上記の主な相違点を示しています. より複雑な使い方については 詳細な補間点 や 詳細なリサンプリング を参照してください。
from __future__ import annotations

import numpy as np

import pyvista as pv
点群からの補間#
A point cloud is a collection of points that have no connectivity in
the mesh, i.e. the mesh contains no cells or the cells are 0D
(vertex or polyvertex). The filter pyvista.DataSetFilters.interpolate()
uses a distance-based weighting methodology to interpolate between the
unconnected points.
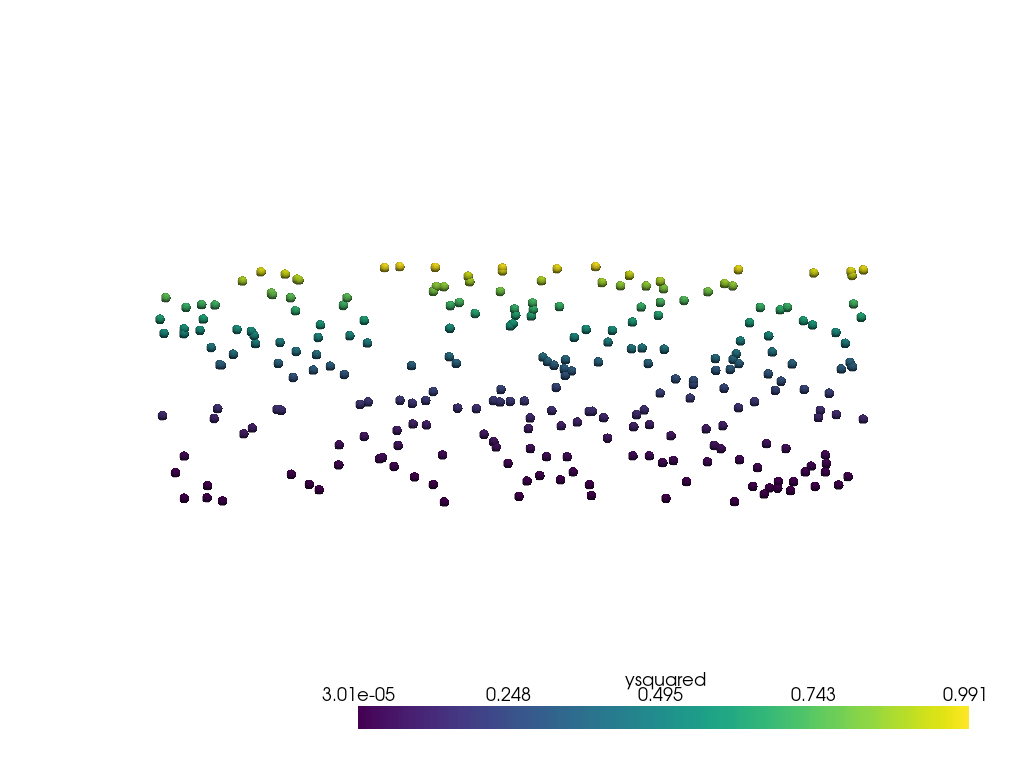
First, generate a point cloud mesh in a rectangular domain from
(0, 0) to (3, 1). The data to be sampled is the square of the y position.
rng = np.random.default_rng(seed=0)
points = rng.uniform(low=[0, 0], high=[3, 1], size=(250, 2))
# Make points be z=0
points = np.hstack((points, np.zeros((250, 1))))
point_mesh = pv.PolyData(points)
point_mesh['ysquared'] = points[:, 1] ** 2
点群データはこのようになります。
pl = pv.Plotter()
pl.add_mesh(point_mesh, render_points_as_spheres=True, point_size=10)
pl.view_xy()
pl.show()

Now estimate data on a regular grid from the point data. Note
that the distance parameter radius determines how far away to
look for point cloud data.
grid = pv.ImageData(dimensions=(11, 11, 1), spacing=[3 / 10, 1 / 10, 1])
output = grid.interpolate(point_mesh, radius=0.1, null_value=-1)
output
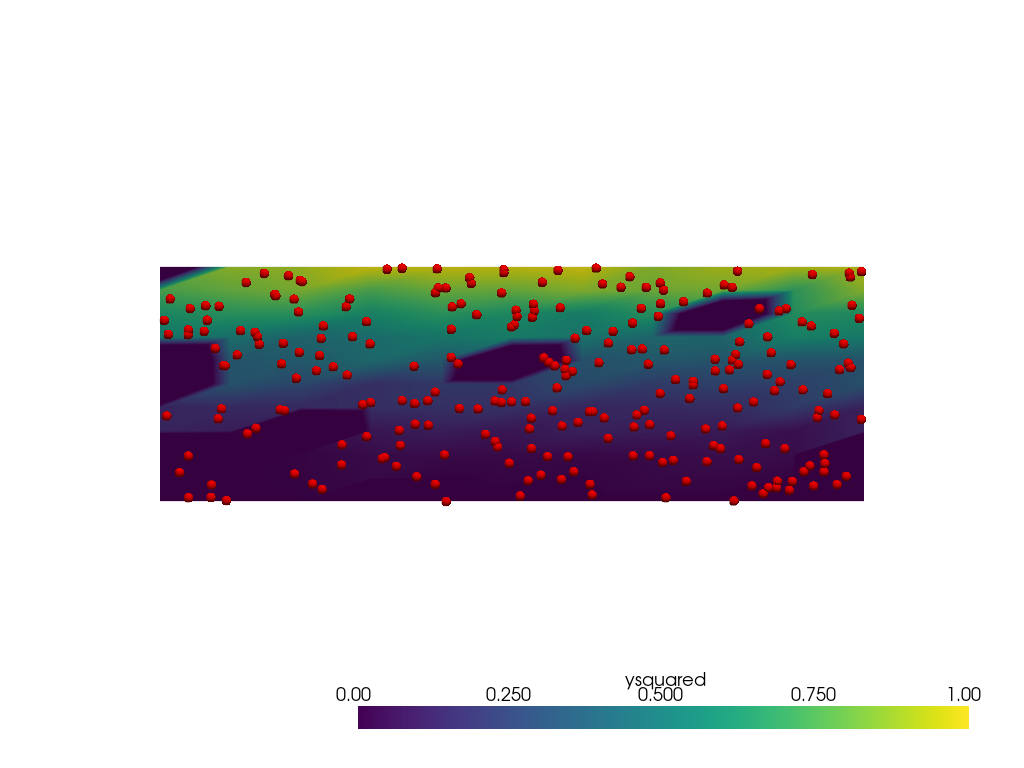
When using radius=0.1, the expected extents of the data are
captured reasonably well over the domain, but there are holes in the
data (represented by the darkest blue colors) caused by no points within
the radius to interpolate from.
pl = pv.Plotter()
pl.add_mesh(output, clim=[0, 1])
pl.add_mesh(points, render_points_as_spheres=True, point_size=10, color='red')
pl.view_xy()
pl.show()
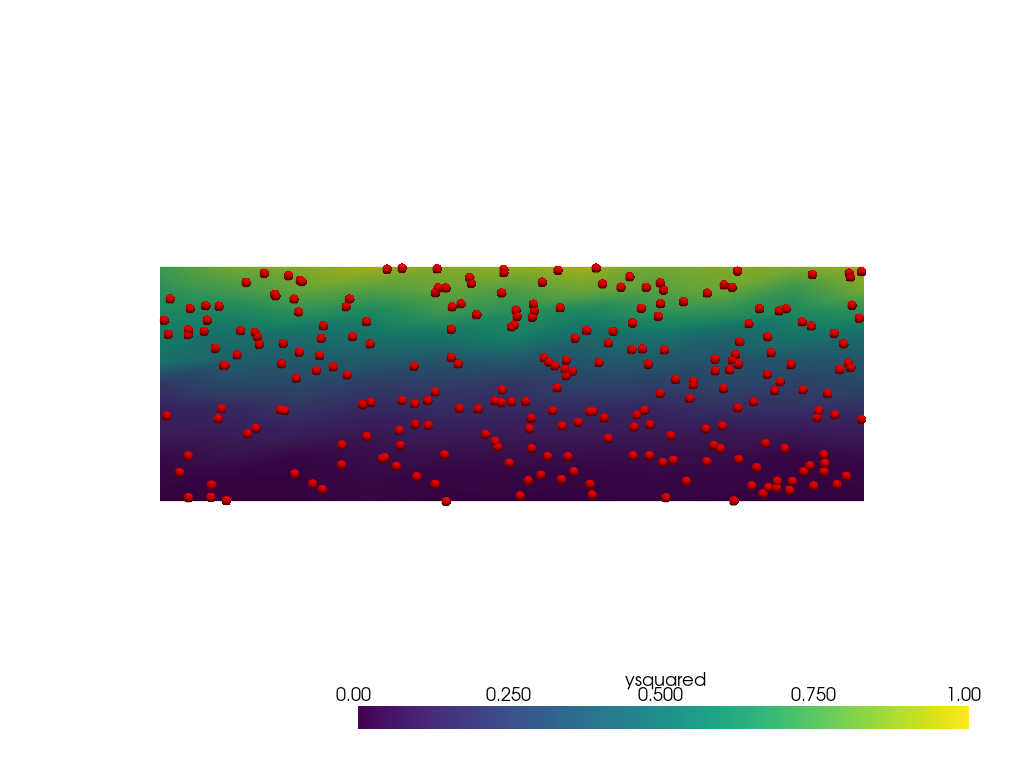
Now repeat with radius=0.25.
There are no holes but the extents of the data is much narrower
than [0, 1]. This is caused by more interior points involved
in the weighting near the lower and upper edges of the domain.
Other parameters such as sharpness could be tuned to try to
lessen the issue.
grid = pv.ImageData(dimensions=(11, 11, 1), spacing=[3 / 10, 1 / 10, 1])
output = grid.interpolate(point_mesh, radius=0.25, null_value=-1)

pl = pv.Plotter()
pl.add_mesh(output, clim=[0, 1])
pl.add_mesh(points, render_points_as_spheres=True, point_size=10, color='red')
pl.view_xy()
pl.show()
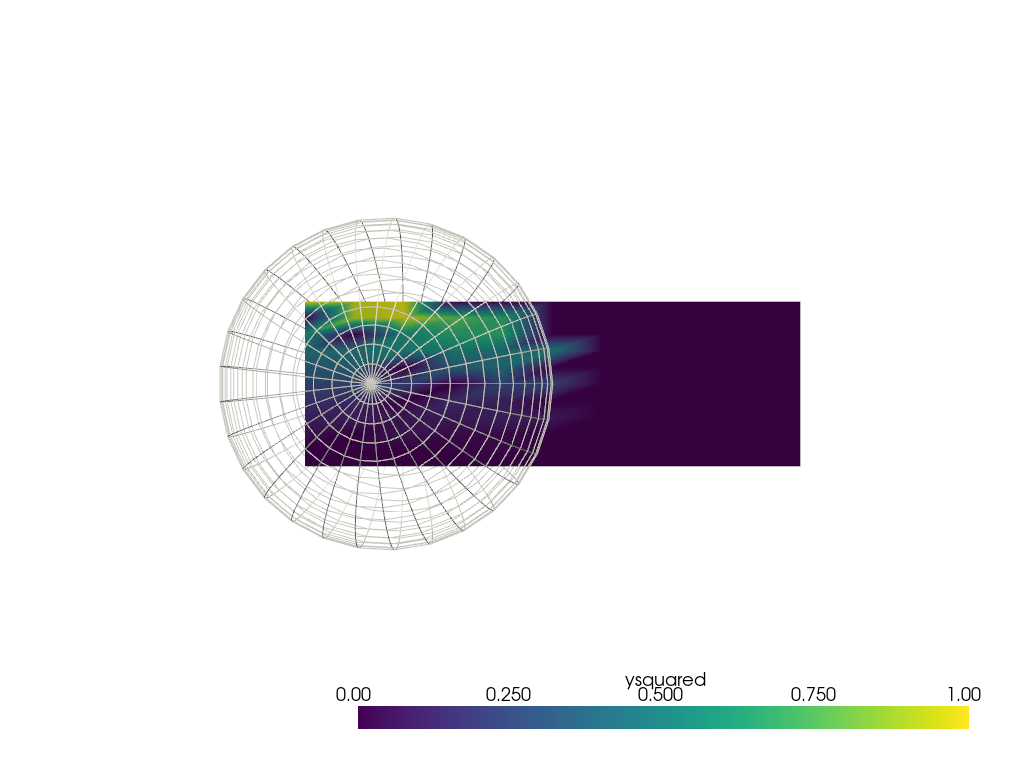
While this filter is very useful for point clouds, it is possible to use
it to interpolate from the points on other mesh types. With
unstuitable choice of radius the interpolation doesn't look very good.
It is recommended consider using pyvista.DataSetFilters.sample() in a
case like this (see next section below). However, there may be cases with
non-point cloud meshes where pyvista.DataSetFilters.interpolate() is
still preferred.
sphere = pv.SolidSphere(center=(0.5, 0.5, 0), outer_radius=1.0)
sphere['ysquared'] = sphere.points[:, 1] ** 2
output = grid.interpolate(sphere, radius=0.1)

pl = pv.Plotter()
pl.add_mesh(output, clim=[0, 1])
pl.add_mesh(sphere, style='wireframe', color='white')
pl.view_xy()
pl.show()
接続性を持つメッシュからのサンプリング#
This example is in many ways the opposite of the prior one.
A mesh with cell connectivity that spans 2 dimensions is
sampled at discrete points using pyvista.DataSetFilters.sample().
Importantly, the cell connectivity enables direct interpolation
inside the domain without needing distance or weighting parametization.
First, show that sample does not work with point clouds with data.
Either pyvista.DataSetFilters.interpolate() or the
snap_to_closest_point parameter must be used.
grid = pv.ImageData(dimensions=(11, 11, 1), spacing=[3 / 10, 1 / 10, 1])
output = grid.sample(point_mesh)
# value of (0, 0) shows that no data was sampled
print(f'(min, max): {output["ysquared"].min()}, {output["ysquared"].min()}')
(min, max): 0.0, 0.0
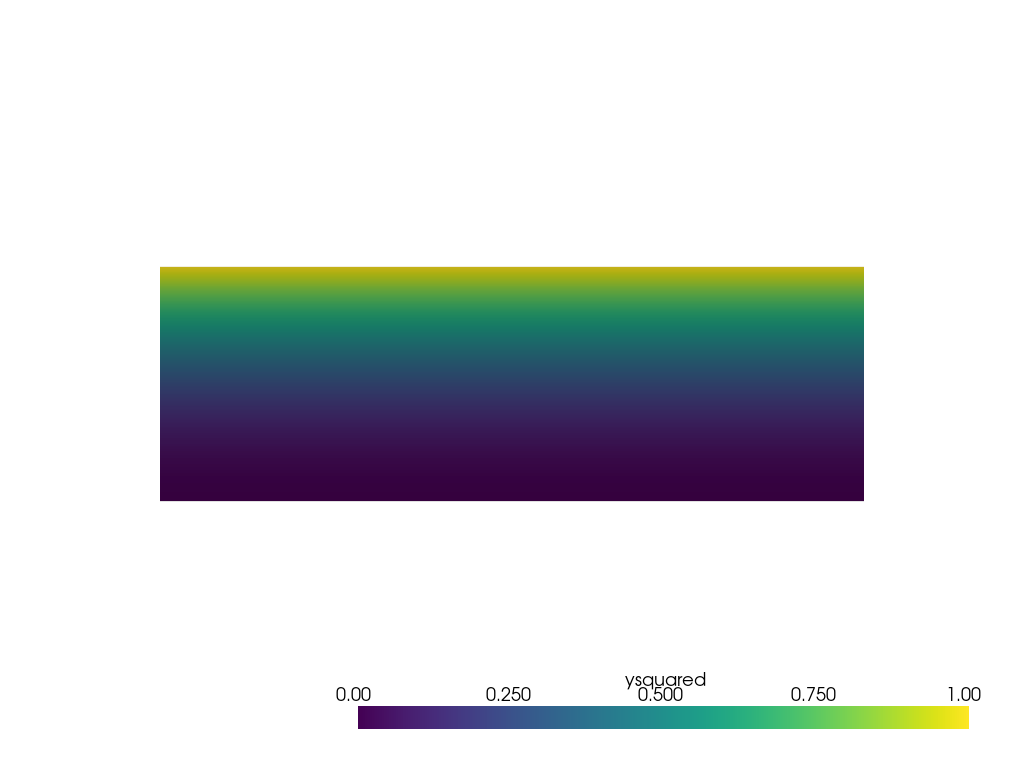
サンプリング元となる非点群メッシュを作成し、プロットします。
grid = pv.ImageData(dimensions=(11, 11, 1), spacing=[3 / 10, 1 / 10, 1])
grid['ysquared'] = grid.points[:, 1] ** 2

pl = pv.Plotter()
pl.add_mesh(grid, clim=[0, 1])
pl.view_xy()
pl.show()
Now sample it at the discrete points used in the first example.
point_mesh = pv.PolyData(points)
output = point_mesh.sample(grid)
output
データにノイズがなく、補間誤差もほとんどないため、これは最初の例の最初のプロットと同じように見えます。
pl = pv.Plotter()
pl.add_mesh(output, render_points_as_spheres=True, point_size=10)
pl.view_xy()
pl.show()
Instead of sampling onto a point cloud, pyvista.DataSetFilters.sample()
can sample using other mesh types. For example, sampling onto a rotated subset
of the grid.
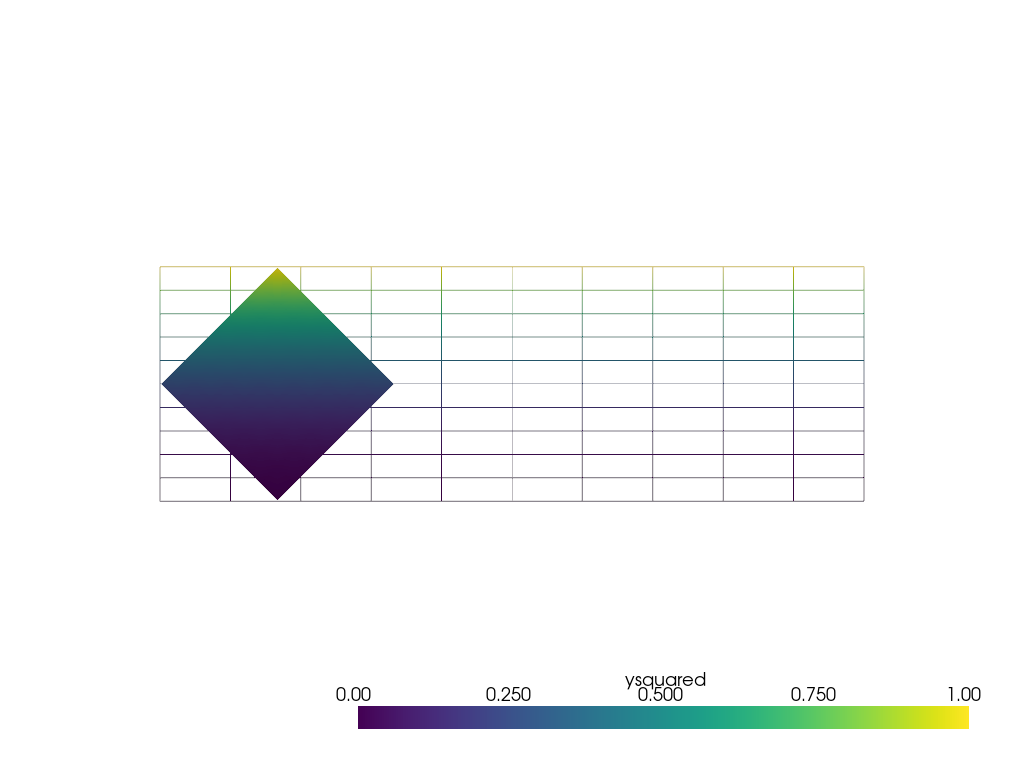
サブセット (0.7, 0.7, 0) を単位寸法にし、その中心を中心に45度回転させます。
subset = pv.ImageData(dimensions=(8, 8, 1), spacing=[0.1, 0.1, 0], origin=(0.15, 0.15, 0))
rotated_subset = subset.rotate_vector(vector=(0, 0, 1), angle=45, point=(0.5, 0.5, 0))
output = rotated_subset.sample(grid)
output
/home/runner/work/pyvista-docs-dev-ja/pyvista-docs-dev-ja/pyvista-doc-translations/pyvista/pyvista/core/utilities/transformations.py:482: RuntimeWarning: invalid value encountered in divide
  K = (SK * (I3 == 0.0)) / S[:, np.newaxis] + I3
/home/runner/work/pyvista-docs-dev-ja/pyvista-docs-dev-ja/pyvista-doc-translations/pyvista/pyvista/core/grid.py:1049: UserWarning: The transformation matrix has a shear component which has been removed.
Shear is not supported when setting `ImageData` `index_to_physical_matrix`.
  warnings.warn(
サンプリングされた領域のデータは、データの振る舞いが良く、補間誤差が少ないため、元のグリッドと同じように見えます。
pl = pv.Plotter()
pl.add_mesh(grid, style='wireframe', clim=[0, 1])
pl.add_mesh(output, clim=[0, 1])
pl.view_xy()
pl.show()
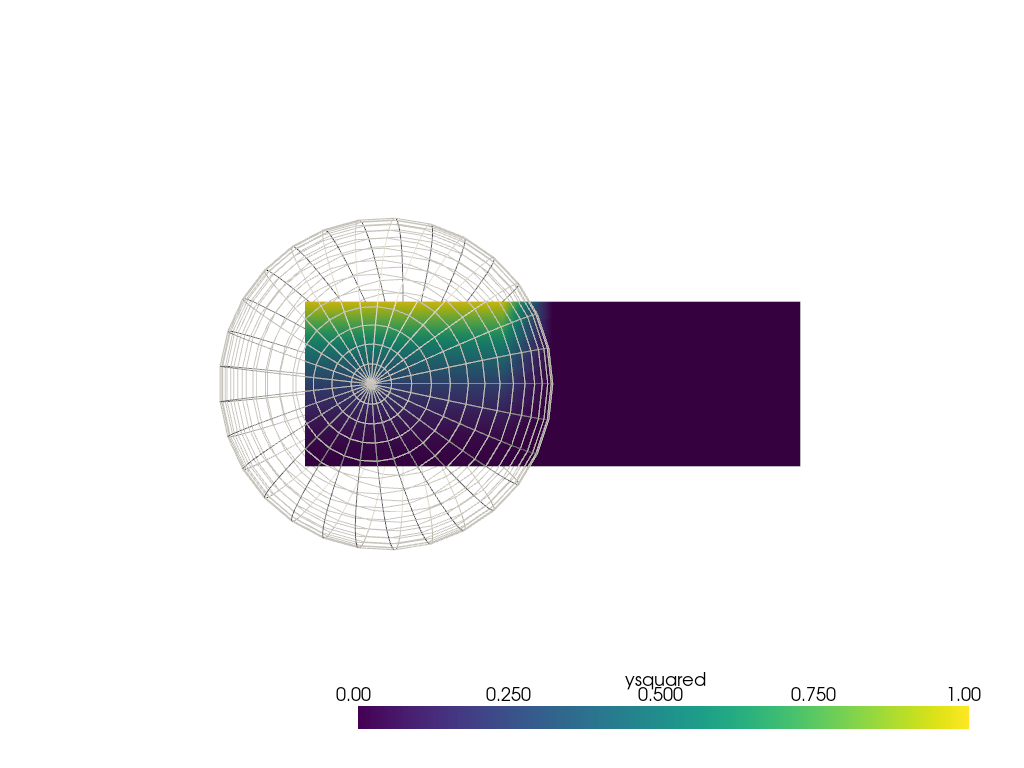
Repeat the sphere interpolation example, but using
pyvista.DataSetFilters.sample(). This method
is directly able to sample from the mesh in this case without
fiddling with distance weighting parameters.
sphere = pv.SolidSphere(center=(0.5, 0.5, 0), outer_radius=1.0)
sphere['ysquared'] = sphere.points[:, 1] ** 2
output = grid.sample(sphere)

pl = pv.Plotter()
pl.add_mesh(output, clim=[0, 1])
pl.add_mesh(sphere, style='wireframe', color='white')
pl.view_xy()
pl.show()
Total running time of the script: (0 minutes 1.979 seconds)