注釈
Go to the end to download the full example code.
ポイントを平面に投影して平面充填します.#
pyvistaとnumpyを使って,3Dの点群を生成し,それを平面に投影し,平面充填します.
これは pyvista.UnstructuredGridFilters.delaunay_2d と,点を平面に投影する簡単なnumpy関数の使い方を示しています.
from __future__ import annotations

import numpy as np

import pyvista as pv
プロジェクトポイント .#
点群を作成し,平面に投影します.
num_points = 100
rng = np.random.default_rng(seed=0)  # Seed rng for reproducibility
point_cloud = rng.random((num_points, 3))

# Define a plane
origin = [0, 0, 0]
normal = [0, 0, 1]
plane = pv.Plane(center=origin, direction=normal)


def project_points_to_plane(points, plane_origin, plane_normal):
    """Project points to a plane."""
    vec = points - plane_origin
    dist = np.dot(vec, plane_normal)
    return points - np.outer(dist, plane_normal)


projected_points = project_points_to_plane(point_cloud, origin, normal)

# Create a polydata object with projected points
polydata = pv.PolyData(projected_points)

# Mesh using delaunay_2d and pyvista
mesh = polydata.delaunay_2d()
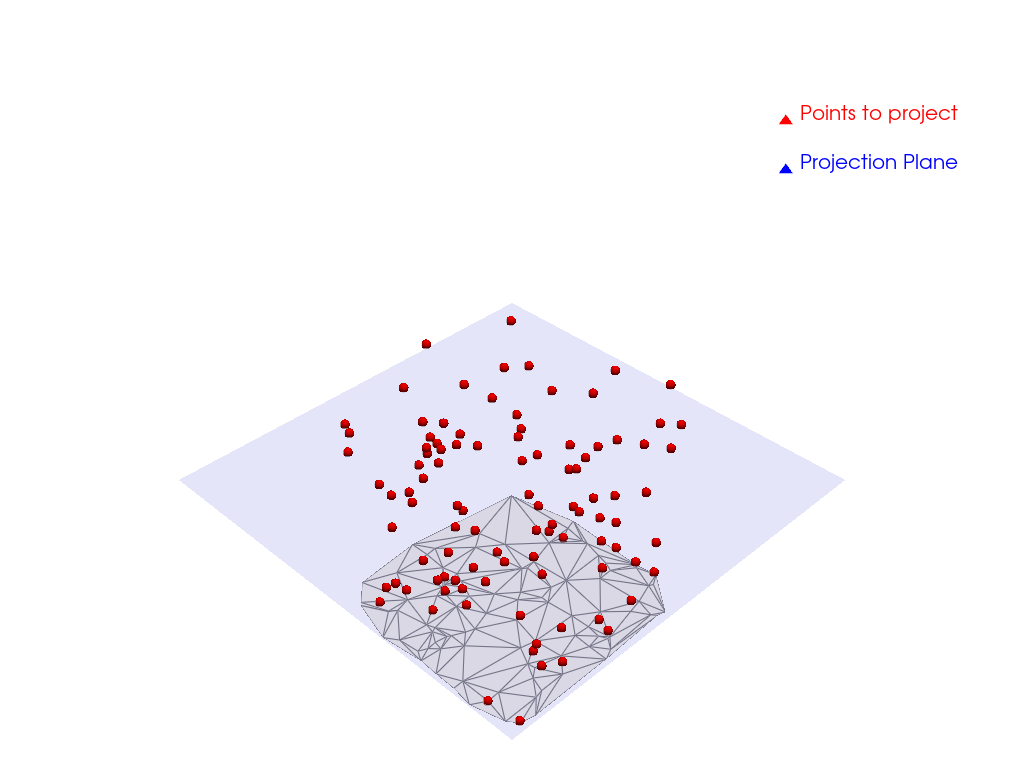
結果を可視化する#
# Create a plane for visualization
plane_vis = pv.Plane(
    center=origin,
    direction=normal,
    i_size=2,
    j_size=2,
    i_resolution=10,
    j_resolution=10,
)

# plot it
pl = pv.Plotter()
pl.add_mesh(mesh, show_edges=True, color='white', opacity=0.5, label='Tessellated mesh')
pl.add_mesh(
    pv.PolyData(point_cloud),
    color='red',
    render_points_as_spheres=True,
    point_size=10,
    label='Points to project',
)
pl.add_mesh(plane_vis, color='blue', opacity=0.1, label='Projection Plane')
pl.add_legend()
pl.show()
Total running time of the script: (0 minutes 0.349 seconds)