注釈
Go to the end to download the full example code.
2つのサーフェス間の距離#
2つのサーフェス間の平均厚みを計算します.
たとえば,地下地質モデルの岩石層の境界を表す2つのサーフェスがあり,それらの境界間の単位の平均厚さを知りたいとします.
この例では,用語を明確にすることが重要です. メッシュポイントは,メッシュ上の各セルの頂点に存在します. メッシュとは? を参照してください.この例の各セルは,無限の空間ポイントを含む2Dの空間領域を包含しています.これらの空間ポイントはメッシュポイントではありません.2つのサーフェス間の距離は,文脈や使用方法によって異なる意味を持ちます. ここでの各例では,下のメッシュの頂点から上のメッシュまでの距離の異なる側面を探っています.
まず,下面の頂点の法線を計算し,上面に光線を投影して,表面の法線に沿った距離を計算する方法をデモします.このレイは通常,メッシュのセル内の空間点で上面と交差します.
次に,KDTreeを使って,下のメッシュの各頂点から上のメッシュの最も近い頂点までの距離を計算します.
最後に,PyVistaのフィルタである pyvista.DataSet.find_closest_cell() を使って,下のメッシュのすべての頂点から,上のメッシュのセル内にある最も近い空間点までの距離を計算します. これは,最初の2つの例とは異なり,頂点点から上面までの最短距離となります.
from __future__ import annotations

import numpy as np

import pyvista as pv


def hill(seed):
    """Make a random surface."""
    mesh = pv.ParametricRandomHills(random_seed=seed, u_res=50, v_res=50, hill_amplitude=0.5)
    mesh.rotate_y(-10, inplace=True)  # give the surfaces some tilt

    return mesh


h0 = hill(1).elevation()
h1 = hill(10)
# Shift one surface
h1.points[:, -1] += 5
h1 = h1.elevation()
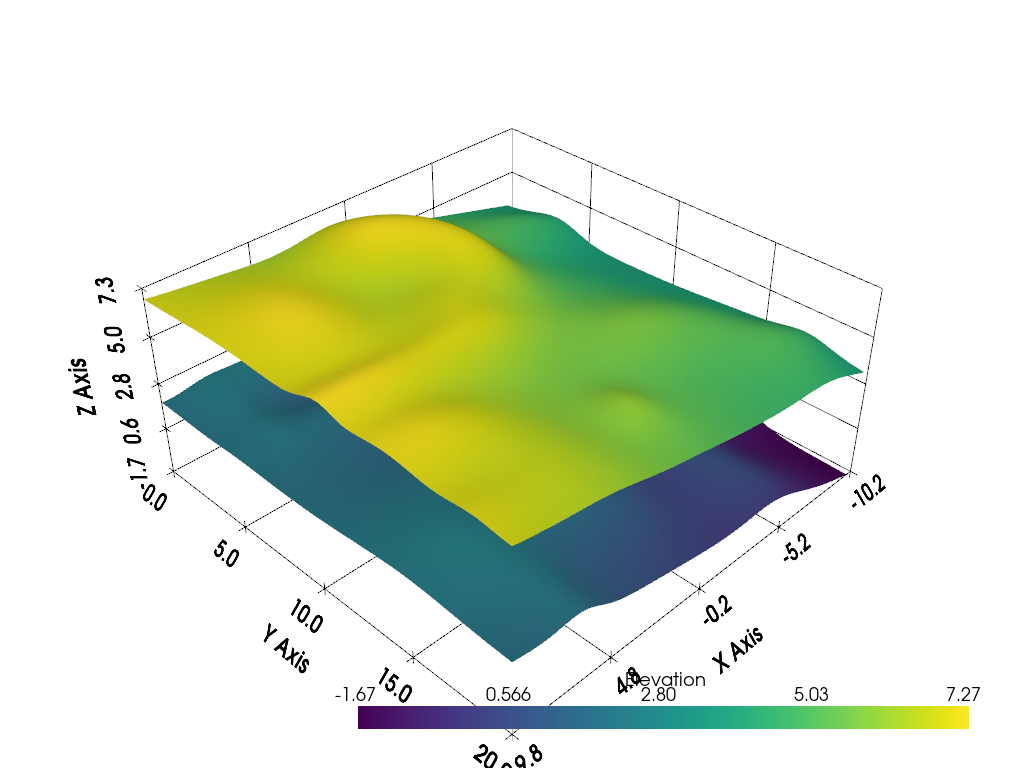
p = pv.Plotter()
p.add_mesh(h0, smooth_shading=True)
p.add_mesh(h1, smooth_shading=True)
p.show_grid()
p.show()
レイトレーシング距離#
頂点ポイントでの下部サーフェスの法線を計算
h0n = h0.compute_normals(point_normals=True, cell_normals=False, auto_orient_normals=True)
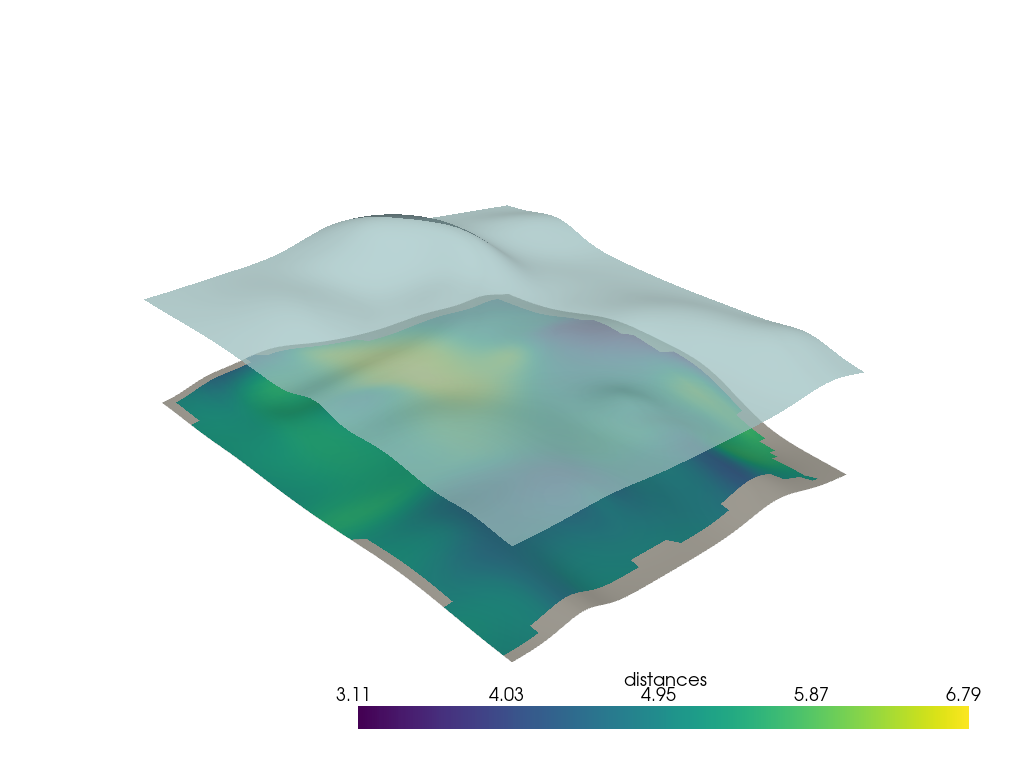
法線に沿って他のサーフェスに移動し,各ベクトルの厚みを計算します.
h0n['distances'] = np.empty(h0.n_points)
for i in range(h0n.n_points):
    p = h0n.points[i]
    vec = h0n['Normals'][i] * h0n.length
    p0 = p - vec
    p1 = p + vec
    ip, ic = h1.ray_trace(p0, p1, first_point=True)
    dist = np.sqrt(np.sum((ip - p) ** 2))
    h0n['distances'][i] = dist

# Replace zeros with nans
mask = h0n['distances'] == 0
h0n['distances'][mask] = np.nan
np.nanmean(h0n['distances'])
np.float64(5.144072855220122)
p = pv.Plotter()
p.add_mesh(h0n, scalars='distances', smooth_shading=True)
p.add_mesh(h1, color=True, opacity=0.75, smooth_shading=True)
p.show()
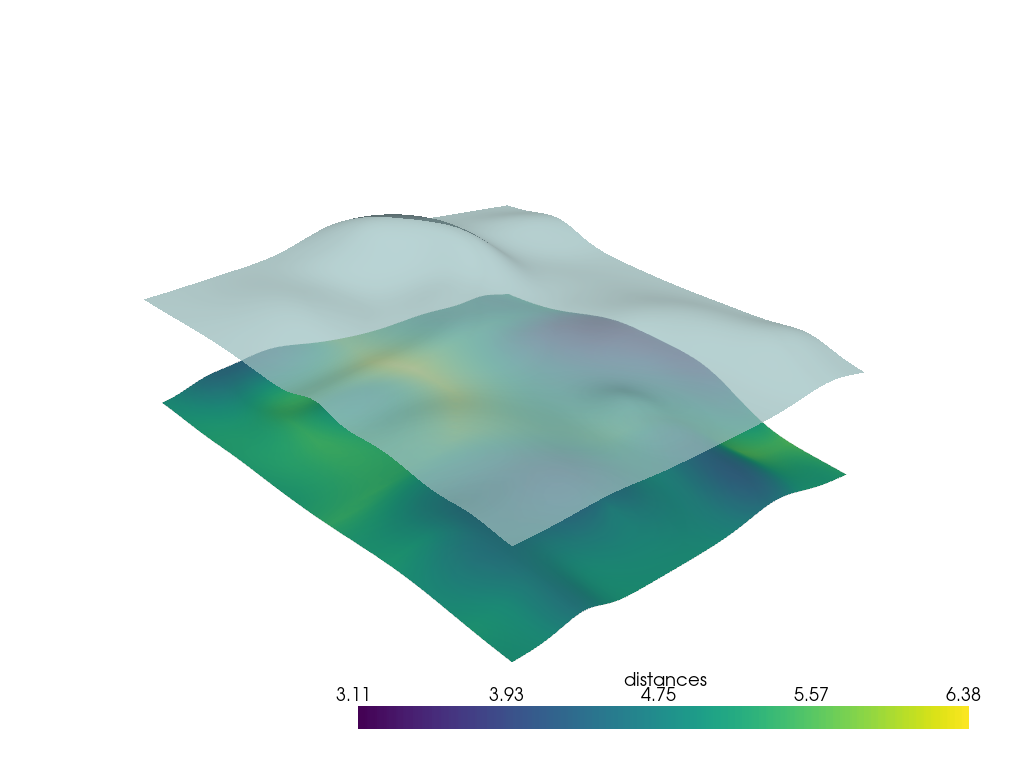
最近接距離#
KDTreeを使用して,上部サーフェスの各頂点ポイントと下部サーフェスの最も近い隣接頂点ポイント間の距離を比較することもできます.これは特に大きなサーフェスでは,レイトレースよりも著しく高速になります.
np.float64(4.843639418894909)
p = pv.Plotter()
p.add_mesh(h0, scalars='distances', smooth_shading=True)
p.add_mesh(h1, color=True, opacity=0.75, smooth_shading=True)
p.show()

PyVistaフィルタの使い方#
pyvista.DataSet.find_closest_cell() フィルタは,上面のセルの中で,下面の頂点ポイントに最も近い空間ポイントを返します. return_closest_point=True を使用すると, closest_points が返されます.
closest_cells, closest_points = h1.find_closest_cell(h0.points, return_closest_point=True)
d_exact = np.linalg.norm(h0.points - closest_points, axis=1)
h0['distances'] = d_exact
np.mean(d_exact)
np.float64(4.841284523106411)
予想通り,この方法とKDTree法の間にはわずかな違いしかありません.
p = pv.Plotter()
p.add_mesh(h0, scalars='distances', smooth_shading=True)
p.add_mesh(h1, color=True, opacity=0.75, smooth_shading=True)
p.show()
Total running time of the script: (0 minutes 2.346 seconds)