注釈
Go to the end to download the full example code.
Kochanekスプラインの作成#
XYZ頂点のnumpy配列から Kochanek スプライン/ポリラインを作成します。 pyvista.KochanekSpline() を使用します。
import numpy as np

import pyvista as pv
プロットするデータセットを作成する
def make_points():
    """Make XYZ points."""
    theta = np.linspace(-4 * np.pi, 4 * np.pi, 6)
    z = np.linspace(-2, 2, 6)
    r = z**2 + 1
    x = r * np.sin(theta)
    y = r * np.cos(theta)
    return np.column_stack((x, y, z))


points = make_points()
points[0:5, :]
array([[ 2.44929360e-15,  5.00000000e+00, -2.00000000e+00],
       [-2.32057790e+00,  7.54001466e-01, -1.20000000e+00],
       [-6.81830893e-01, -9.38459713e-01, -4.00000000e-01],
       [ 6.81830893e-01, -9.38459713e-01,  4.00000000e-01],
       [ 2.32057790e+00,  7.54001466e-01,  1.20000000e+00]])
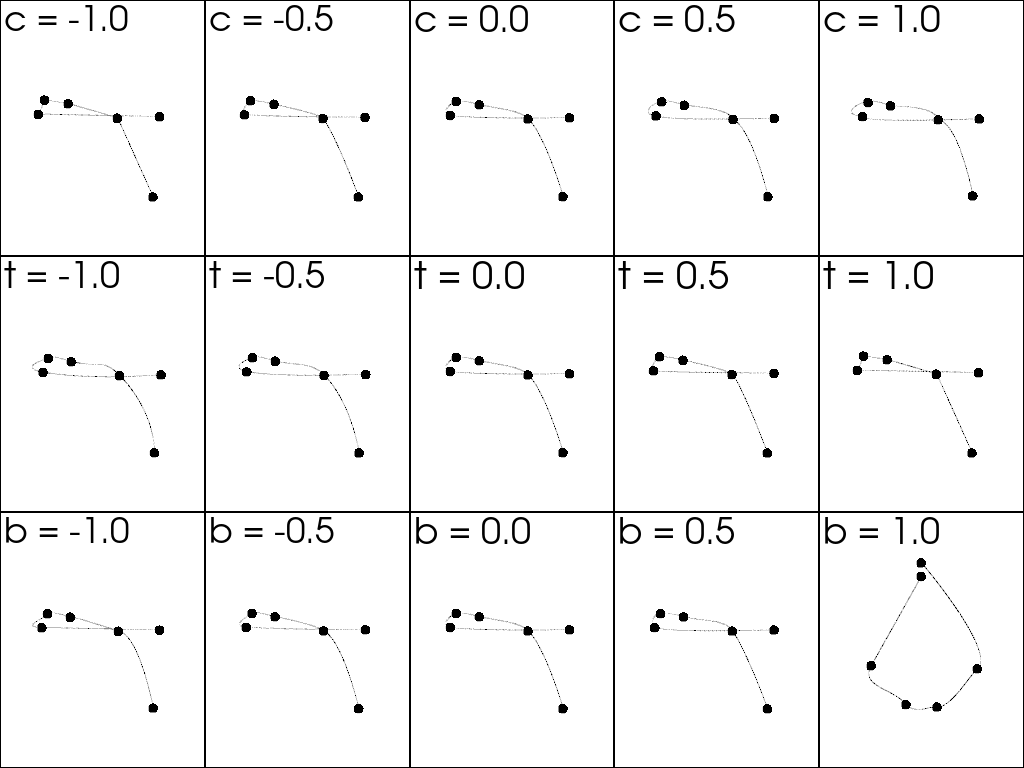
これらの点をパラメトリックなKochanekスプラインに補間します
# Create Kochanek spline with 6 interpolation points
p = pv.Plotter(shape=(3, 5))

c = [-1.0, -0.5, 0.0, 0.5, 1.0]
for i in range(5):
    kochanek_spline = pv.KochanekSpline(points, continuity=[c[i], c[i], c[i]], n_points=1000)
    p.subplot(0, i)
    p.add_text('c = ' + str(c[i]))
    p.add_mesh(kochanek_spline, color='k', point_size=10)
    p.add_mesh(
        pv.PolyData(points),
        color='k',
        point_size=10,
        render_points_as_spheres=True,
    )

t = [-1.0, -0.5, 0.0, 0.5, 1.0]
for i in range(5):
    kochanek_spline = pv.KochanekSpline(points, tension=[t[i], t[i], t[i]], n_points=1000)
    p.subplot(1, i)
    p.add_text('t = ' + str(t[i]))
    p.add_mesh(kochanek_spline, color='k')
    p.add_mesh(
        pv.PolyData(points),
        color='k',
        point_size=10,
        render_points_as_spheres=True,
    )

b = [-1.0, -0.5, 0.0, 0.5, 1.0]
for i in range(5):
    kochanek_spline = pv.KochanekSpline(points, bias=[b[i], b[i], b[i]], n_points=1000)
    p.subplot(2, i)
    p.add_text('b = ' + str(b[i]))
    p.add_mesh(kochanek_spline, color='k')
    p.add_mesh(
        pv.PolyData(points),
        color='k',
        point_size=10,
        render_points_as_spheres=True,
    )

p.show(cpos='xy')
Total running time of the script: (0 minutes 0.784 seconds)