注釈
Go to the end をクリックすると完全なサンプルコードをダウンロードできます.
境界のプロット#
この例では, show_grid() を使用して pyvista.Plotter 内の境界線を表示するデモを紹介します.
from __future__ import annotations

import pyvista as pv
from pyvista import examples
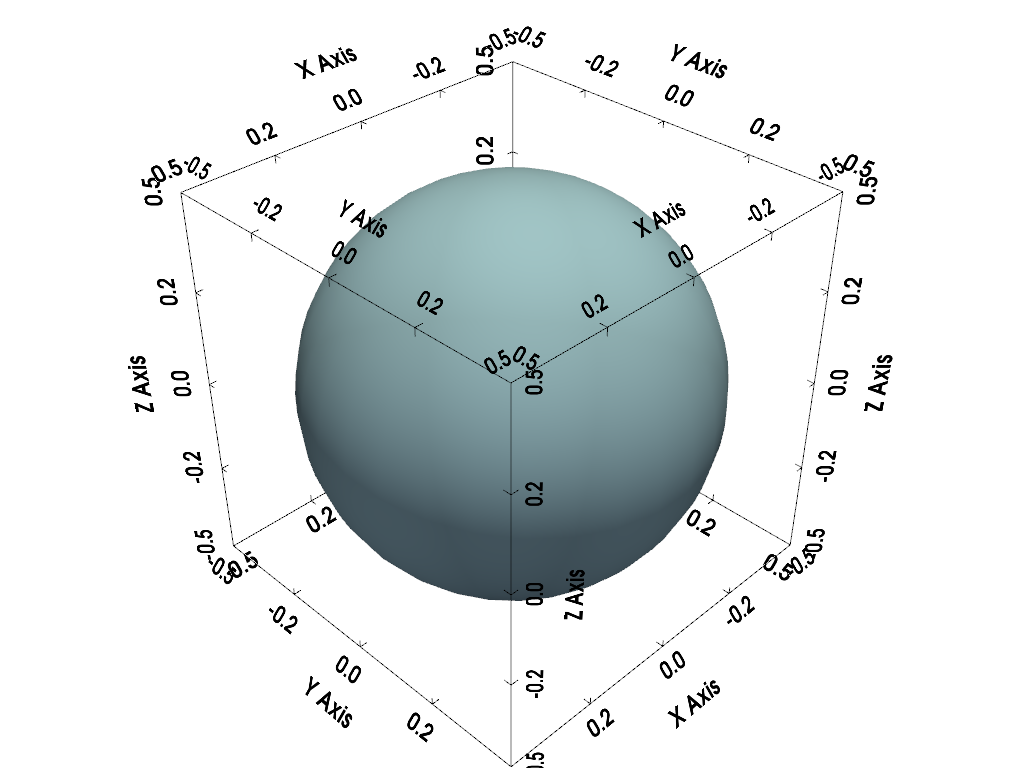
すべての境界を表示する#
このプロットでは, location='all' を設定することにより,すべての軸の境界を表示しています.
plotter = pv.Plotter()
plotter.add_mesh(pv.Sphere(), smooth_shading=True)
plotter.show_bounds(location='all')
plotter.show()
表示値のオーバーライド リミット#
この例では,X軸とY軸に表示される値を独自のカスタム値で上書きしています.これは,データセットを拡大縮小することなく,軸に沿って異なる値を表示したい場合に便利です.また, show_zlabels=False を設定して Z ラベルを非表示にしていることにも注目してください.
gears = examples.download_gears()

plotter = pv.Plotter()
plotter.add_mesh(gears, smooth_shading=True, split_sharp_edges=True)
plotter.show_bounds(axes_ranges=[0, 5, 0, 5, 0, 2], show_zlabels=False)
plotter.show()

print(f'Actual dataset bounds: {gears.bounds}')
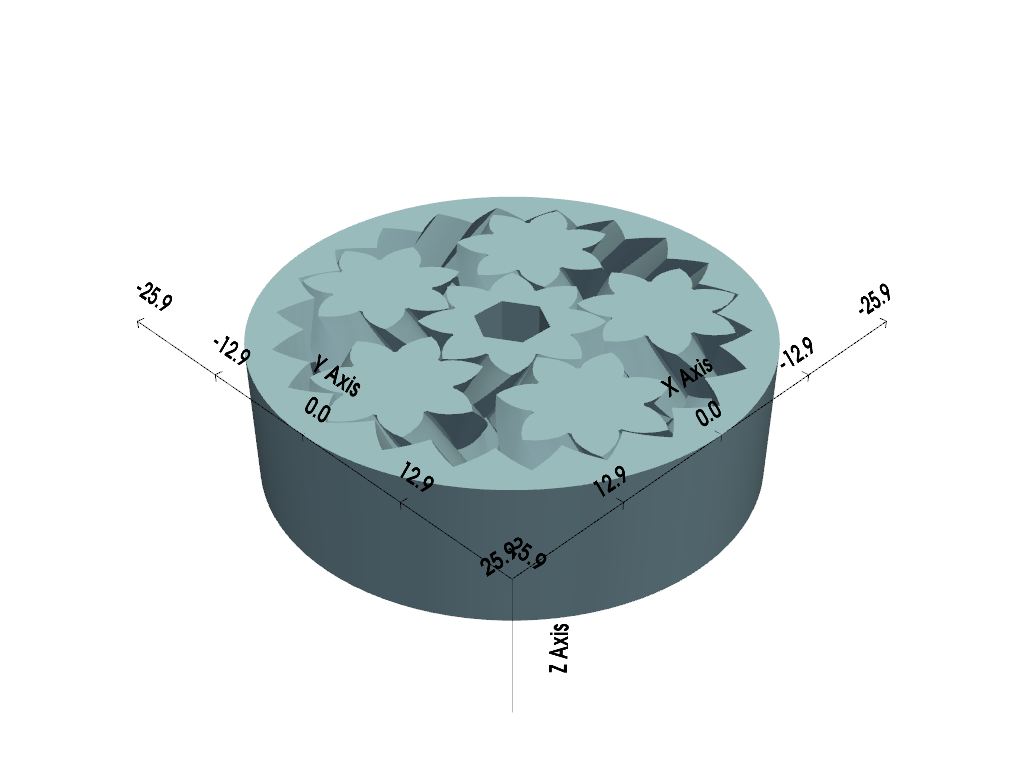
Actual dataset bounds: BoundsTuple(x_min=-25.850000381469727, x_max=25.850000381469727, y_min=-25.850000381469727, y_max=25.850000381469727, z_min=0.0, z_max=15.0)
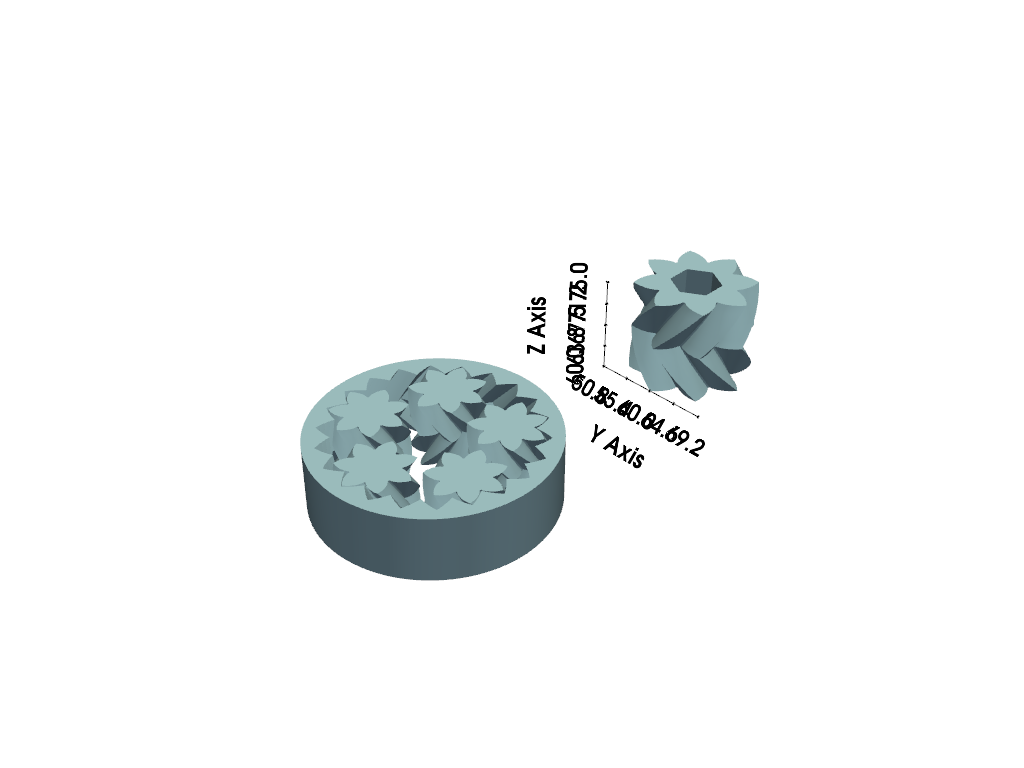
1つのデータセットのみの境界を表示する#
この例では,1つのデータセットの境界のみを表示しています.この例でも axes_ranges を使用しています.この例では,単一の中心歯車の大きさを表示したいからです.
# separate and shift the central gear
split_gears = gears.split_bodies()
central_gear = split_gears.pop(1)
central_gear.translate([0, 60, 60], inplace=True)

# also, grab the size of the central gear
bnds = central_gear.bounds
x_size = bnds.x_max - bnds.x_min
y_size = bnds.y_max - bnds.y_min
z_size = bnds.z_max - bnds.z_min

plotter = pv.Plotter()
plotter.add_mesh(split_gears, smooth_shading=True, split_sharp_edges=True)
plotter.add_mesh(central_gear, smooth_shading=True, split_sharp_edges=True)
plotter.show_grid(
    mesh=central_gear,
    axes_ranges=[0, x_size, 0, y_size, 0, z_size],
    show_xaxis=False,
    bold=True,
    grid=False,
)
plotter.show()
Total running time of the script: (0 minutes 1.361 seconds)