pyvista.examples.downloads.download_whole_body_ct_male#
- download_whole_body_ct_male(load=True, *, high_resolution=False)[ソース]#
117の解剖学的構造がセグメント化された男性被験者のCT画像をダウンロードします。
このデータセットは、zenodo から入手可能な TotalSegmentator dataset, version 2.0.1 の
's1397'を対象としています。詳細は原著論文を参照のこと:Jakob Wasserthal et al., “TotalSegmentator: Robust Segmentation of 104 Anatomic Structures in CT Images,” Radiology, Jul. 2023, doi: https://doi.org/10.1148/ryai.230024.
データセットは3つのブロックを持つ
MultiBlockとしてロードされる。'ct': CTデータのあるImageData'segmentations':MultiBlockに 117 個のImageDataブロックが格納されており、各ブロックにはバイナリのセグメンテーションラベルが格納されています。ブロックは解剖学的構造(例えば'heart')によって命名され、アルファベット順にソートされます。 以下の例を参照してください。'label_map':ImageDataにラベルマップ配列を追加します。ラベルマップはセグメンテーションの代替表現であり、マスクは単一のスカラー配列に結合されます。注釈
ラベルマップは元のデータソースの一部ではありせん。
クリエイティブ・コモンズ 表示 4.0 インターナショナルの下でライセンスされています。
Added in version 0.45: Three dictionaries are now included with the dataset's
user_dictto map label names to ids and colors:'names_to_colors': maps segment names to 8-bit RGB colors.'names_to_ids': maps segment names to integer ids used by the label map.'ids_to_colors': maps label ids to colors.
The label ids are the ids used by the included label map.
バージョン 0.45 で変更: A downsampled version of this dataset with dimensions
(160, 160, 273)is now returned. Previously, a high-resolution version with dimensions(320, 320, 547)was returned. Usehigh_resolution=Truefor the high-resolution version.- パラメータ:
- 戻り値:
pyvista.MultiBlockかstrloadに応じて,データセットまたはファイル名を指定します.
例
データセットをロードし、そのプロパティのいくつかを取得します。
>>> from pyvista import examples
>>> import pyvista as pv
>>> dataset = examples.download_whole_body_ct_male()
Get the CT image.
>>> ct_image = dataset['ct']
>>> ct_image
ImageData (...)
  N Cells:      6876432
  N Points:     6988800
  X Bounds:     7.500e-01, 4.778e+02
  Y Bounds:     7.500e-01, 4.778e+02
  Z Bounds:     7.527e-01, 8.182e+02
  Dimensions:   160, 160, 273
  Spacing:      3.000e+00, 3.000e+00, 3.005e+00
  N Arrays:     1
Get the segmentation label names and show the first three.
>>> segmentations = dataset['segmentations']
>>> label_names = segmentations.keys()
>>> label_names[:3]
['adrenal_gland_left', 'adrenal_gland_right', 'aorta']
Get the label map and show its data range.
>>> label_map = dataset['label_map']
>>> label_map.get_data_range()
(np.uint8(0), np.uint8(117))
Show the
'names_to_colors'dictionary with RGB colors for each segment.>>> dataset.user_dict['names_to_colors']
Show the
'names_to_ids'dictionary with a mapping from segment names to segment ids.>>> dataset.user_dict['names_to_ids']
Create a surface mesh of the segmentation labels.
>>> labels_mesh = label_map.contour_labels()
Color the surface using
color_labels(). Use the'ids_to_colors'dictionary that's included with the dataset to map the colors.>>> colored_mesh = labels_mesh.color_labels( ... colors=dataset.user_dict['ids_to_colors'] ... )
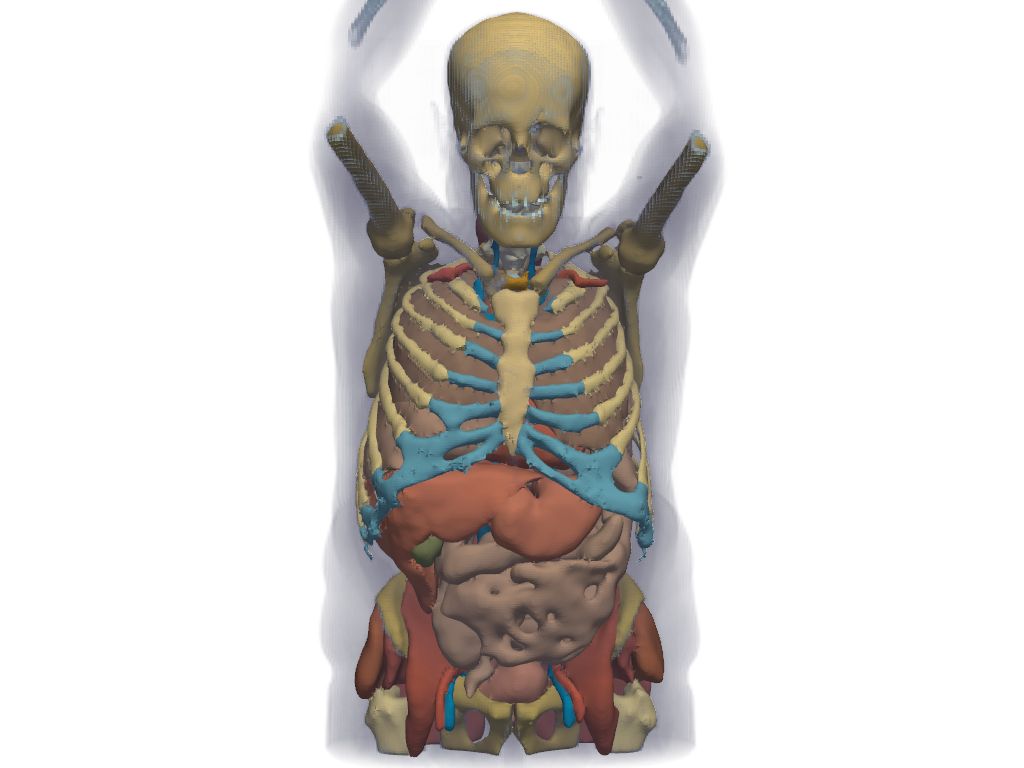
CT画像とセグメンテーションラベルを一緒にプロットします。
>>> pl = pv.Plotter()
>>> _ = pl.add_volume(
...     ct_image,
...     cmap='bone',
...     opacity='sigmoid_8',
...     show_scalar_bar=False,
... )
>>> _ = pl.add_mesh(colored_mesh)
>>> pl.view_zx()
>>> pl.camera.up = (0, 0, 1)
>>> pl.camera.zoom(1.3)
>>> pl.show()
参考
- Visualize Anatomical Groups
Additional examples using this dataset.
- Whole Body Ct Male Dataset
詳細はデータセットギャラリーのこのデータセットをご覧ください。
- Whole Body Ct Female Dataset
女性被験者の同様のデータセット。
- 医学のデータセット
他の医療データセットをブラウズします。
- Volume With Segmentation Mask
See additional examples using this dataset.