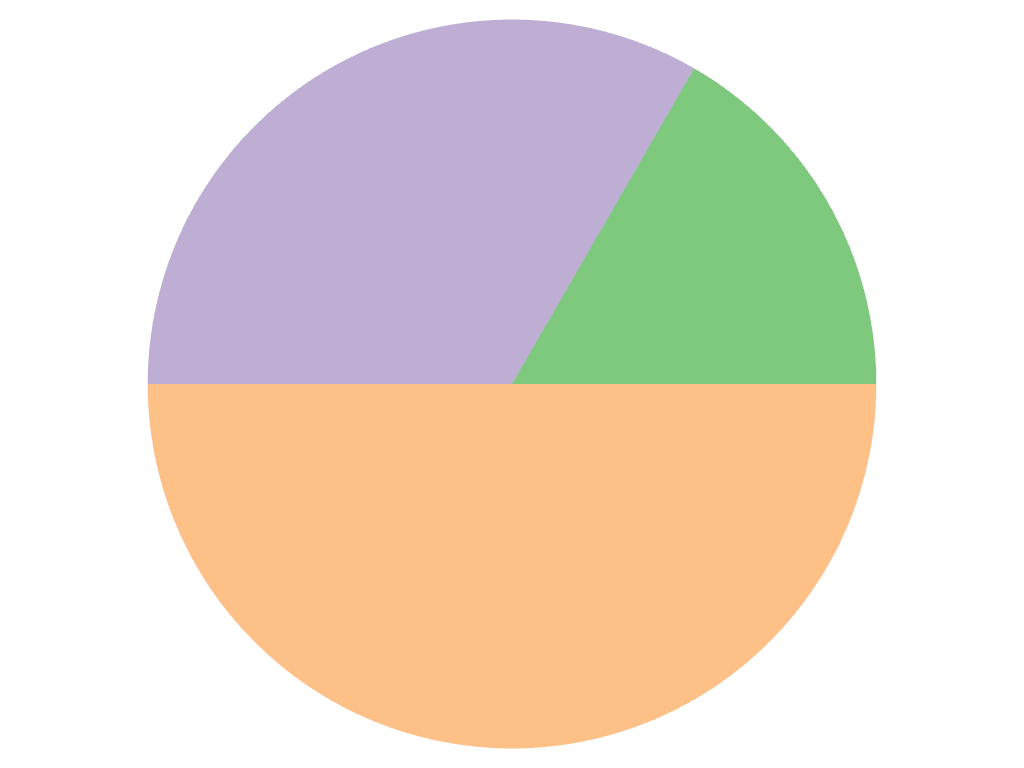
pyvista.plotting.charts.PiePlot.data# property PiePlot.data[ソース]# 描かれたセグメントのサイズを返します. 例 円グラフを作成し,サイズを表示します. >>> import pyvista as pv >>> chart = pv.ChartPie([1, 2, 3]) >>> chart.plot.data pyvista_ndarray([1, 2, 3]) >>> chart.show()