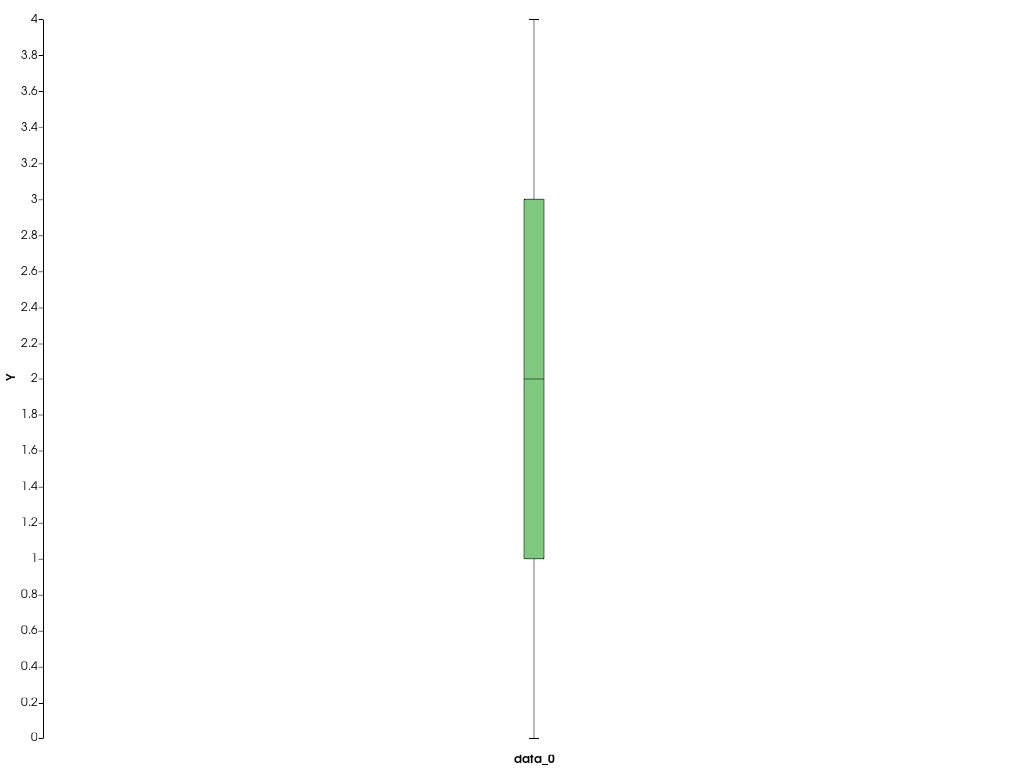
pyvista.plotting.charts.BoxPlot.visible# property BoxPlot.visible[ソース]# 図の表示を返すか設定します. 例 箱ひげ図を作成します. >>> import pyvista as pv >>> chart = pv.ChartBox([[0, 1, 1, 2, 3, 3, 4]]) >>> plot = chart.plot >>> chart.show() それを隠します. >>> plot.visible = False >>> chart.show()