pyvista.plotting.charts.BoxPlot.labels#
- property BoxPlot.labels[ソース]#
チャートの凡例に表示されている,このプロットのラベルを返すか設定します.
例
箱ひげ図を作成します.
>>> import pyvista as pv
>>> chart = pv.ChartBox([[0, 1, 1, 2, 3, 4, 5], [0, 1, 2, 2, 3, 4, 5], [0, 1, 2, 3, 3, 4, 5], [0, 1, 2, 3, 4, 4, 5]])
>>> plot = chart.plot
>>> chart.show()

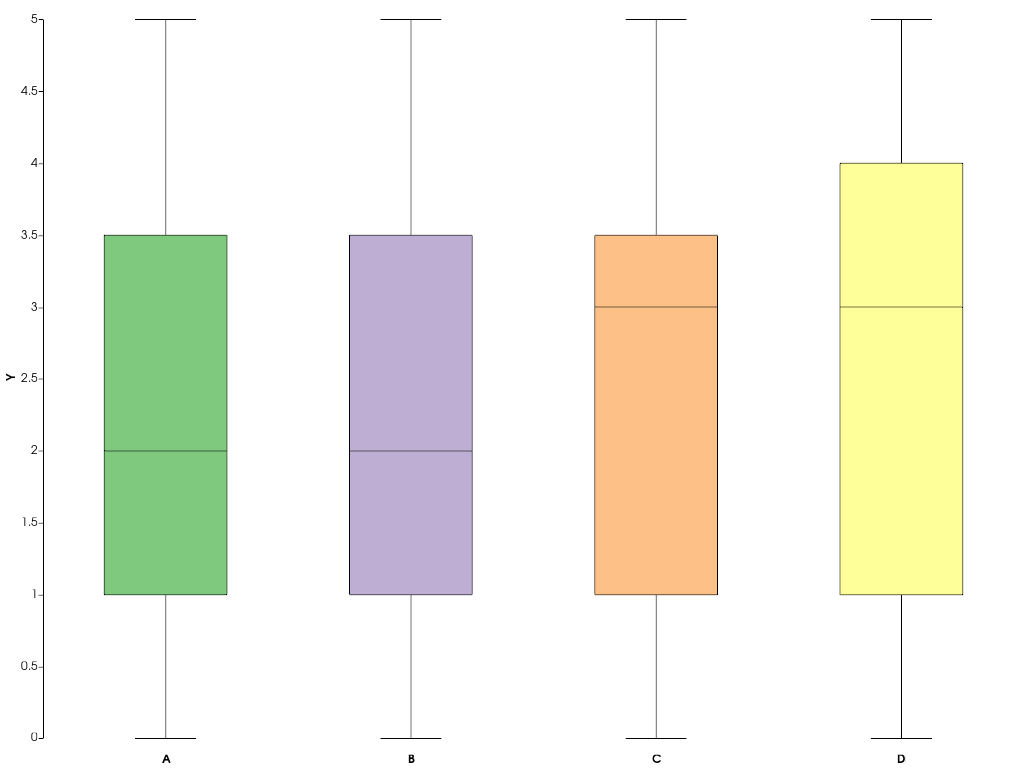
ラベルを変更します.
>>> plot.labels = ['A', 'B', 'C', 'D']
>>> chart.show()