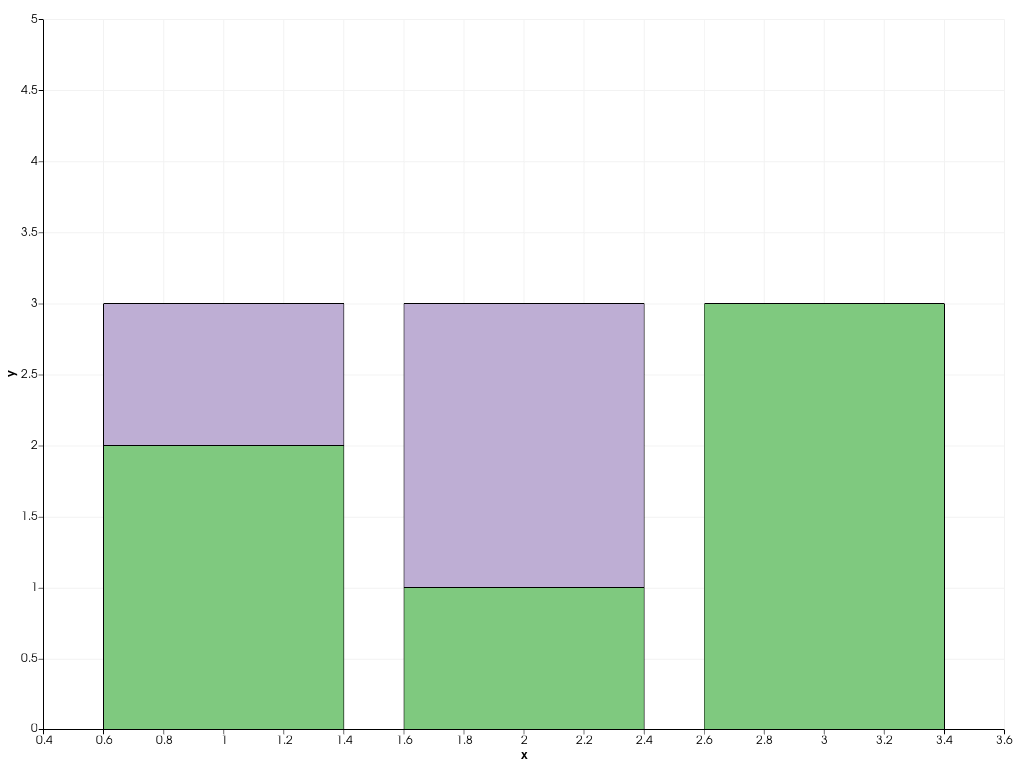
pyvista.plotting.charts.BarPlot.x# property BarPlot.x[ソース]# 描かれたバーの位置を返します. 例 棒グラフを作成し,位置を表示します. >>> import pyvista as pv >>> chart = pv.Chart2D() >>> plot = chart.bar([1, 2, 3], [[2, 1, 3], [1, 2, 0]]) >>> plot.x pyvista_ndarray([1, 2, 3]) >>> chart.show()