pyvista.plotting.charts.BarPlot.update#
- BarPlot.update(x, y) None[ソース]#
このプロットのバーの位置やサイズを更新します.
- パラメータ:
- xarray_like
描画するバーの新しい位置を指定します.
- yarray_like
描画するバーの新しいサイズを指定します.
例
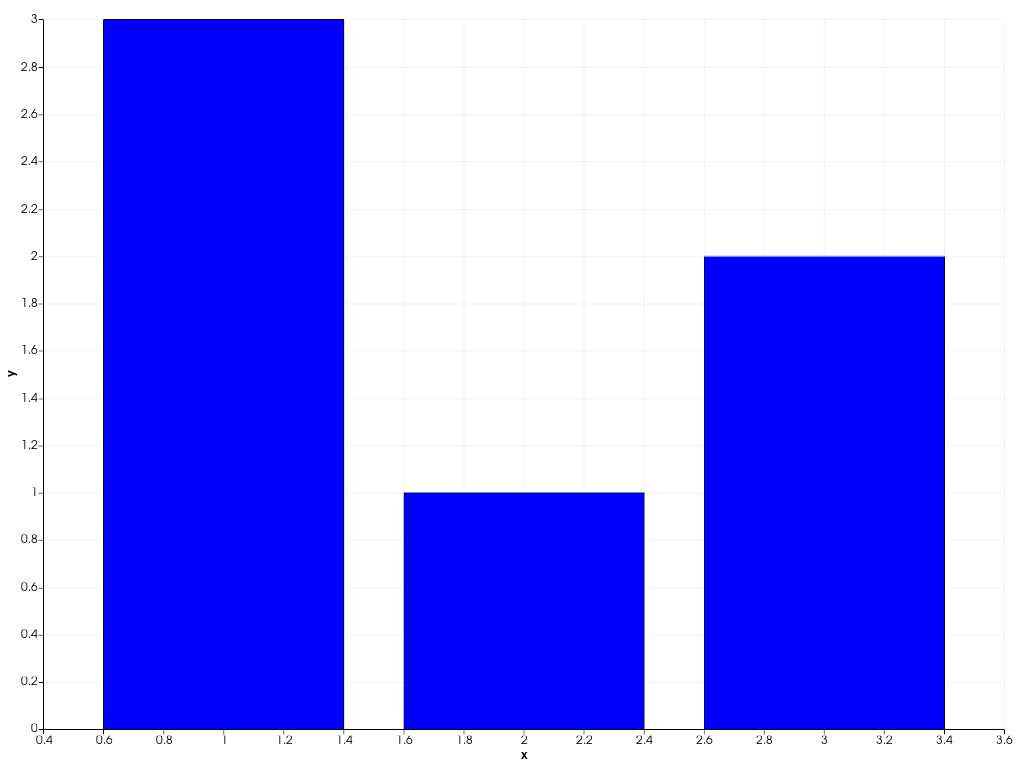
棒グラフを作成します.
>>> import pyvista as pv
>>> chart = pv.Chart2D()
>>> plot = chart.bar([1, 2, 3], [2, 1, 3])
>>> chart.show()
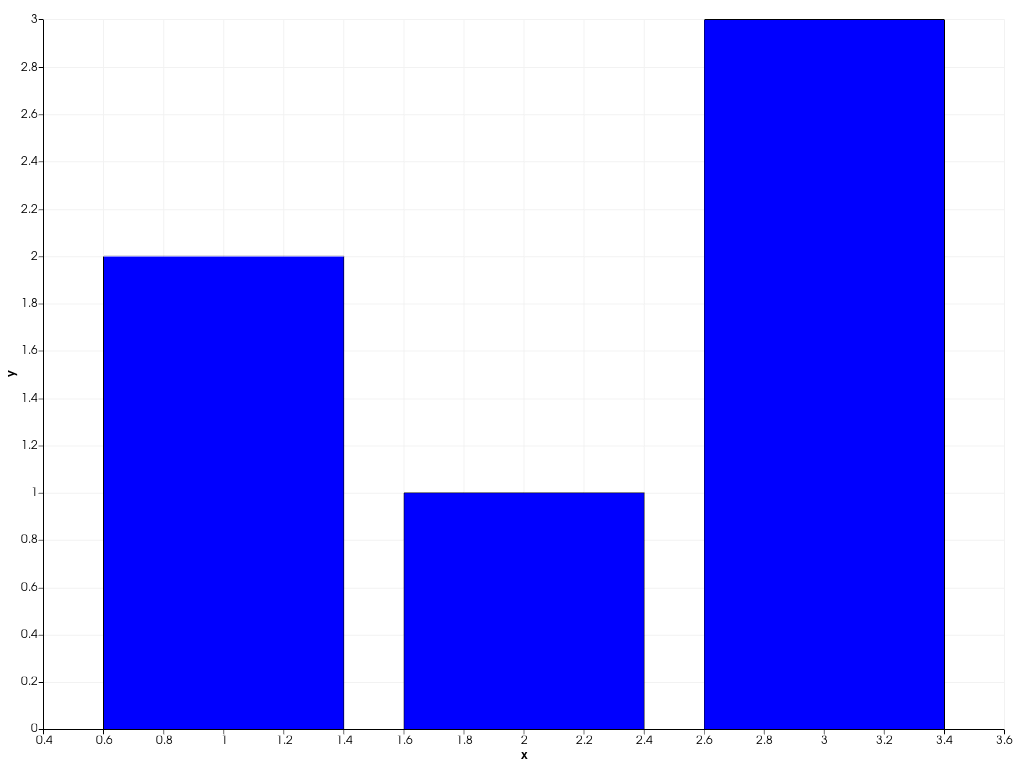
バーのサイズを更新します.
>>> plot.update([1, 2, 3], [3, 1, 2])
>>> chart.show()