pyvista.plotting.charts.Axis.tick_locations#
- property Axis.tick_locations[ソース]#
この軸目盛り位置を返すか設定します.
これを
Noneに設定すると,自動的に決定されたデフォルトの目盛りの位置に戻ります.例
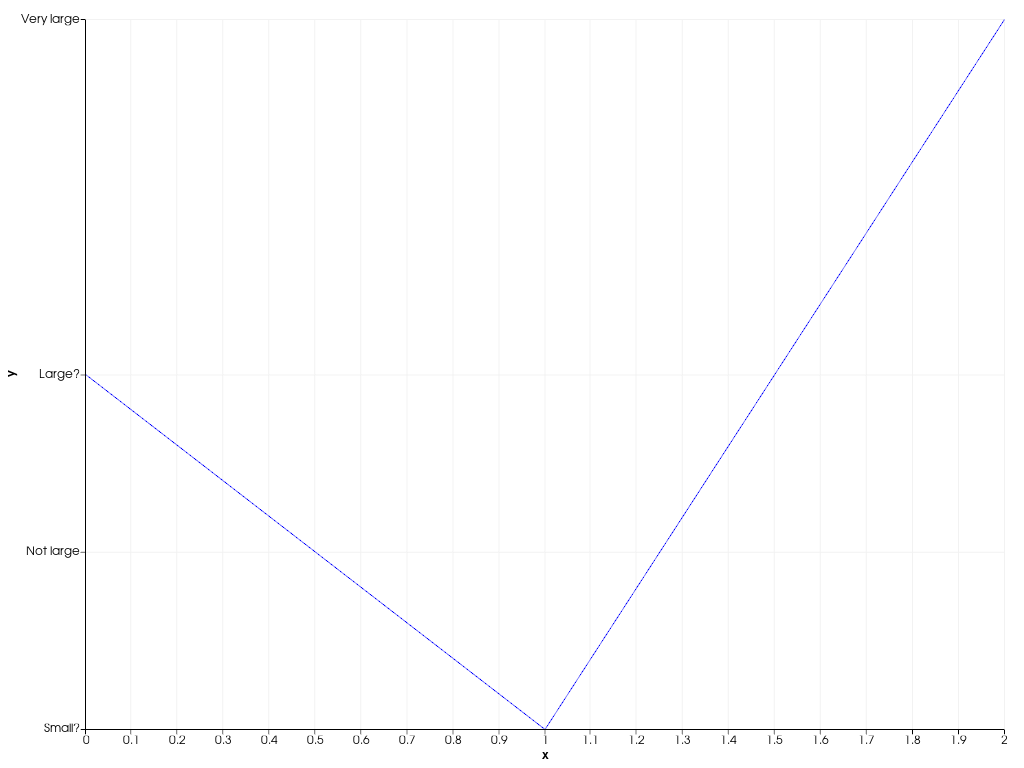
y-軸にカスタム目盛りの位置とラベルを設定した2Dチャートを作成します.
>>> import pyvista as pv
>>> chart = pv.Chart2D()
>>> _ = chart.line([0, 1, 2], [2, 1, 3])
>>> chart.y_axis.tick_locations = (0.2, 0.4, 0.6, 1, 1.5, 2, 3)
>>> chart.y_axis.tick_labels = [
...     'Very small',
...     'Small',
...     'Still small',
...     'Small?',
...     'Not large',
...     'Large?',
...     'Very large',
... ]
>>> chart.show()
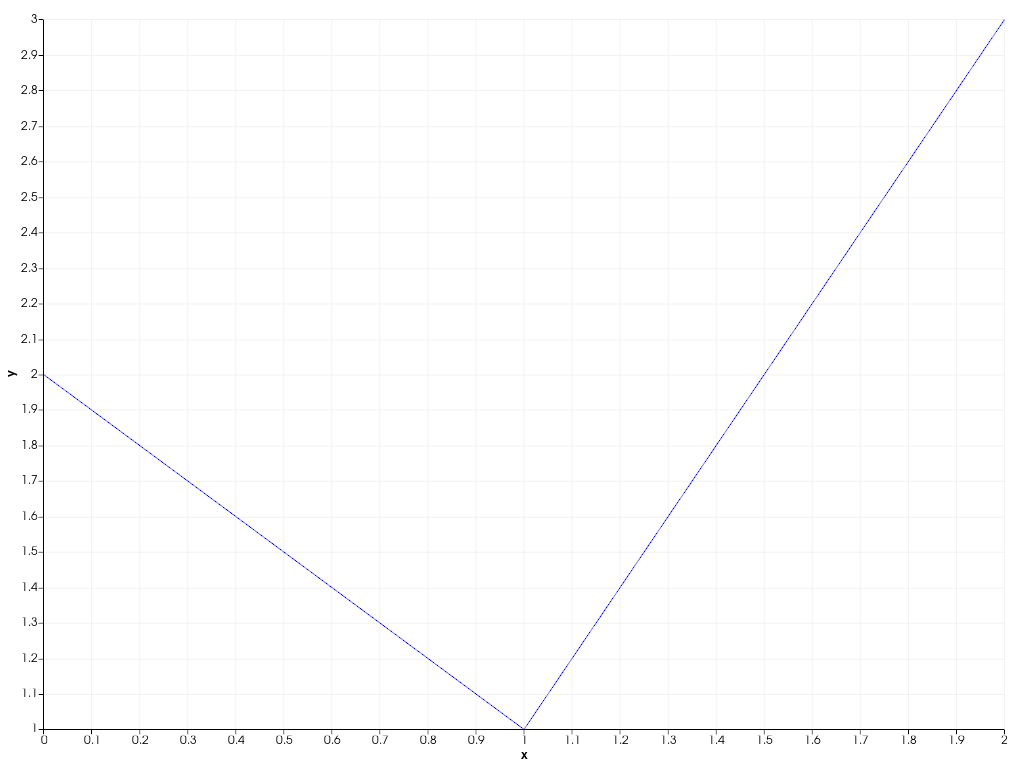
自動刻みの配置に戻します.
>>> chart.y_axis.tick_locations = None
>>> chart.y_axis.tick_labels = None
>>> chart.show()