pyvista.plotting.charts.Axis.tick_count#
- property Axis.tick_count[ソース]#
この軸に描画される目盛りの数を返すか設定します.
このプロパティに負の値または
Noneを設定すると,自動的に適切な目盛りの描画量が決定されます.例
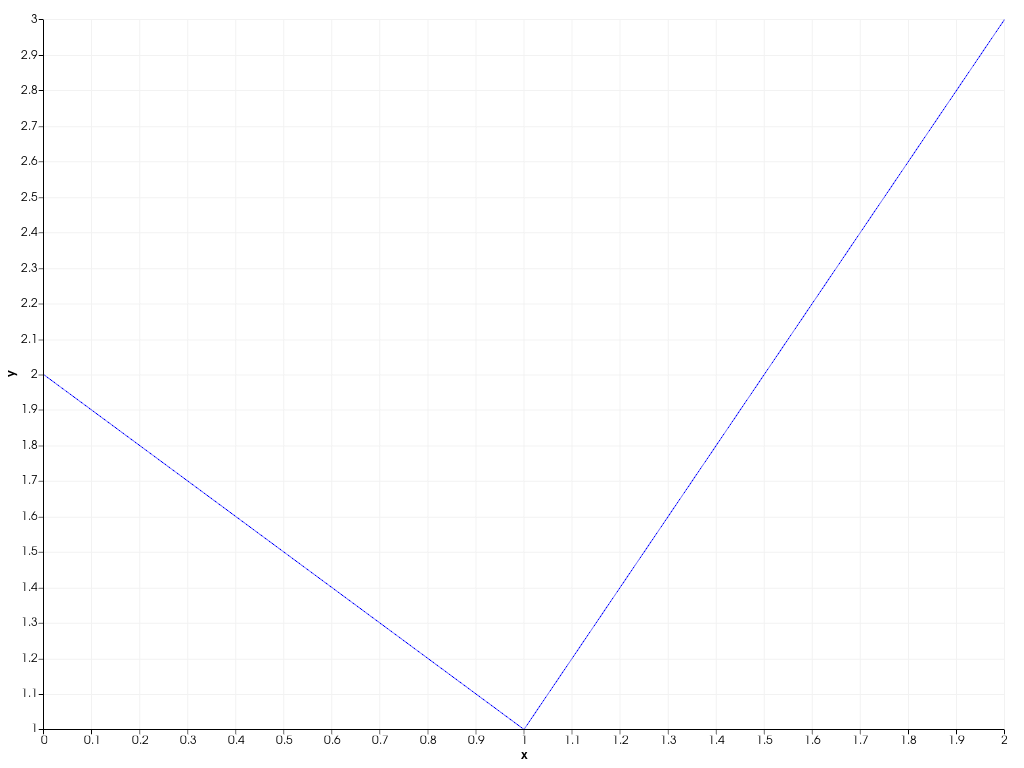
x-軸の目盛りの数を減らした2Dチャートを作成します.
>>> import pyvista as pv
>>> chart = pv.Chart2D()
>>> _ = chart.line([0, 1, 2], [2, 1, 3])
>>> chart.x_axis.tick_count = 5
>>> chart.show()
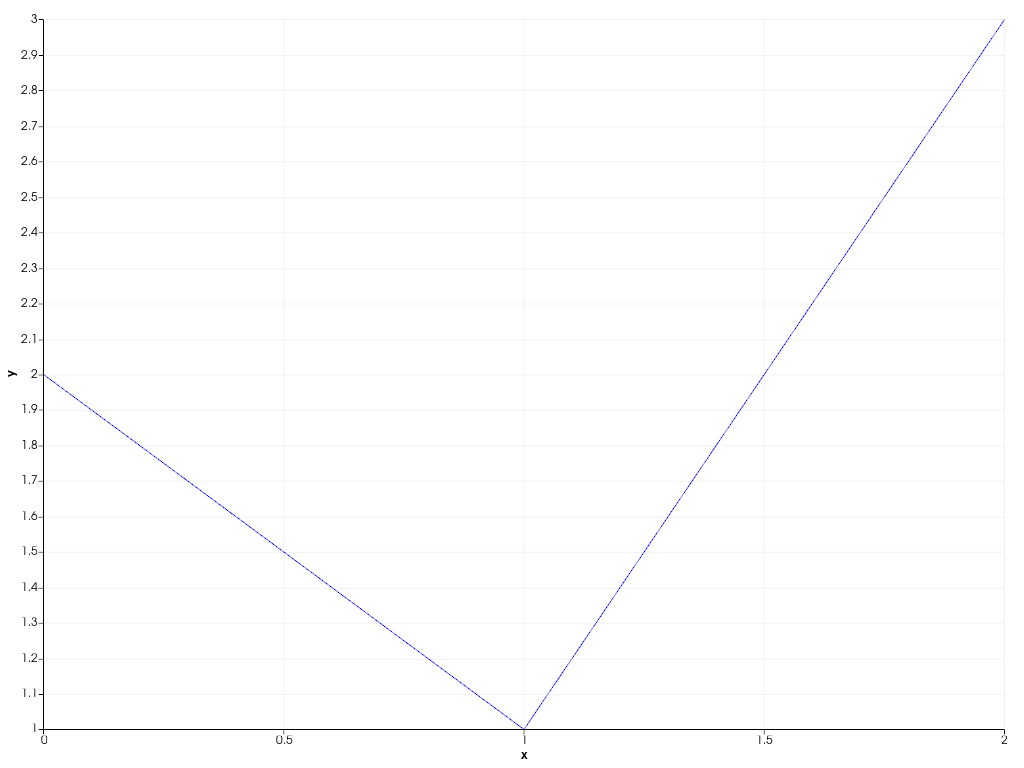
自動刻みの動作に戻します.
>>> chart.x_axis.tick_count = None
>>> chart.show()