pyvista.plotting.charts.Axis.margin#
- property Axis.margin[ソース]#
軸余白を返すか設定します.
例
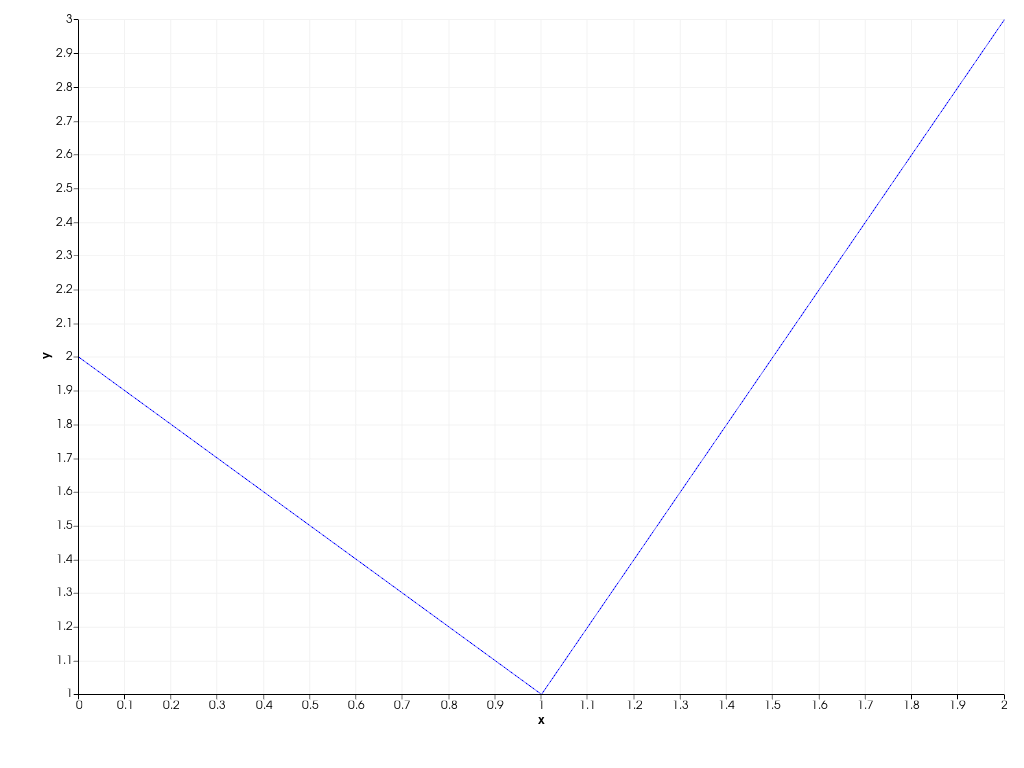
2Dチャートを作成します.
>>> import pyvista as pv
>>> chart = pv.Chart2D()
>>> chart.background_color = 'c'
>>> _ = chart.line([0, 1, 2], [2, 1, 3])
>>> chart.show()
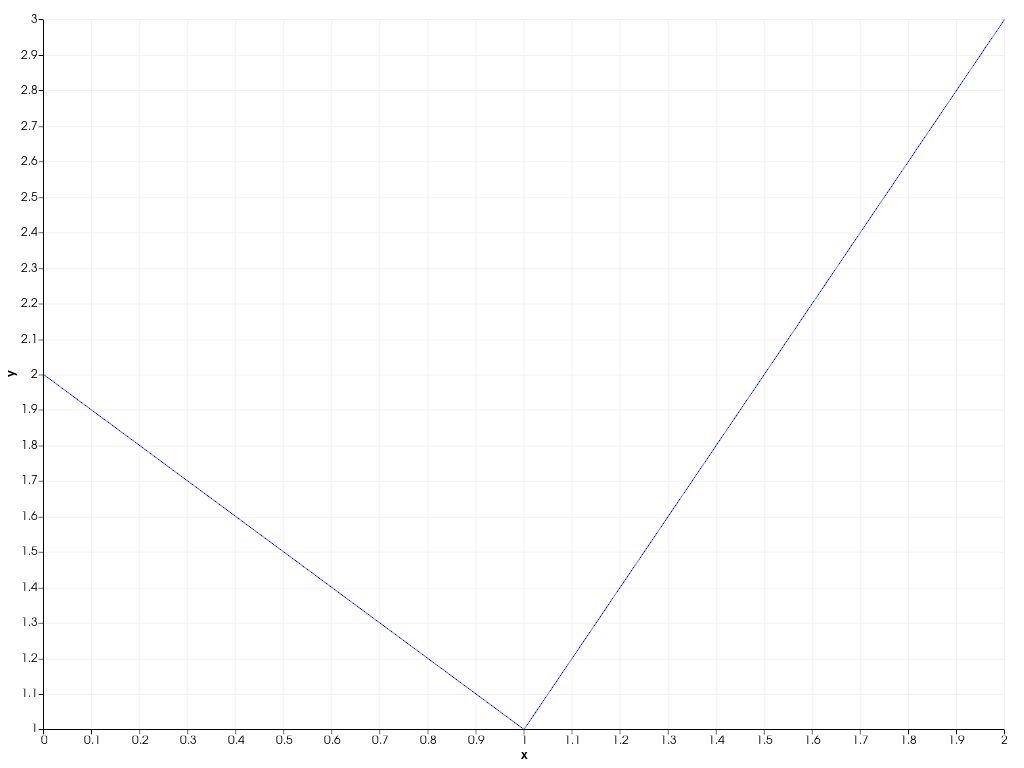
x-軸の余白(下)とy-軸の余白(左)を手動で指定します.
>>> chart.x_axis.margin = 50
>>> chart.y_axis.margin = 50
>>> chart.show()