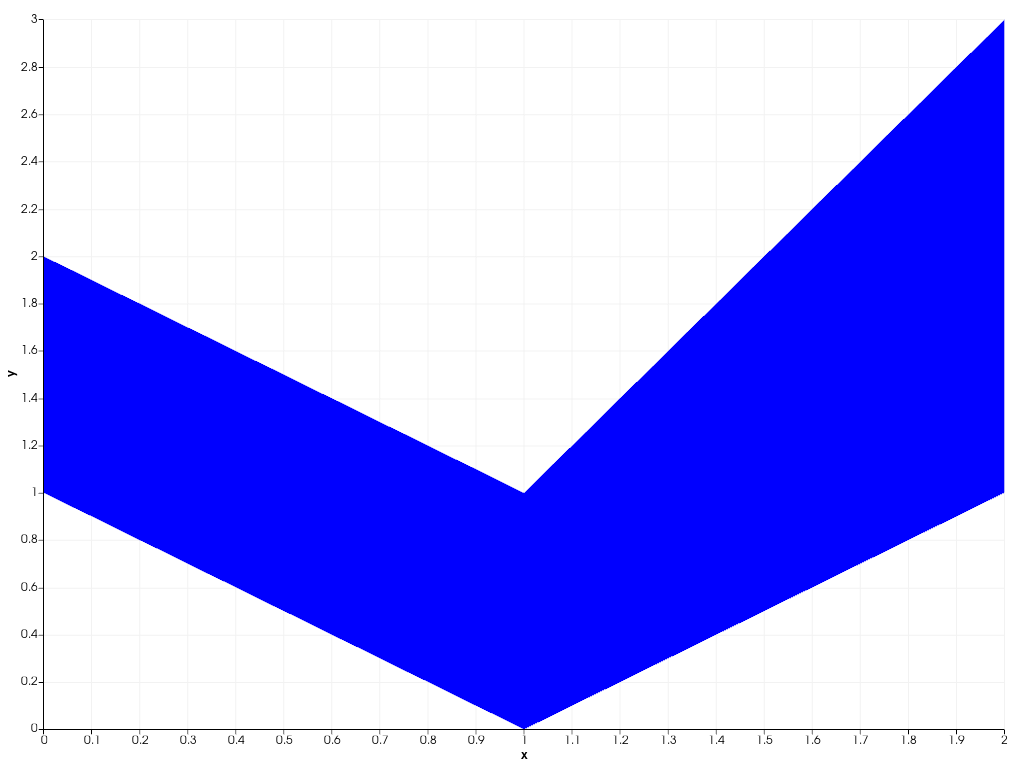
pyvista.plotting.charts.AreaPlot.y1# property AreaPlot.y1[ソース]# 描画領域の最初の輪郭上の点のY座標を返します. 例 面グラフを作成し,y1座標を表示します. >>> import pyvista as pv >>> chart = pv.Chart2D() >>> plot = chart.area([0, 1, 2], [2, 1, 3], [1, 0, 1]) >>> plot.y1 pyvista_ndarray([2, 1, 3]) >>> chart.show()