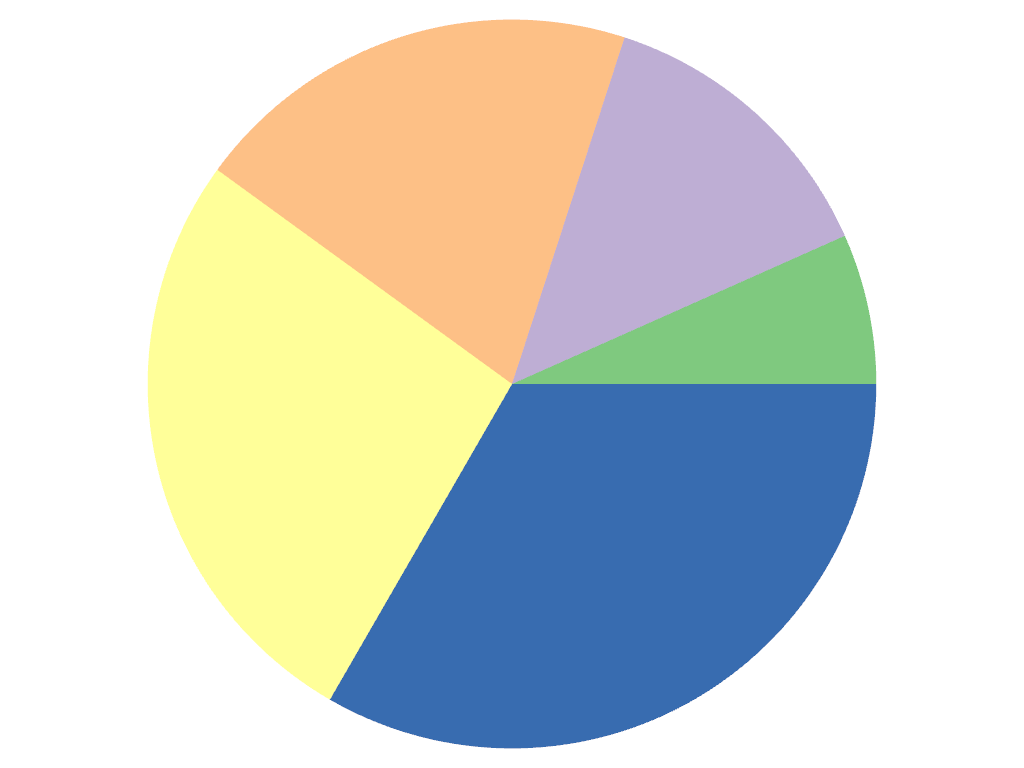
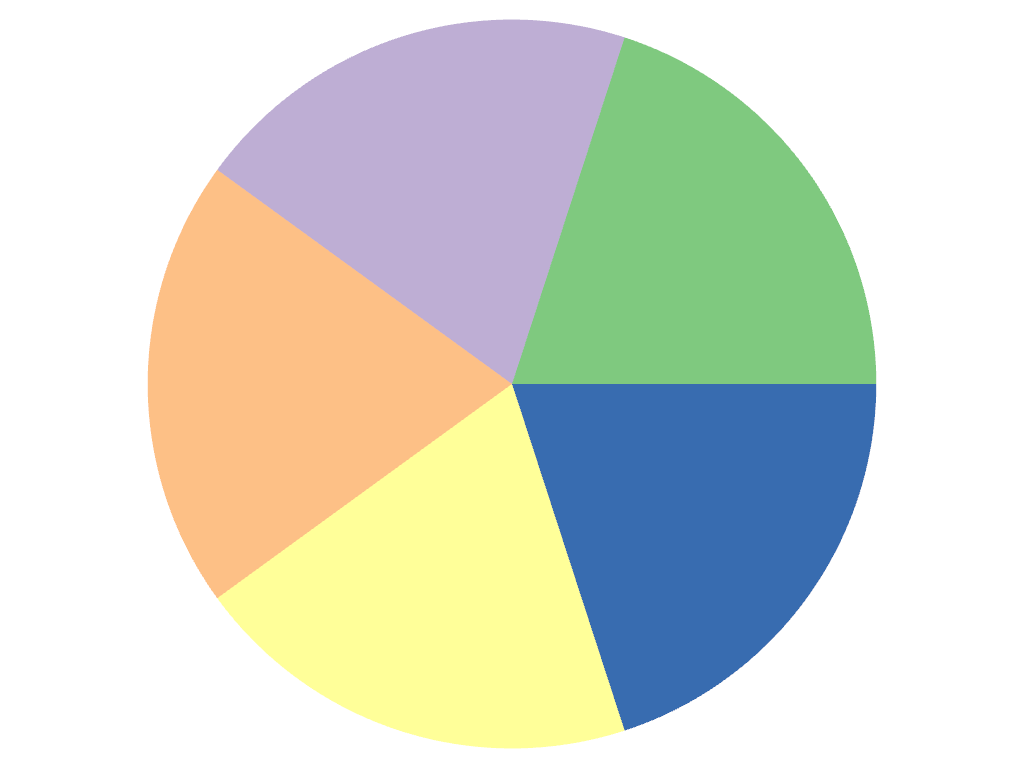
pyvista.ChartPie.plot# property ChartPie.plot[ソース]# このチャートに関連付けられた PiePlot インスタンスを返します. 例 大きさの異なるセグメントで円グラフを作成します. >>> import pyvista as pv >>> chart = pv.ChartPie([1, 2, 3, 4, 5]) >>> chart.show() 円グラフを更新します(大きさの等しいセグメント). >>> chart.plot.update([1, 1, 1, 1, 1]) >>> chart.show()