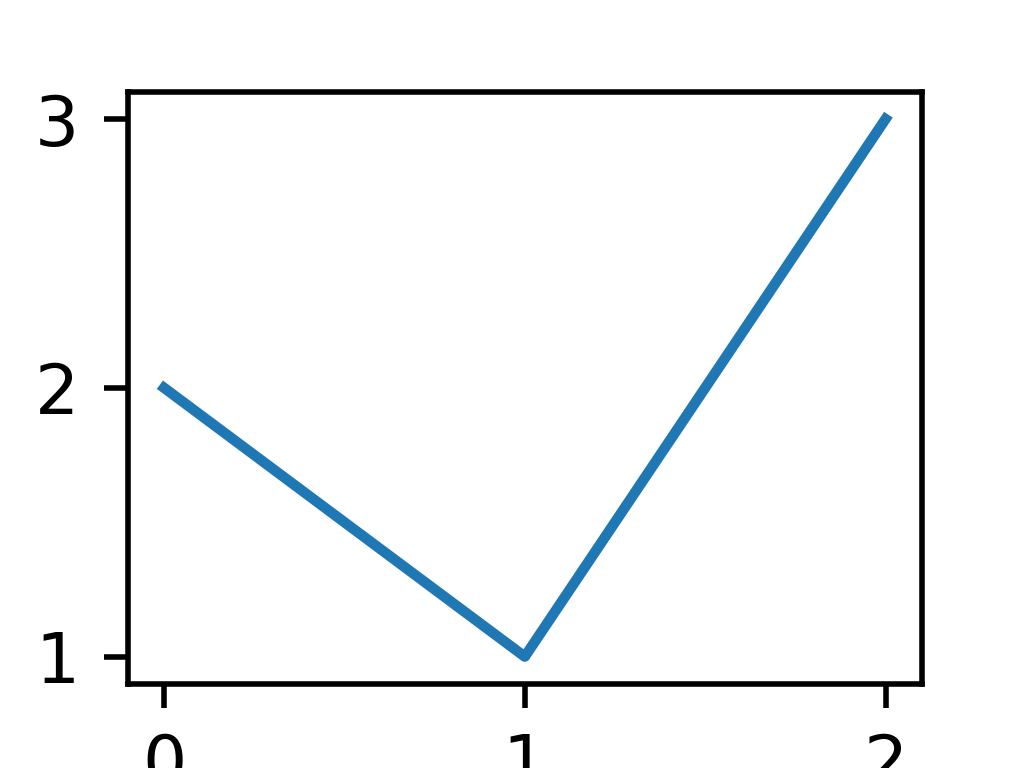
pyvista.ChartMPL.figure# property ChartMPL.figure[ソース]# このチャートに関連するmatplotlibの図を返します. 例 既存の図からmatplotlibのチャートを作成します. >>> import pyvista as pv >>> import matplotlib.pyplot as plt >>> f, ax = plt.subplots() >>> _ = ax.plot([0, 1, 2], [2, 1, 3]) >>> chart = pv.ChartMPL(f) >>> chart.figure is f True >>> chart.show()