pyvista.ChartMPL.active_background_color#
- property ChartMPL.active_background_color[ソース]#
インタラクティブモードでのチャートの背景色を返すか設定します.
例
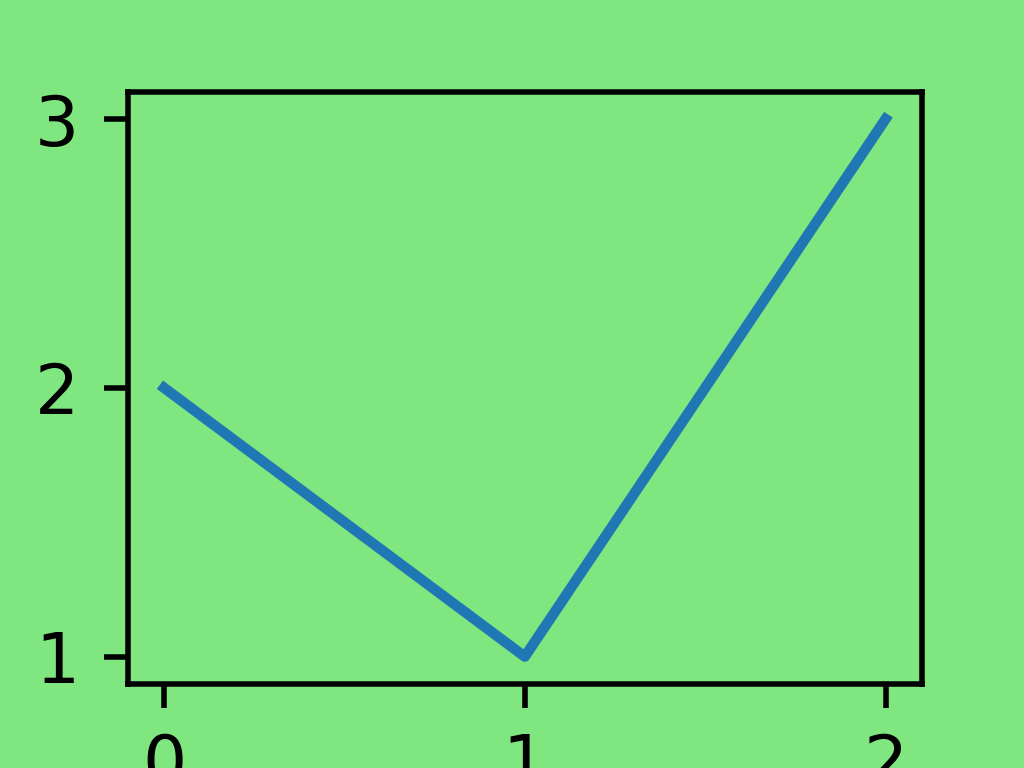
緑の背景のmatplotlibチャートを作成します.
>>> import pyvista as pv
>>> chart = pv.ChartMPL()
>>> plots = chart.figure.axes[0].plot([0, 1, 2], [2, 1, 3])
>>> chart.background_color = (0.5, 0.9, 0.5)
>>> chart.show(interactive=False)
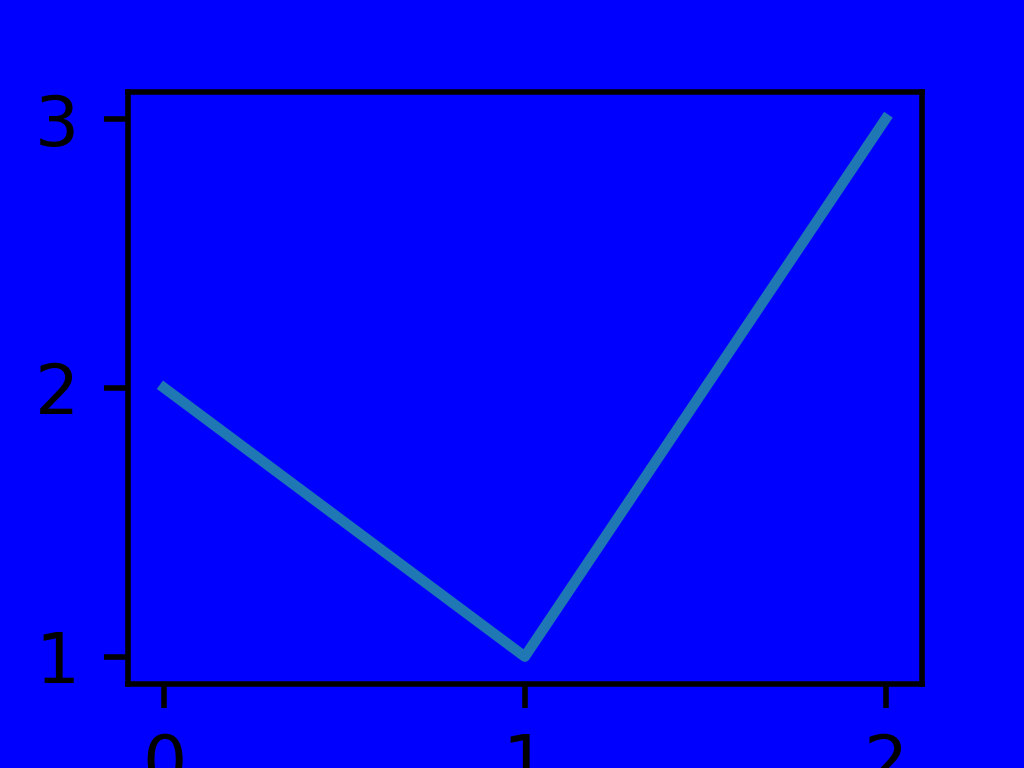
アクティブな背景色を青に設定し,チャートをアクティブにします.
>>> chart.active_background_color = 'b'
>>> chart.show(interactive=True)