pyvista.ChartBox.plot#
- property ChartBox.plot[ソース]#
このチャートに関連付けられた
BoxPlotインスタンスを返します.例
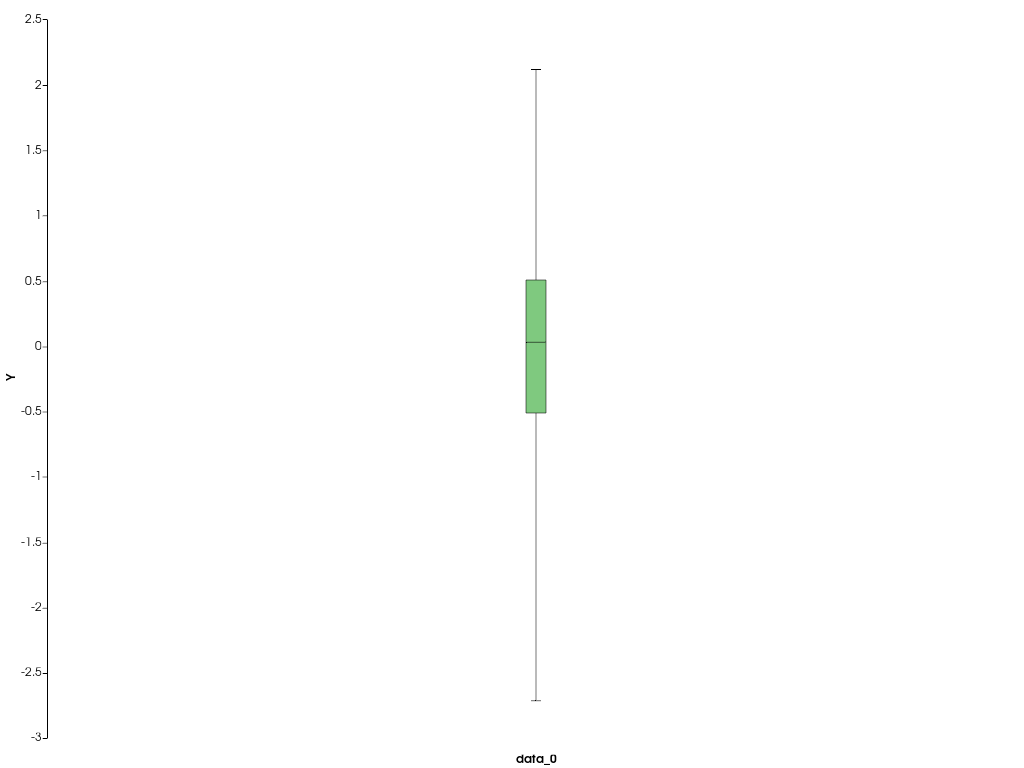
標準的なガウス型データセットから箱ひげ図を作成します.
>>> import pyvista as pv
>>> import numpy as np
>>> rng = np.random.default_rng(
...     1
... )  # Seeded random number generator for data generation
>>> chart = pv.ChartBox([rng.normal(size=100)])
>>> chart.show()
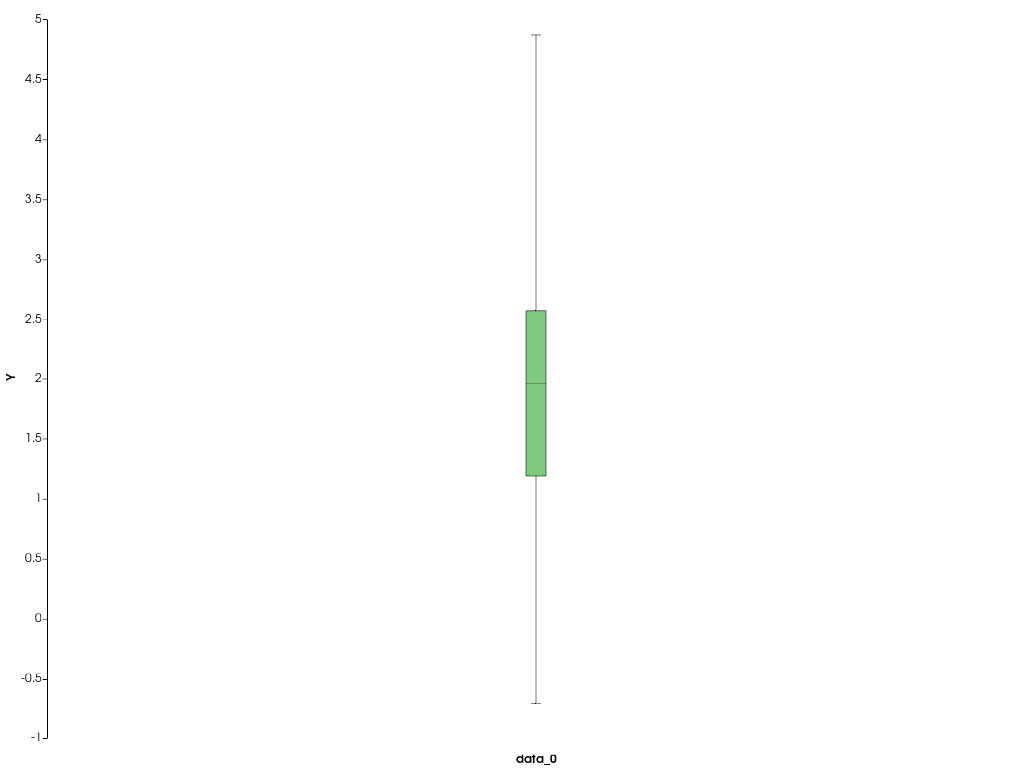
箱ひげ図の更新(標準ガウス分布のシフト).
>>> chart.plot.update([rng.normal(loc=2, size=100)])
>>> chart.show()