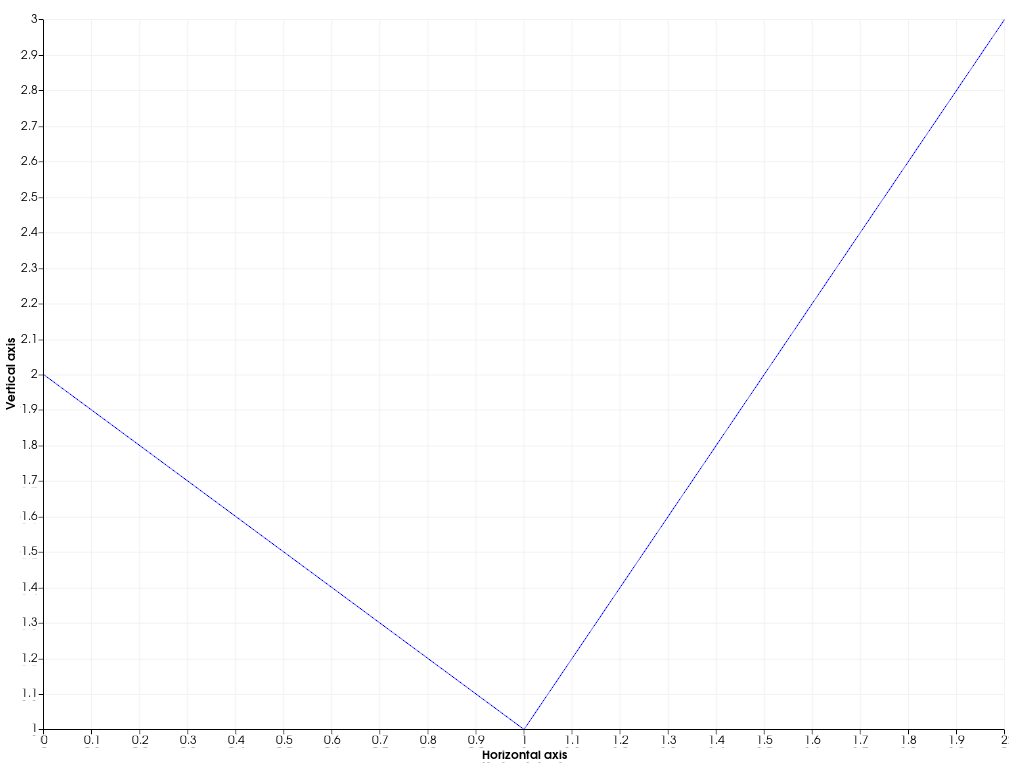
pyvista.Chart2D.y_label# property Chart2D.y_label[ソース]# Return or set the label of this chart's y-axis. 例 2Dプロットを作成し,カスタムの軸ラベルを設定することができます. >>> import pyvista as pv >>> chart = pv.Chart2D() >>> _ = chart.line([0, 1, 2], [2, 1, 3]) >>> chart.x_label = 'Horizontal axis' >>> chart.y_label = 'Vertical axis' >>> chart.show()