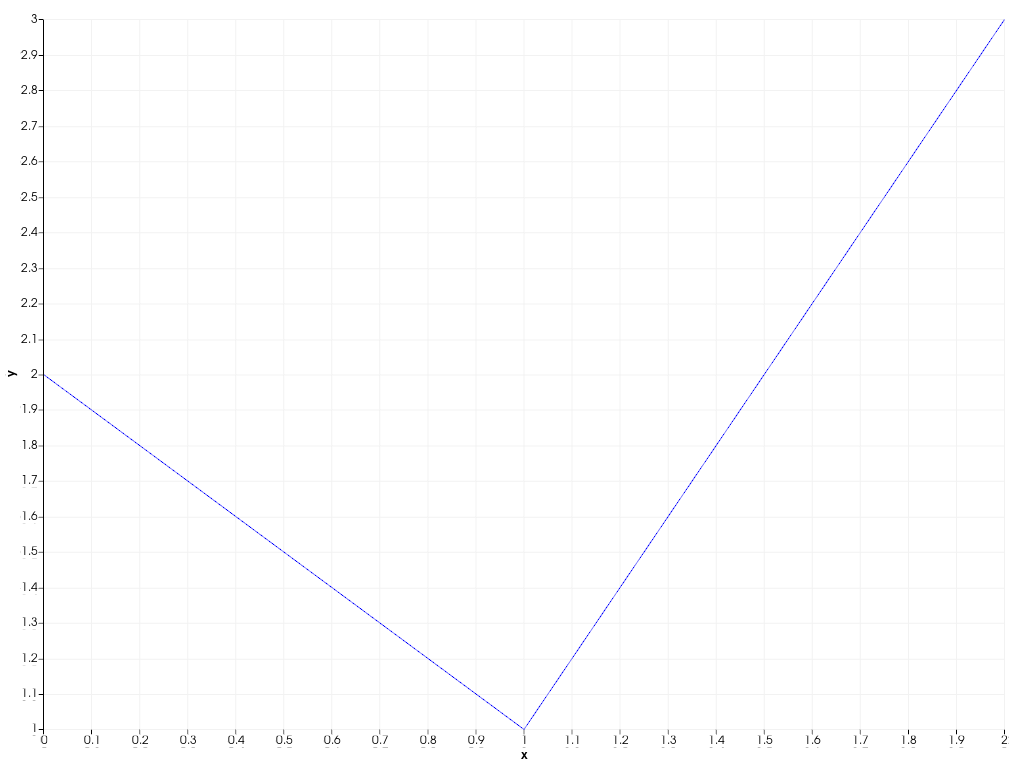
pyvista.Chart2D.x_axis# property Chart2D.x_axis[ソース]# このチャートの水平方向(x)の Axis を返します. 例 Create a 2D plot and hide the x-axis. >>> import pyvista as pv >>> chart = pv.Chart2D() >>> _ = chart.line([0, 1, 2], [2, 1, 3]) >>> chart.x_axis.toggle() >>> chart.show()