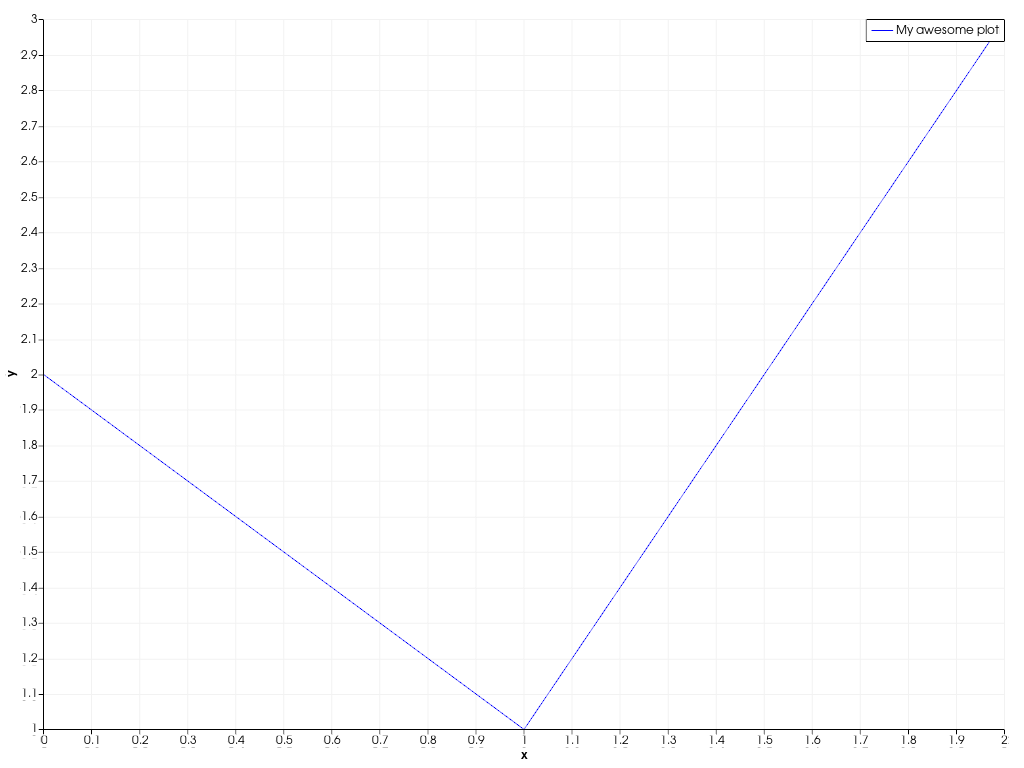
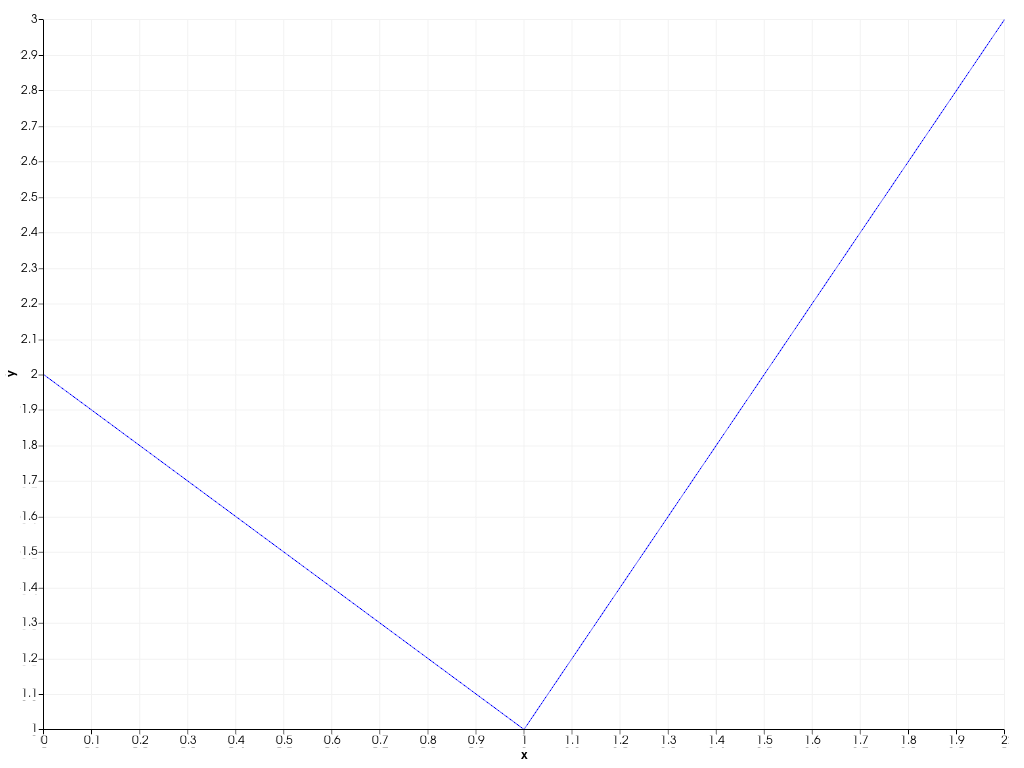
pyvista.Chart2D.legend_visible# property Chart2D.legend_visible[ソース]# チャートの凡例の表示を返すか設定します. 例 カスタムラベル付きの2Dチャートを作成することができます. >>> import pyvista as pv >>> chart = pv.Chart2D() >>> plot = chart.line([0, 1, 2], [2, 1, 3]) >>> plot.label = "My awesome plot" >>> chart.show() 凡例を隠します. >>> chart.legend_visible = False >>> chart.show()