pyvista.DataSetFilters.align#
- DataSetFilters.align(
- target: DataSet | _vtk.vtkDataSet,
- max_landmarks: int = 100,
- max_mean_distance: float = 1e-05,
- max_iterations: int = 500,
- check_mean_distance: bool = True,
- start_by_matching_centroids: bool = True,
- return_matrix: bool = False,
データセットを別のデータセットに位置合わせします.
2つのメッシュのポイントを揃えるために,反復的な最も近いポイントアルゴリズムを使用します.VTK クラス vtkIterativeClosestPointTransform を参照してください.
- パラメータ:
- target
pyvista.DataSet 位置合わせする対象のデータセット.
- max_landmarks
int, default: 100 ランドマークの最大数.
- max_mean_distance
float, default: 1e-5 収束のための最大平均距離.
- max_iterations
int, default: 500 最大反復回数.
- check_mean_distancebool, default:
True 平均距離の収束を確認するかどうか.
- start_by_matching_centroidsbool, default:
True 重心のマッチングによって位置合わせを開始するかどうか.デフォルトはTrue.
- return_matrixbool, default:
False 変換行列と位置合わせされたメッシュを返します.
- target
- 戻り値:
- aligned
pyvista.DataSet ターゲットメッシュに位置合わせされたデータセット.
- matrix
numpy.ndarray 入力データセットをターゲットデータセットに変換するための変換行列.
- aligned
参考
align_xyzデータセットをx-y-z軸に位置合わせします.
例
円柱を作成し,それを平行移動させ,反復的に最も近い点を使用してメッシュを元の位置に合わせます.
>>> import pyvista as pv
>>> import numpy as np
>>> source = pv.Cylinder(resolution=30).triangulate().subdivide(1)
>>> transformed = source.rotate_y(20).translate([-0.75, -0.5, 0.5])
>>> aligned = transformed.align(source)
>>> _, closest_points = aligned.find_closest_cell(
...     source.points, return_closest_point=True
... )
>>> dist = np.linalg.norm(source.points - closest_points, axis=1)
ソースメッシュ,変換されたメッシュ,位置合わせされたメッシュを可視化します.
>>> pl = pv.Plotter(shape=(1, 2))
>>> _ = pl.add_text('Before Alignment')
>>> _ = pl.add_mesh(source, style='wireframe', opacity=0.5, line_width=2)
>>> _ = pl.add_mesh(transformed)
>>> pl.subplot(0, 1)
>>> _ = pl.add_text('After Alignment')
>>> _ = pl.add_mesh(source, style='wireframe', opacity=0.5, line_width=2)
>>> _ = pl.add_mesh(
...     aligned,
...     scalars=dist,
...     scalar_bar_args={
...         'title': 'Distance to Source',
...         'fmt': '%.1E',
...     },
... )
>>> pl.show()
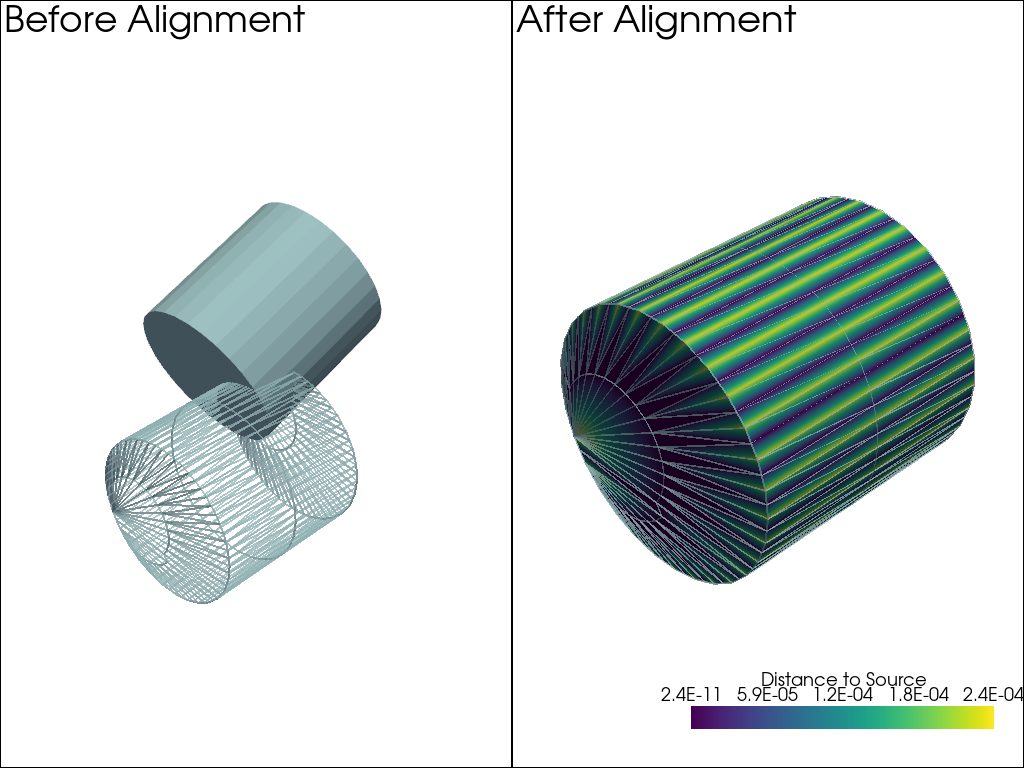
ソースとターゲットの平均距離がほぼゼロであることを示します.
>>> np.abs(dist).mean()
9.997635192915073e-05