pyvista.DataSet.point_neighbors_levels#
- DataSet.point_neighbors_levels( ) Generator[list[int], None, None][ソース]#
ポイント近傍の連続したレベルを返します.
- パラメータ:
- ind
int ポイントIDです.
- n_levels
int, default: 1 ポイントの近傍を検索するレベルの数.1であれば,
pyvista.DataSet.point_neighbors()と同じです.
- ind
- 戻り値:
例
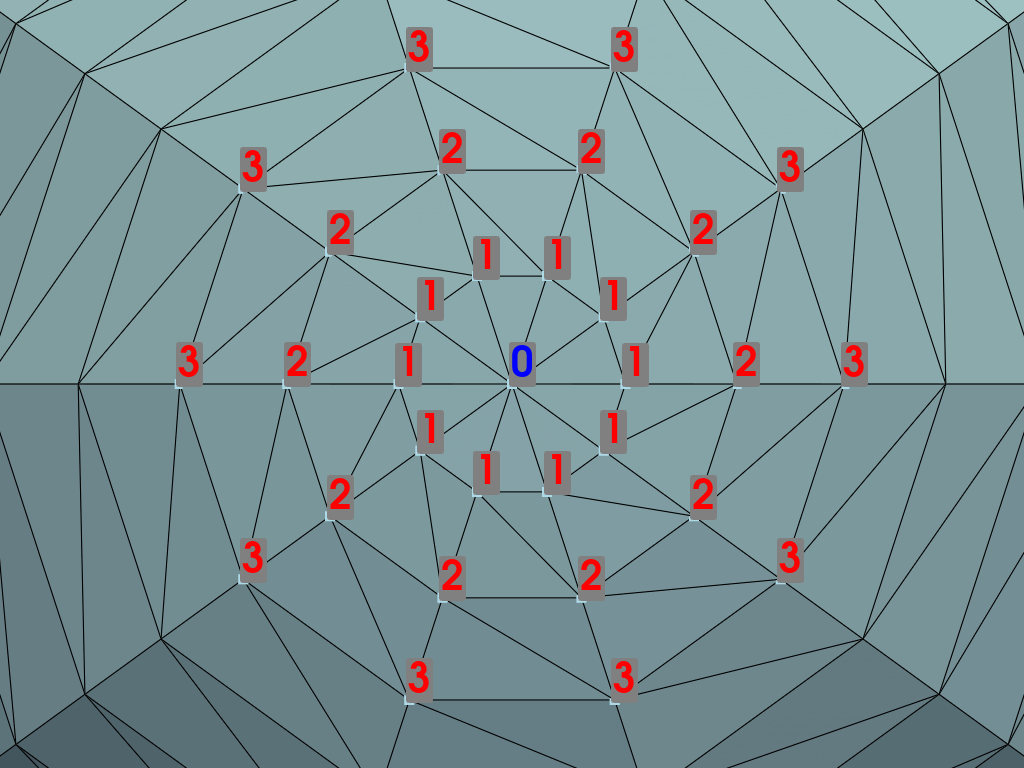
0番目のポイントから3番目のレベルまでの近傍のポイントIDを返します.
>>> import pyvista as pv
>>> mesh = pv.Sphere(theta_resolution=10)
>>> pt_nbr_levels = mesh.point_neighbors_levels(0, 3)
>>> pt_nbr_levels = list(pt_nbr_levels)
>>> pt_nbr_levels[0]
[2, 226, 198, 170, 142, 114, 86, 30, 58, 254]
>>> pt_nbr_levels[1]
[3, 227, 255, 199, 171, 143, 115, 87, 59, 31]
>>> pt_nbr_levels[2]
[256, 32, 4, 228, 200, 172, 144, 116, 88, 60]
このポイントIDを可視化します.
>>> from functools import partial
>>> pl = pv.Plotter()
>>> _ = pl.add_mesh(mesh, show_edges=True)
>>>
>>> # Define partial function to add point labels
>>> add_point_labels = partial(
...     pl.add_point_labels,
...     text_color='white',
...     font_size=40,
...     point_size=10,
... )
>>>
>>> # Add the first point label
>>> _ = add_point_labels(mesh.points[0], labels=['0'], text_color='blue')
>>>
>>> # Add the neighbors to the plot
>>> neighbors = mesh.point_neighbors_levels(0, n_levels=3)
>>> for i, ids in enumerate(neighbors, start=1):
...     _ = add_point_labels(
...         mesh.points[ids],
...         labels=[f'{i}'] * len(ids),
...         text_color='red',
...     )
>>>
>>> pl.view_xy()
>>> pl.camera.zoom(4.0)
>>> pl.show()