注釈
Go to the end をクリックすると完全なサンプルコードをダウンロードできます.
マルチウィンドウプロット#
サブプロット:1つのウィンドウに複数のシーンを表示
import pyvista as pv
from pyvista import examples
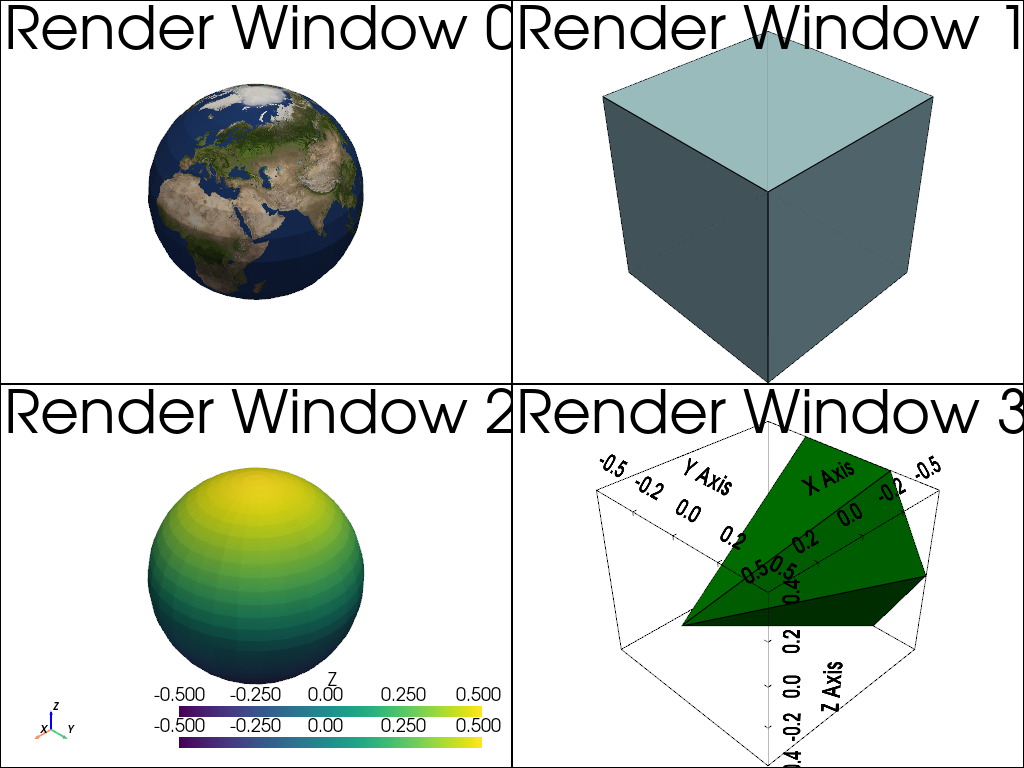
この例では, shape パラメータを指定してマルチウィンドウプロッタを作成する方法を示します. shape=(2, 2) を設定すると,生成されるウィンドウは2×2ウィンドウになります.アクティブなサブプロットにするサブプロットを選択するには, pyvista.Plotter.subplot() メソッドを使用します.
plotter = pv.Plotter(shape=(2, 2))

plotter.subplot(0, 0)
plotter.add_text("Render Window 0", font_size=30)
globe = examples.load_globe()
texture = examples.load_globe_texture()
plotter.add_mesh(globe, texture=texture)

plotter.subplot(0, 1)
plotter.add_text("Render Window 1", font_size=30)
plotter.add_mesh(pv.Cube(), show_edges=True, color='lightblue')

plotter.subplot(1, 0)
plotter.add_text("Render Window 2", font_size=30)
sphere = pv.Sphere()
plotter.add_mesh(sphere, scalars=sphere.points[:, 2])
plotter.add_scalar_bar("Z")
# plotter.add_axes()
plotter.add_axes(interactive=True)

plotter.subplot(1, 1)
plotter.add_text("Render Window 3", font_size=30)
plotter.add_mesh(pv.Cone(), color="g", show_edges=True)
plotter.show_bounds(all_edges=True)

# Display the window
plotter.show()
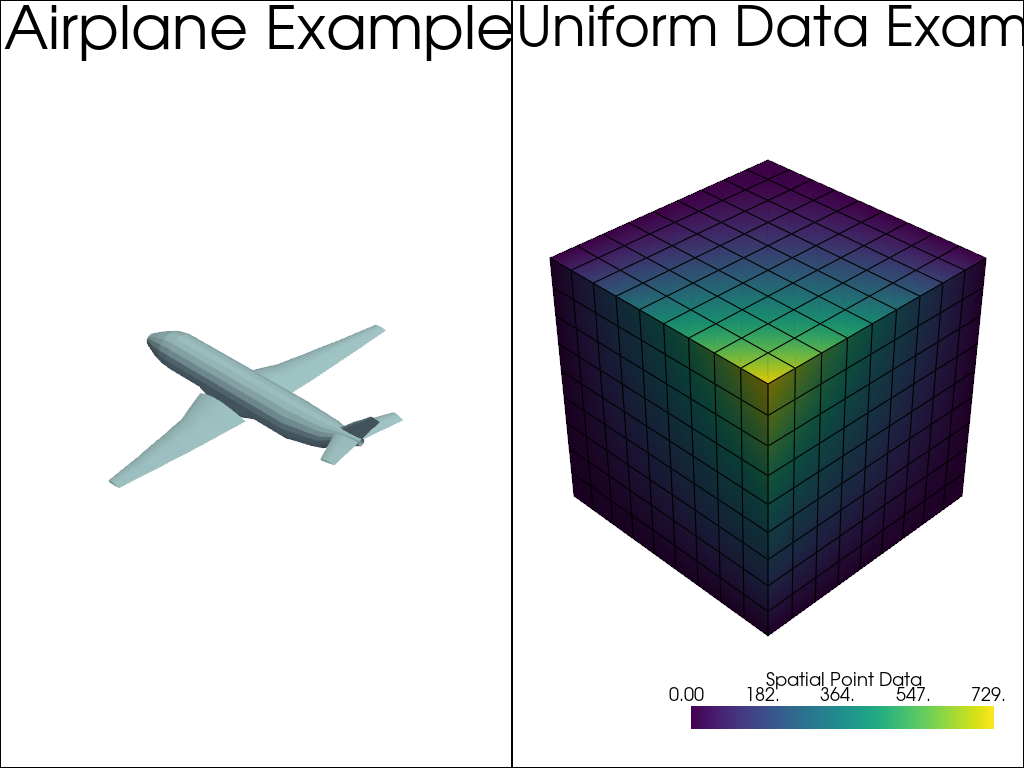
plotter = pv.Plotter(shape=(1, 2))

# Note that the (0, 0) location is active by default
# load and plot an airplane on the left half of the screen
plotter.add_text("Airplane Example\n", font_size=30)
plotter.add_mesh(examples.load_airplane(), show_edges=False)

# load and plot the uniform data example on the right-hand side
plotter.subplot(0, 1)
plotter.add_text("Uniform Data Example\n", font_size=30)
plotter.add_mesh(examples.load_uniform(), show_edges=True)

# Display the window
plotter.show()
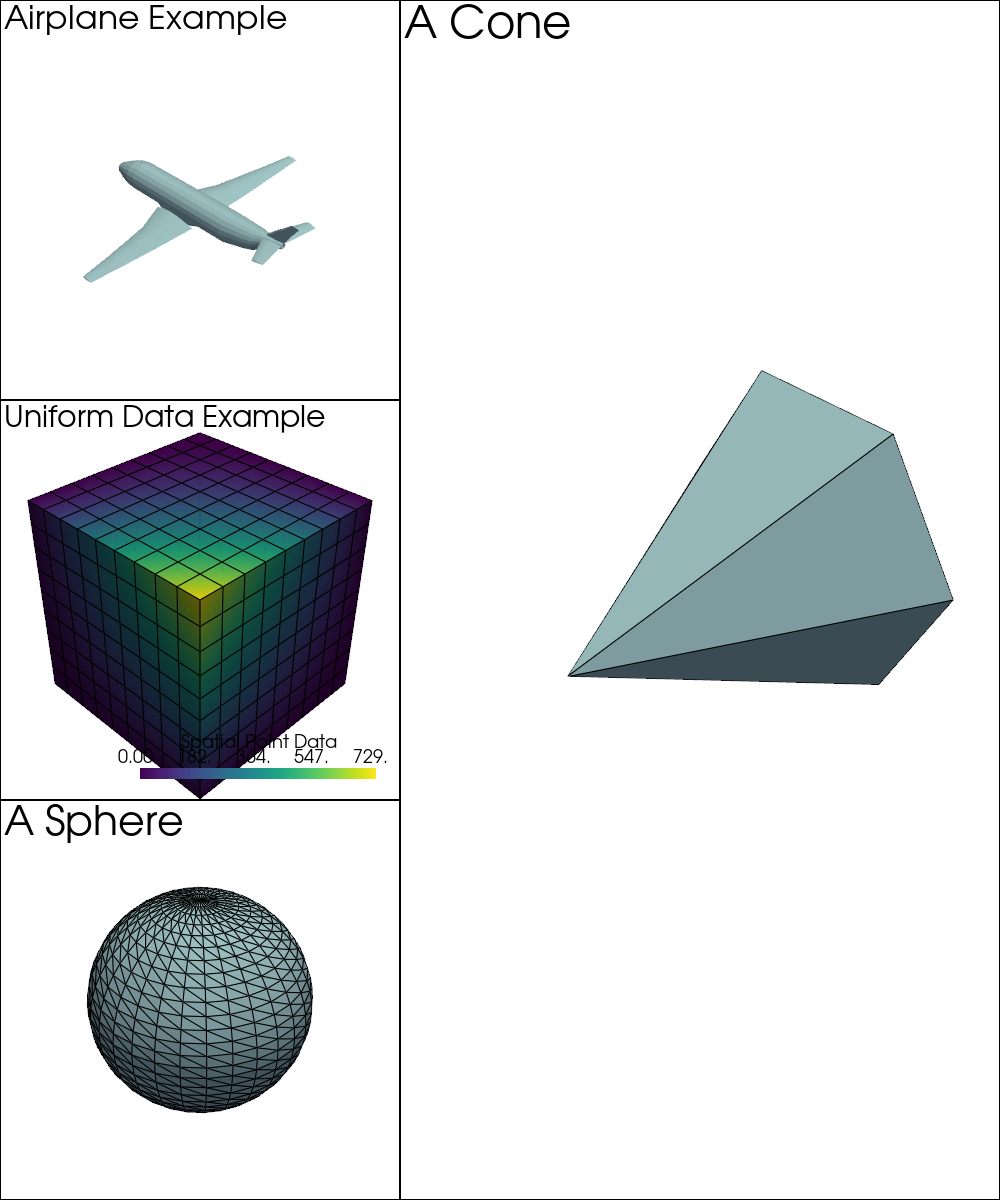
レンダリングウィンドウを半分に分割し,垂直サブプロットまたは水平サブプロットに分割します.
# This defines the position of the vertical/horizontal splitting, in this
# case 40% of the vertical/horizontal dimension of the window
pv.global_theme.multi_rendering_splitting_position = 0.40

# shape="3|1" means 3 plots on the left and 1 on the right,
# shape="4/2" means 4 plots on top of 2 at bottom.
plotter = pv.Plotter(shape='3|1', window_size=(1000, 1200))

plotter.subplot(0)
plotter.add_text("Airplane Example")
plotter.add_mesh(examples.load_airplane(), show_edges=False)

# load and plot the uniform data example on the right-hand side
plotter.subplot(1)
plotter.add_text("Uniform Data Example")
plotter.add_mesh(examples.load_uniform(), show_edges=True)

plotter.subplot(2)
plotter.add_text("A Sphere")
plotter.add_mesh(pv.Sphere(), show_edges=True)

plotter.subplot(3)
plotter.add_text("A Cone")
plotter.add_mesh(pv.Cone(), show_edges=True)

# Display the window
plotter.show()
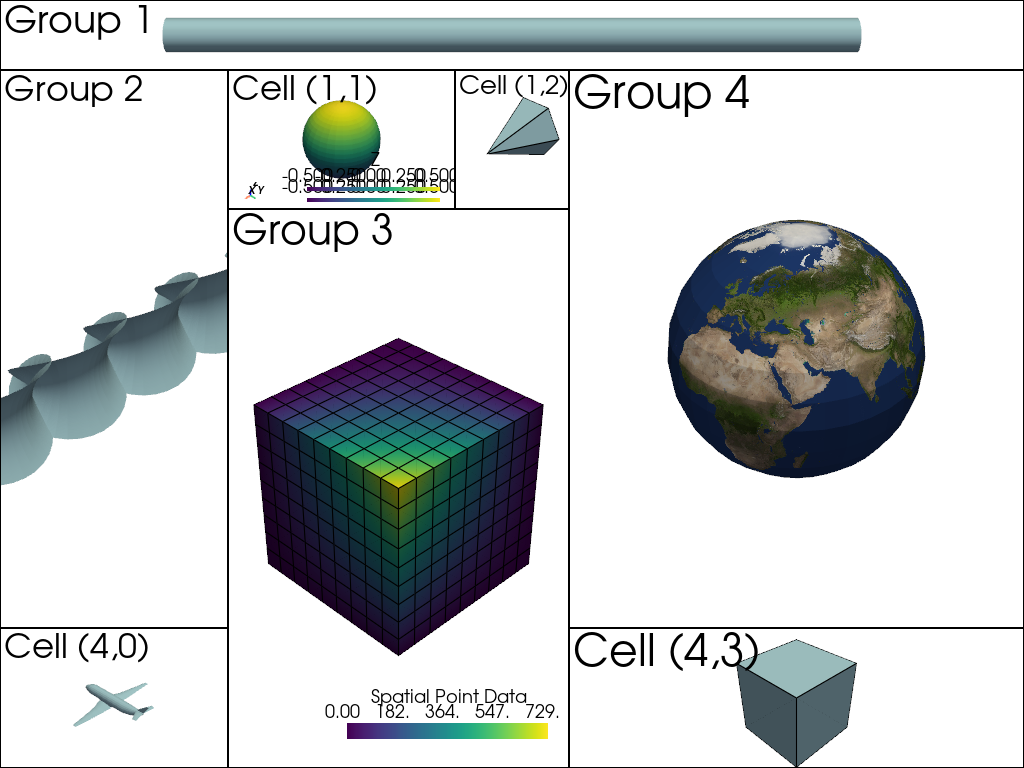
レイアウトグリッド上で完全な柔軟性を得るには,行と列の相対的な重み付けを定義し,複数の行と列にまたがるレジスタグループを定義します.グループは,行と列のインデックスかスライスの組 (行,列) を通して定義されます.グループは常に,リストまたはスライスを通過する最小のIDから最大のID (行または列)までの範囲になります.
# numpy is imported for a more convenient slice notation through np.s_
import numpy as np

shape = (5, 4)  # 5 by 4 grid
# First row is half the size and fourth row is double the size of the other rows
row_weights = [0.5, 1, 1, 2, 1]
# Third column is half the size and fourth column is double size of the other columns
col_weights = [1, 1, 0.5, 2]
groups = [
    (0, np.s_[:]),  # First group spans over all columns of the first row (0)
    ([1, 3], 0),  # Second group spans over row 1-3 of the first column (0)
    (np.s_[2:], [1, 2]),  # Third group spans over rows 2-4 and columns 1-2
    (slice(1, -1), 3),  # Fourth group spans over rows 1-3 of the last column (3)
]

plotter = pv.Plotter(shape=shape, row_weights=row_weights, col_weights=col_weights, groups=groups)

# A grouped subplot can be activated through any of its composing cells using
# the subplot() method.

# Access all subplots and groups and plot something:
plotter.subplot(0, 0)
plotter.add_text("Group 1")
plotter.add_mesh(pv.Cylinder(direction=[0, 1, 0], height=20))
plotter.view_yz()
plotter.camera.zoom(10)

plotter.subplot(2, 0)
plotter.add_text("Group 2")
plotter.add_mesh(pv.ParametricCatalanMinimal(), show_edges=False, color='lightblue')
plotter.view_isometric()
plotter.camera.zoom(2)

plotter.subplot(2, 1)
plotter.add_text("Group 3")
plotter.add_mesh(examples.load_uniform(), show_edges=True)

plotter.subplot(1, 3)
plotter.add_text("Group 4")
globe = examples.load_globe()
texture = examples.load_globe_texture()
plotter.add_mesh(globe, texture=texture)

plotter.subplot(1, 1)
plotter.add_text("Cell (1,1)")
sphere = pv.Sphere()
plotter.add_mesh(sphere, scalars=sphere.points[:, 2])
plotter.add_scalar_bar("Z")
plotter.add_axes(interactive=True)

plotter.subplot(1, 2)
plotter.add_text("Cell (1,2)")
plotter.add_mesh(pv.Cone(), show_edges=True)

plotter.subplot(4, 0)
plotter.add_text("Cell (4,0)")
plotter.add_mesh(examples.load_airplane(), show_edges=False)

plotter.subplot(4, 3)
plotter.add_text("Cell (4,3)")
plotter.add_mesh(pv.Cube(), show_edges=True, color='lightblue')

# Display the window
plotter.show()
Total running time of the script: (0 minutes 2.747 seconds)