注釈
Go to the end to download the full example code
ルックアップテーブル#
PyVistaでのルックアップテーブルの使い方を説明します.
pyvista.LookupTable を使用すると, pyvista.DataSet' のスカラーと RGBA カラー間のマッピングを細かく制御することができます.
import pyvista as pv
from pyvista import examples

# download an example dataset
bracket = examples.download_fea_bracket().cell_data_to_point_data()
bracket
デフォルトのカラーマップ - ルックアップテーブル#
まず,デフォルトのカラーマップ, "viridis" を使ってプロットしてみましょう.内部的には,PyVistaは自動的にルックアップテーブルを作成して,スカラー(ここでは point_data に格納されています)をRGBAカラーにマップします.これは pyvista.DataSetMapper のネストされた属性として表示され,便利な repr メソッドを持っています.
pl = pv.Plotter()
actor = pl.add_mesh(bracket)
actor.mapper.lookup_table
LookupTable (0x7f21812a9600)
  Table Range:                (0.014368999749422073, 23.26799964904785)
  N Values:                   256
  Above Range Color:          None
  Below Range Color:          None
  NAN Color:                  Color(name='darkgray', hex='#a9a9a9ff', opacity=255)
  Log Scale:                  False
  Color Map:                  "viridis"
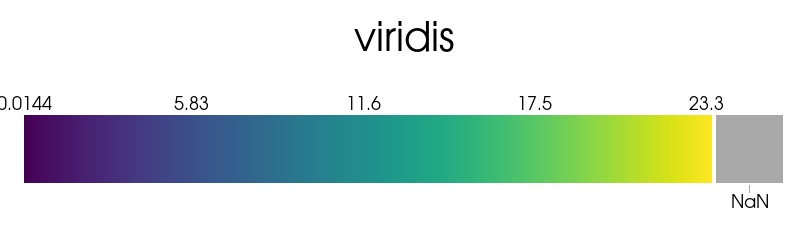
ルックアップテーブルをプロットする#
また,ルックアップテーブルをプロットして,スカラー値(ここでは0〜23.3)とRGBAカラーの対応関係を確認することもできます.
pl = pv.Plotter()
actor = pl.add_mesh(bracket)
actor.mapper.lookup_table.plot()

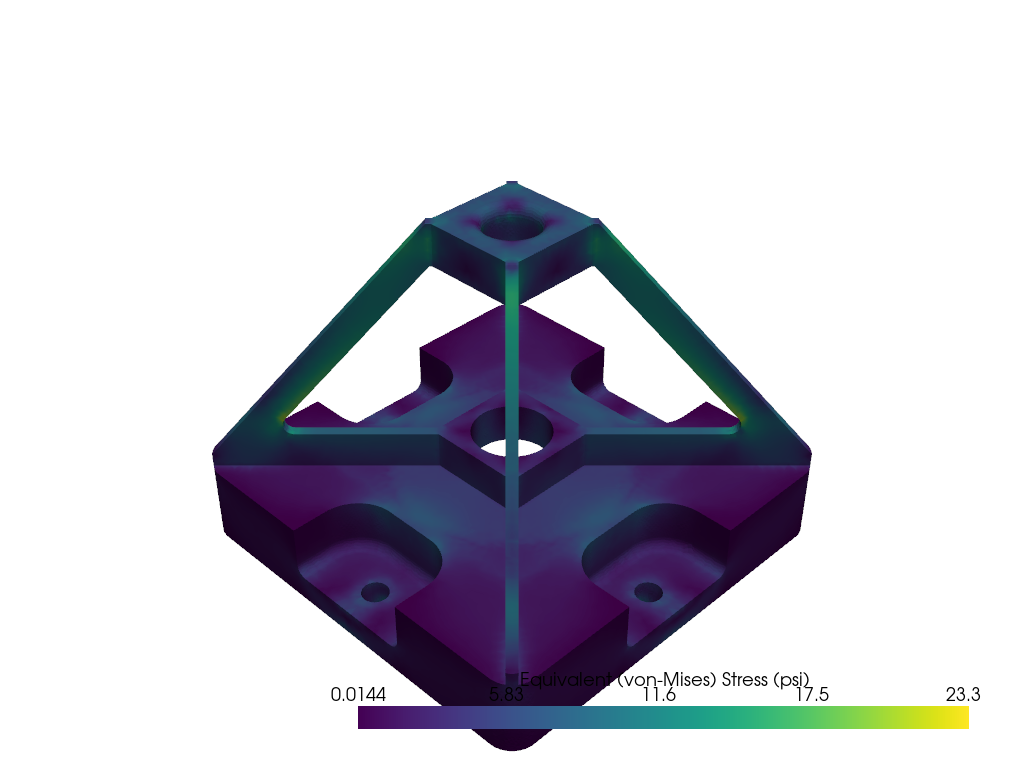
データセットのプロット#
自動生成されたルックアップテーブルを使って,データセットをプロットしてみましょう.
pl = pv.Plotter()
pl.add_mesh(bracket)
pl.show()

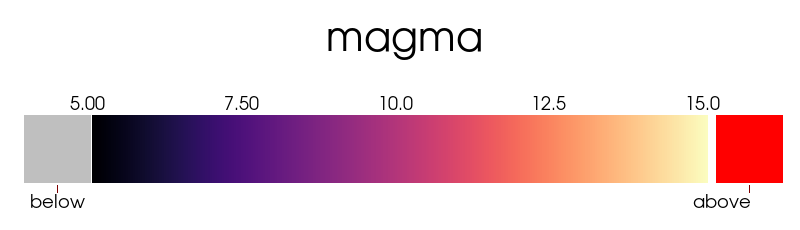
Matplotlibのカラーマップを使ってカスタムのルックアップテーブルを作成する#
ここでは,狭いテーブル範囲 (clim と同じ) と,その上下のカラー値を持つルックアップテーブルを作成します.
lut = pv.LookupTable(cmap='magma')
lut.scalar_range = (5, 15)
lut.below_range_color = pv.Color('grey', opacity=0.5)
lut.above_range_color = 'r'
lut.plot()
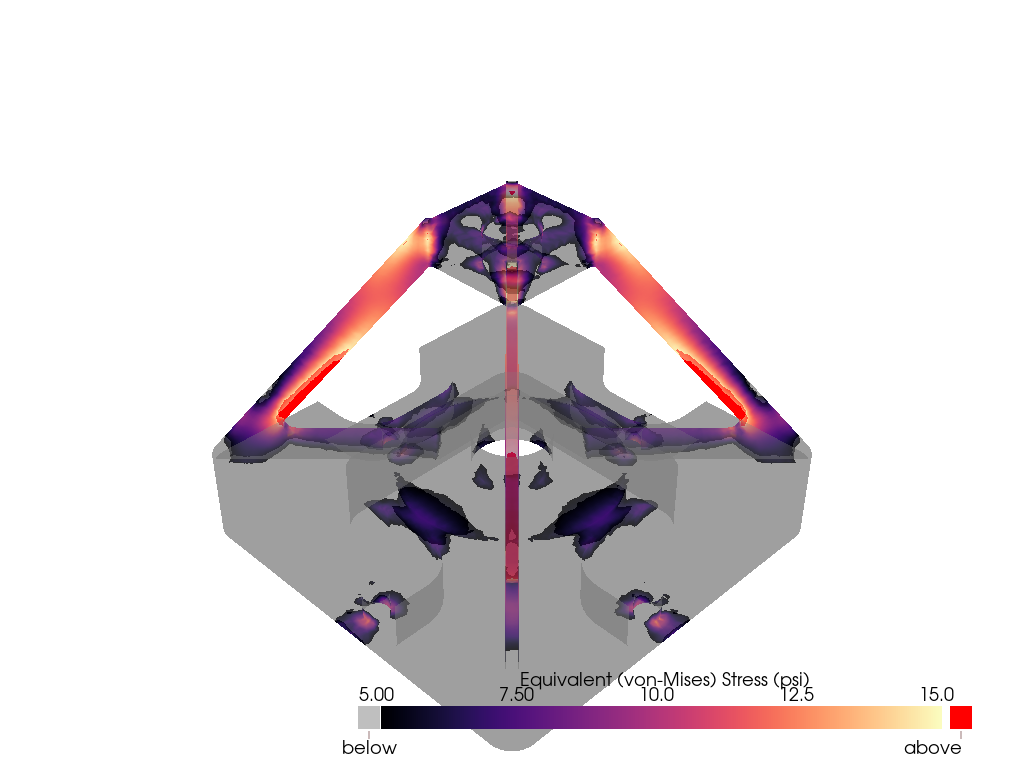
カスタムカラーマップでブラケットをプロットする#
ルックアップテーブルは, add_mesh で cmap= を指定して使用する際に設定することができます.
pl = pv.Plotter()
actor = pl.add_mesh(bracket, cmap=lut, lighting=False)
pl.show()
VTKのメソッドを使ってカスタムのルックアップテーブルを作成する#
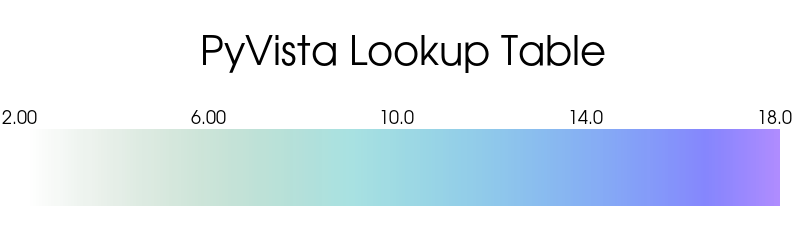
完全に独自のカラーマップを作成したい場合は, pyvista.LookupTable.hue_range や pyvista.LookupTable.value_range といった属性を使用して,独自のルックアップテーブルを作成することができます.
lut = pv.LookupTable()
lut.value_range = (0.35, 1)  # dark grey to white
lut.hue_range = (0.35, 0.7)  # green to cyna
lut.saturation_range = (0.75, 0.5)  # reduce saturation near the upper end
lut.alpha_range = (0.0, 0.9)  #
lut.scalar_range = (2, 18)
lut.plot()
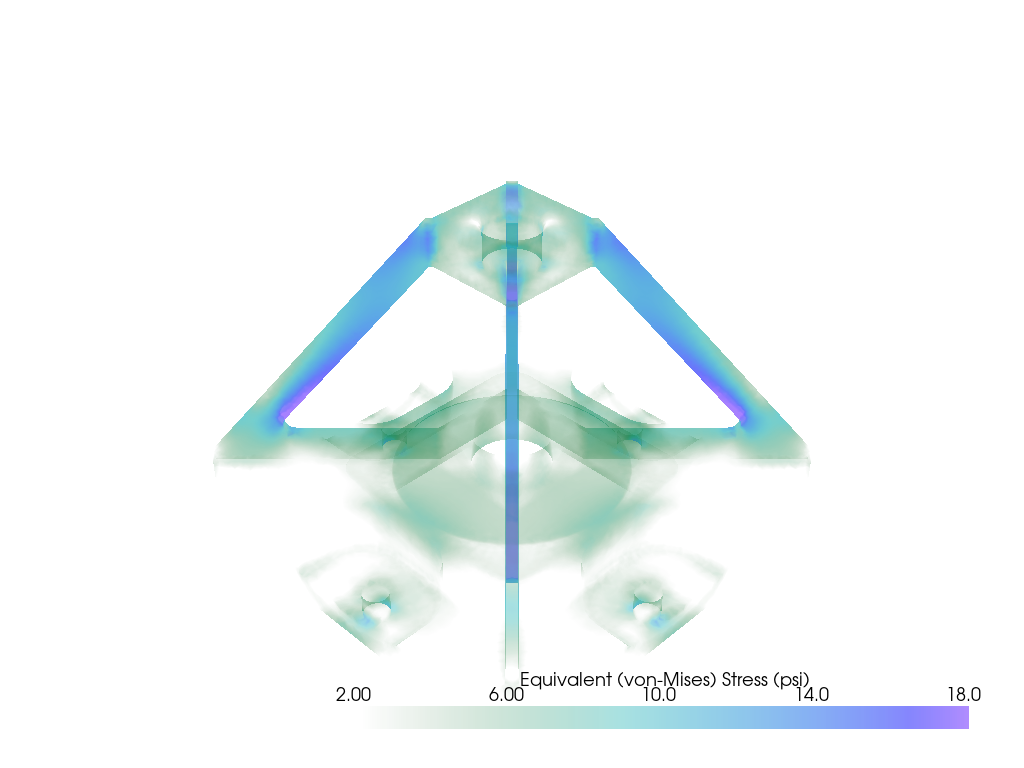
カスタムカラーマップでブラケットをプロットする#
このカスタムカラーマップをプロッターに割り当て,ライティングを無効にすることで,プロットを改善します.
pl = pv.Plotter()
actor = pl.add_mesh(bracket, cmap=lut, lighting=False)
pl.show()
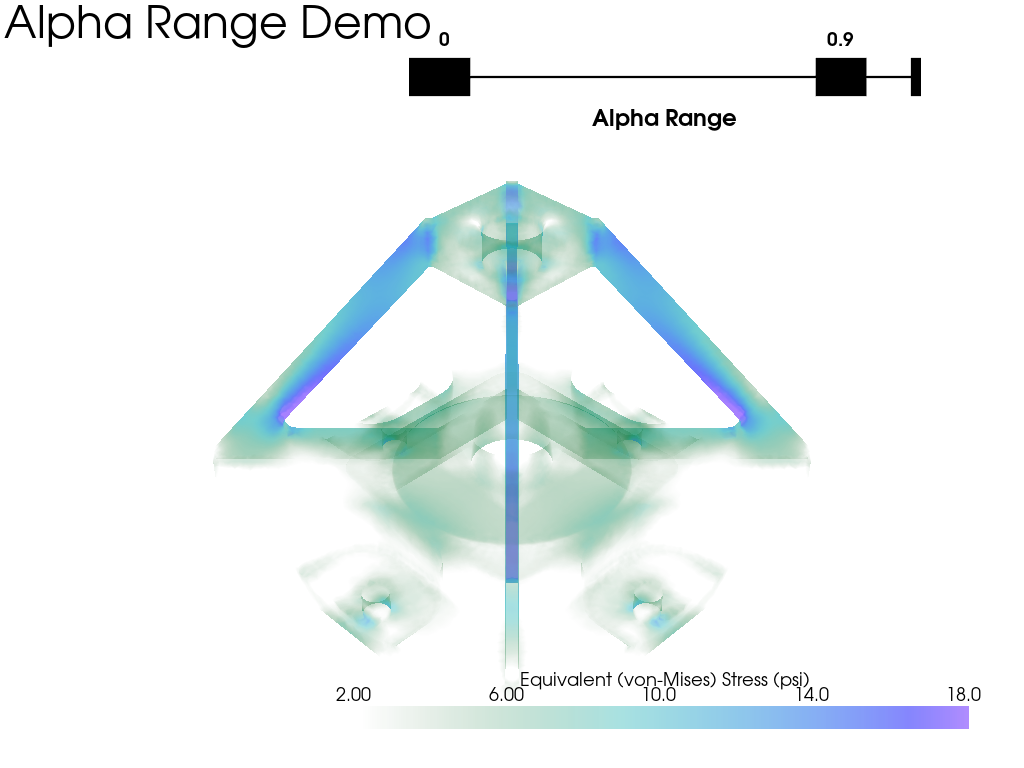
ウィジェットを使ったカスタムカラーマップ#
ここでは,スカラーをプロットし,ウィジェットによってルックアップテーブルを動的に変化させる.ダブルエンドのスライダーウィジェットをシミュレートするために,いくつかのオーバーラップするシングルスライダーウィジェットを作成する.
この例では,アルファチャンネルを制御するだけです.
pl = pv.Plotter()
actor = pl.add_mesh(bracket, cmap=lut, lighting=False)
pl.add_text('Alpha Range Demo')


def set_min_alpha(min_value):
    max_value = lut.alpha_range[1]
    if min_value > max_value:
        # force the movement of the maximum value
        max_value = min_value
        pl.slider_widgets[1].GetRepresentation().SetValue(max_value)
    lut.alpha_range = (min_value, max_value)


def set_max_alpha(max_value):
    min_value = lut.alpha_range[0]
    if max_value < min_value:
        # force the movement of the minimum value
        min_value = max_value
        pl.slider_widgets[0].GetRepresentation().SetValue(min_value)

    lut.alpha_range = (min_value, max_value)


# create two overlapping slider bars by hiding the tube of the second
pl.add_slider_widget(
    set_min_alpha,
    (0, 1),
    value=lut.alpha_range[0],
    interaction_event='always',
    title='Alpha Range',
    tube_width=0.003,
)
pl.add_slider_widget(
    set_max_alpha, (0, 1), value=lut.alpha_range[1], interaction_event='always', tube_width=0.0
)

pl.show()
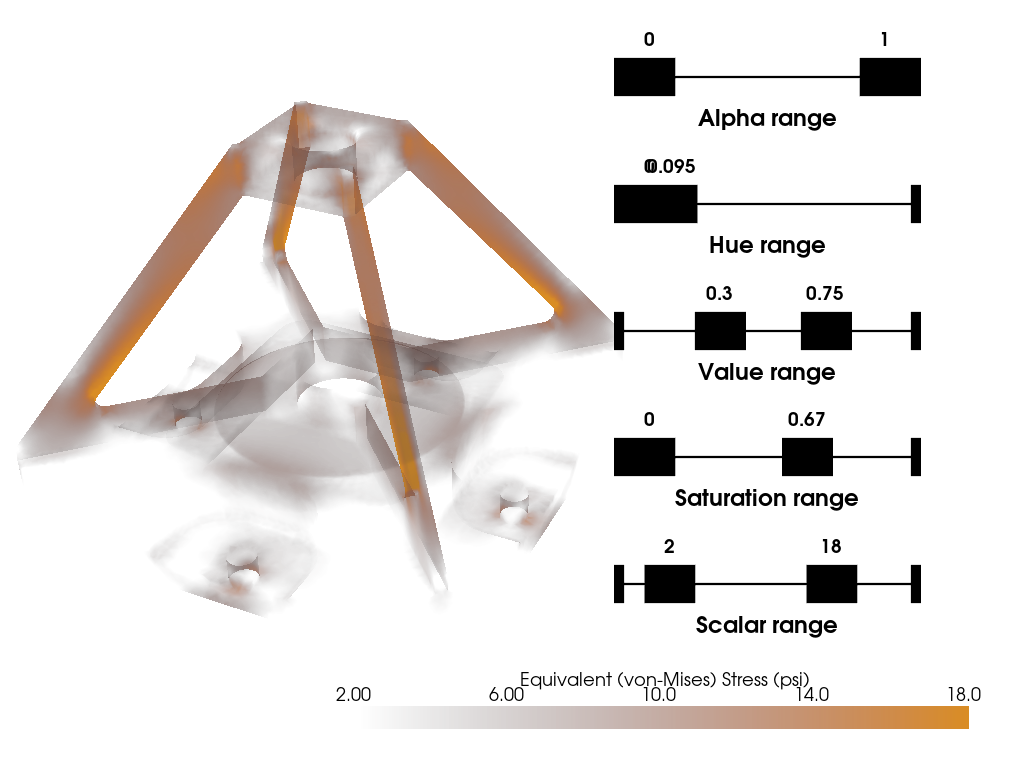
複数のルックアップテーブルの属性を制御する#
ルックアップテーブルコールバックを持ついくつかのスライダーバーウィジェットの使用をデモンストレートします.
# Create a new lookup table with oranges
lut = pv.LookupTable()
lut.value_range = (0.3, 0.75)
lut.hue_range = (0.0, 0.095)
lut.saturation_range = (0.0, 0.67)
lut.alpha_range = (0.0, 1.0)
lut.scalar_range = (2, 18)

scalars_rng = (bracket.active_scalars.min(), bracket.active_scalars.max())


def make_double_slider(attr, idx):
    """Create a double slider for a given lookup table attribute."""

    def set_min(min_value):
        max_value = getattr(lut, attr)[1]
        if min_value > max_value:
            # force the movement of the maximum value
            max_value = min_value
            pl.slider_widgets[idx * 2 + 1].GetRepresentation().SetValue(max_value)
        setattr(lut, attr, (min_value, max_value))

        if attr == 'scalar_range':
            actor.mapper.scalar_range = getattr(lut, attr)

    def set_max(max_value):
        min_value = getattr(lut, attr)[0]
        if max_value < min_value:
            # force the movement of the minimum value
            min_value = max_value
            pl.slider_widgets[idx * 2].GetRepresentation().SetValue(min_value)
        setattr(lut, attr, (min_value, max_value))

        if attr == 'scalar_range':
            actor.mapper.scalar_range = getattr(lut, attr)

    if attr == 'scalar_range':
        rng = scalars_rng
    else:
        rng = (0, 1)

    # create two overlapping slider bars by hiding the tube of the second
    pl.add_slider_widget(
        set_min,
        rng,
        value=getattr(lut, attr)[0],
        interaction_event='always',
        title=' '.join(attr.split('_')).capitalize(),
        tube_width=0.003,
        pointa=(0.6, 0.9 - 0.165 * idx),
        pointb=(0.9, 0.9 - 0.165 * idx),
    )
    pl.add_slider_widget(
        set_max,
        rng,
        value=getattr(lut, attr)[1],
        interaction_event='always',
        tube_width=0.0,
        pointa=(0.6, 0.9 - 0.165 * idx),
        pointb=(0.9, 0.9 - 0.165 * idx),
    )


pl = pv.Plotter()
actor = pl.add_mesh(bracket, cmap=lut, lighting=False)
make_double_slider('alpha_range', 0)
make_double_slider('hue_range', 1)
make_double_slider('value_range', 2)
make_double_slider('saturation_range', 3)
make_double_slider('scalar_range', 4)

pl.camera_position = [(9.021, 5.477, 7.780), (-0.679, 1.349, 0.874), (-0.498, -0.228, 0.836)]
cpos = pl.show(return_cpos=True)
Total running time of the script: (0 minutes 8.038 seconds)