注釈
Go to the end をクリックすると完全なサンプルコードをダウンロードできます.
点群を作成#
頂点のポイントクラウドとそれらのポイントのスカラー配列から pyvista.PolyData オブジェクトを作成します.
import numpy as np

import pyvista as pv
from pyvista import examples
点群は一般に pyvista.PolyData クラスで構成され,点群に関連付けられたスカラー/ベクトルデータ配列を簡単に持つことができます.この例では, examples モジュールから使用可能な点群を使用して,少し逆方向に作業します.ただし,これは独自の頂点位置のNumPy配列を使用してPyVistaメッシュを作成するのと同じです.
# Define some helpers - ignore these and use your own data.
def generate_points(subset=0.02):
    """A helper to make a 3D NumPy array of points (n_points by 3)"""
    dataset = examples.download_lidar()
    ids = np.random.randint(low=0, high=dataset.n_points - 1, size=int(dataset.n_points * subset))
    return dataset.points[ids]


points = generate_points()
# Print first 5 rows to prove its a numpy array (n_points by 3)
# Columns are (X Y Z)
points[0:5, :]
pyvista_ndarray([[4.80968575e+05, 4.40023460e+06, 1.76256006e+03],
                 [4.80931475e+05, 4.40016410e+06, 1.76156006e+03],
                 [4.81119075e+05, 4.40011890e+06, 1.75909998e+03],
                 [4.80932275e+05, 4.40007820e+06, 1.76485999e+03],
                 [4.80943275e+05, 4.40024680e+06, 1.76243994e+03]])
サンプルデータまたは独自のプロジェクトからポイント/頂点のNumPy配列を取得したので,これらのポイントのPyVistaメッシュを作成するのは簡単です.
point_cloud = pv.PolyData(points)
point_cloud
健全性のチェックもできます
np.allclose(points, point_cloud.points)
True
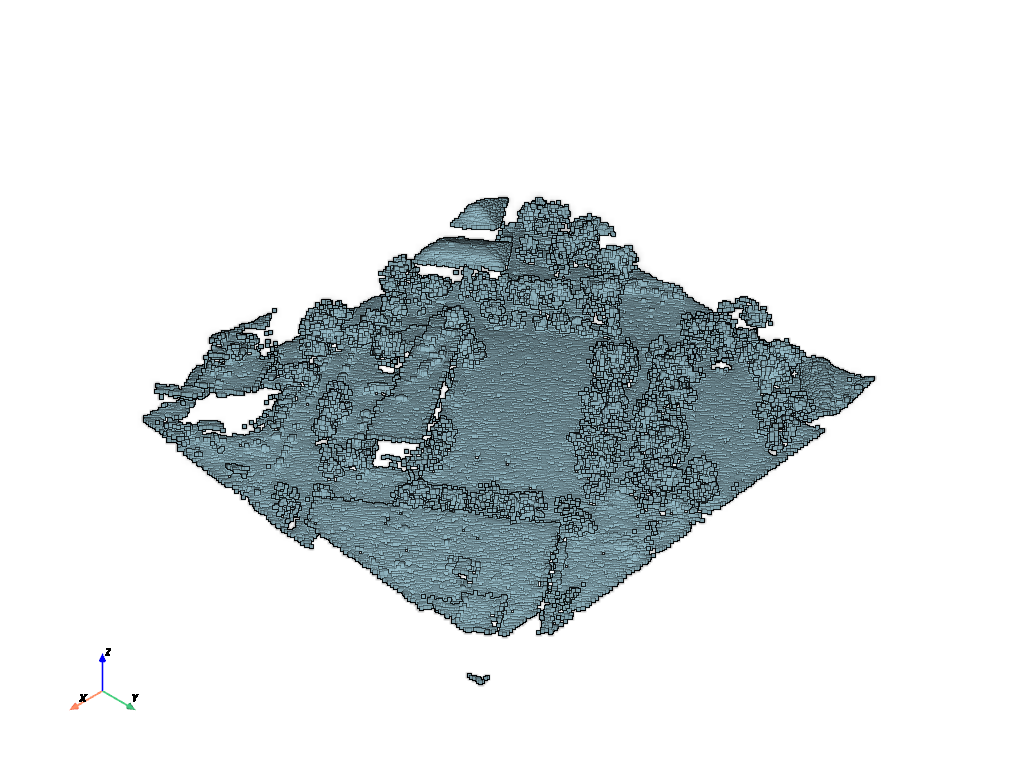
これでPyVistaメッシュができたので,プロットすることができます.ここでは,eye domeライティングを使用するオプションを追加します.これは,ポイントクラウド( Eye Dome Lighting についてもっと学ぶ)を使用して深さの認識を向上させるシェーディング技法です.
point_cloud.plot(eye_dome_lighting=True)
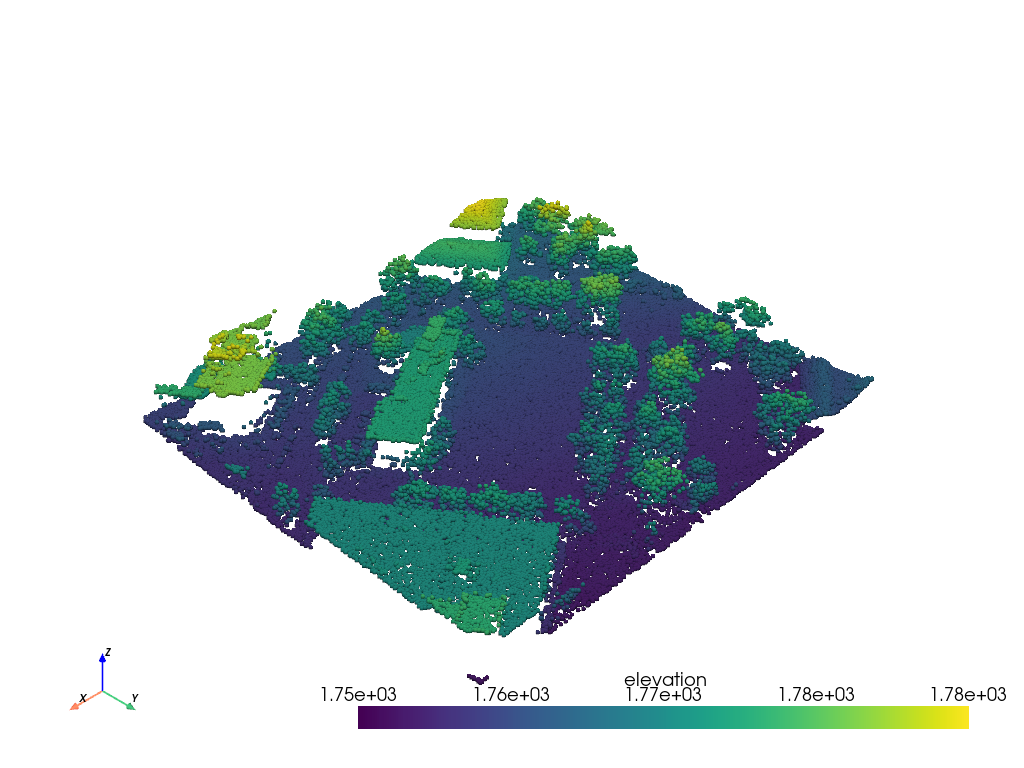
ここで,メッシュのすべてのノードに関連付けるデータアトリビュート(スカラー/ベクトル配列)があるとします.最初の軸に沿ったメッシュ内の点の数と同じ長さのNumPyデータ配列を簡単に追加できます.例えば,この新しい point_cloud メッシュにいくつかの配列を追加しましょう.
points配列と同じ長さのスカラー値の配列を作成します.この配列の各要素は,同じインデックスのポイントに対応します.
# Make data array using z-component of points array
data = points[:, -1]

# Add that data to the mesh with the name "uniform dist"
point_cloud["elevation"] = data
これで,ランダムデータを使用して点群をプロットできます.PyVistaは,デフォルトで追加したスカラー配列をプロットするのに十分な性能を持っています.ここでは,すべてのポイントを独自の球としてレンダリングするように指定します.
point_cloud.plot(render_points_as_spheres=True)
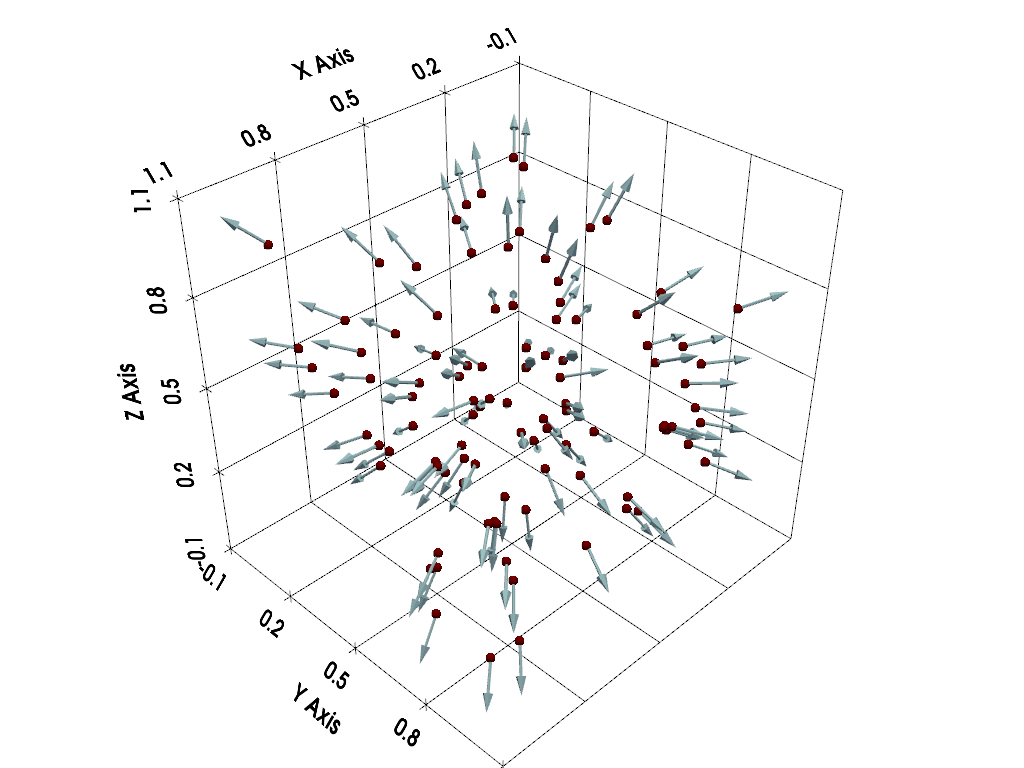
そのデータは退屈ですよね?複数のスカラー値を持つデータ配列,例えば3つの要素を持つベクトルを追加することもできます.ポイントクラウド内のすべてのノードのベクトルを計算し,それらのベクトルをメッシュに追加する簡単な関数を作成します.
そのデータは退屈ですよね?複数のスカラー値を持つデータ配列,例えば3つの要素を持つベクトルを追加することもできます.ポイントクラウド内のすべてのノードのベクトルを計算し,それらのベクトルをメッシュに追加する簡単な関数を作成します.
# Create random XYZ points
points = np.random.rand(100, 3)
# Make PolyData
point_cloud = pv.PolyData(points)


def compute_vectors(mesh):
    origin = mesh.center
    vectors = mesh.points - origin
    vectors = vectors / np.linalg.norm(vectors, axis=1)[:, None]
    return vectors


vectors = compute_vectors(point_cloud)
vectors[0:5, :]
pyvista_ndarray([[-0.40565022,  0.36091097, -0.83975661],
                 [ 0.95708234,  0.27917955, -0.07779569],
                 [-0.44157343,  0.39873383, -0.80375633],
                 [-0.86206906,  0.33508813,  0.3802011 ],
                 [ 0.97391492,  0.11525473, -0.19546374]])
point_cloud['vectors'] = vectors
今度は,グリフフィルター(詳細は 字形のプロット (ベクトルかPolyData) を参照)を使って,これらのベクトルを使って矢印を作ることができます.
arrows = point_cloud.glyph(
    orient='vectors',
    scale=False,
    factor=0.15,
)

# Display the arrows
plotter = pv.Plotter()
plotter.add_mesh(point_cloud, color='maroon', point_size=10.0, render_points_as_spheres=True)
plotter.add_mesh(arrows, color='lightblue')
# plotter.add_point_labels([point_cloud.center,], ['Center',],
#                          point_color='yellow', point_size=20)
plotter.show_grid()
plotter.show()
Total running time of the script: (0 minutes 6.099 seconds)