注釈
Go to the end をクリックすると完全なサンプルコードをダウンロードできます.
統合グリッドを作成#
値の3D NumPy配列から単純な均一グリッドを作成します.
import numpy as np

import pyvista as pv
各軸がXYZデカルト軸に対応する空間データを保持するデータ値の3 D NumPy配列を取ります.この例では,値の3 D NumPy配列をプロットできる3 Dグリッドの空間参照を保持する pyvista.ImageData オブジェクトを作成します.
空間的に参照されるデータの3 D NumPy配列を作成します.これは,グリッドが20×5×10 (nx × ny × nz)であるように空間的に参照さます
values = np.linspace(0, 10, 1000).reshape((20, 5, 10))
values.shape
# Create the spatial reference
grid = pv.ImageData()
# Set the grid dimensions: shape + 1 because we want to inject our values on
# the CELL data
grid.dimensions = np.array(values.shape) + 1
# Edit the spatial reference
grid.origin = (100, 33, 55.6) # The bottom left corner of the data set
grid.spacing = (1, 5, 2) # These are the cell sizes along each axis
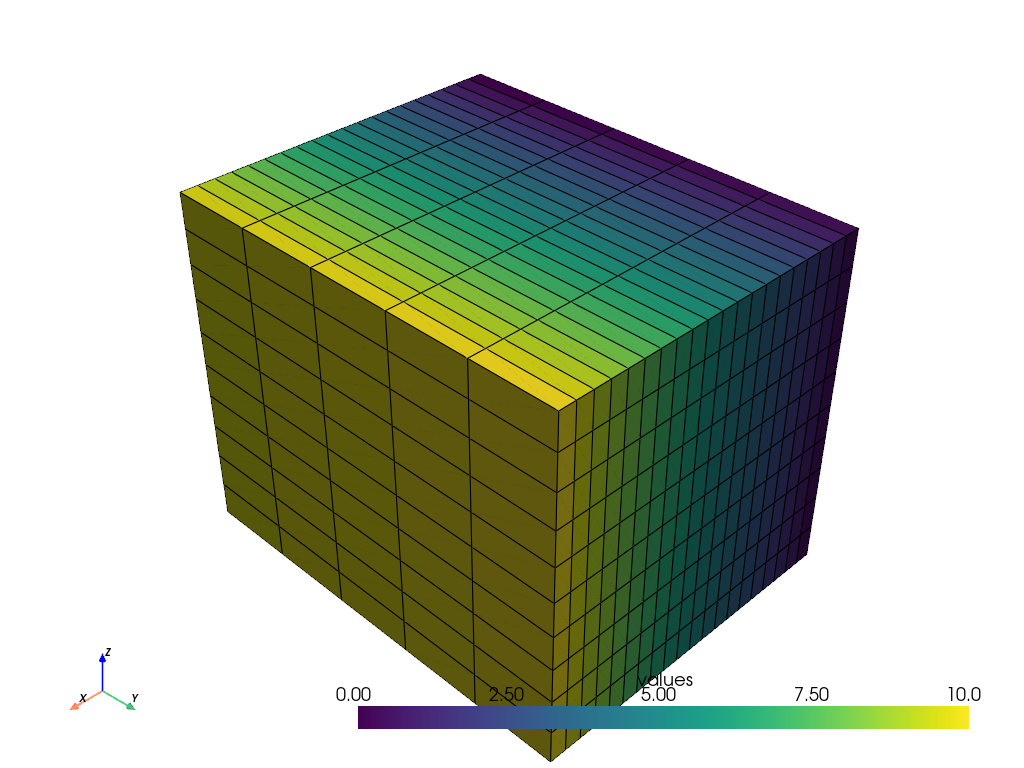
# Add the data values to the cell data
grid.cell_data["values"] = values.flatten(order="F") # Flatten the array
# Now plot the grid
grid.plot(show_edges=True)
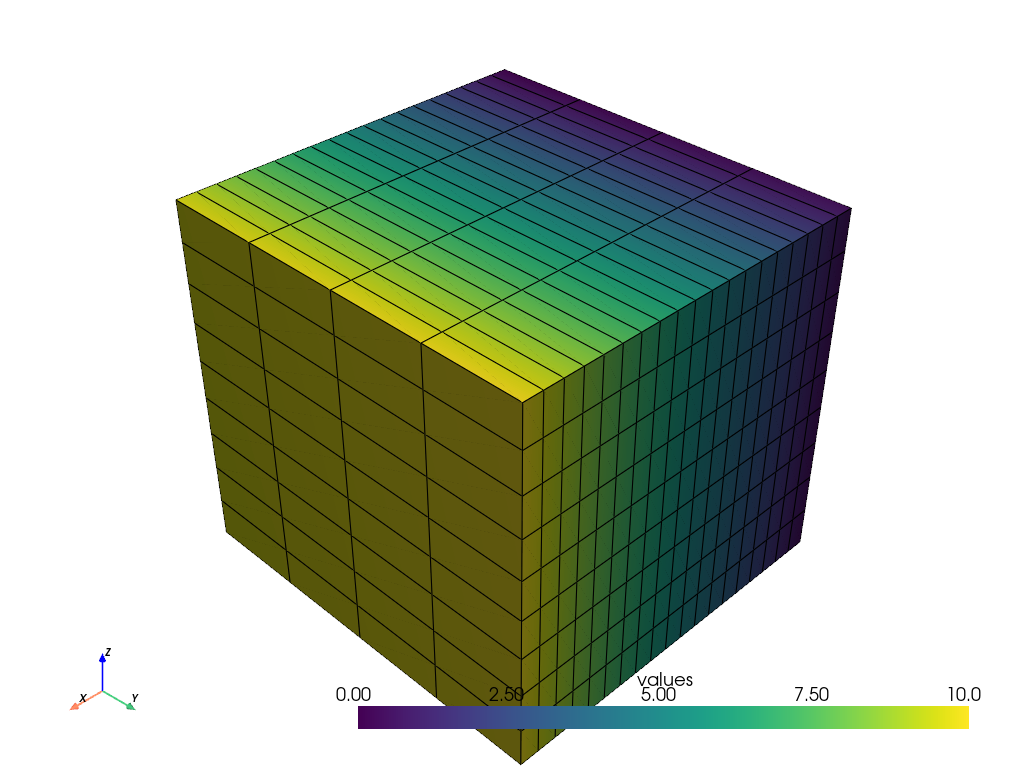
セルデータは好きではありませんか? pyvista.ImageData のポイントデータにNumPy配列を追加することもできます.初期化時にグリッドの寸法を設定する際には,微妙な違いに注意してください.
# Create the 3D NumPy array of spatially referenced data
# This is spatially referenced such that the grid is 20 by 5 by 10
#   (nx by ny by nz)
values = np.linspace(0, 10, 1000).reshape((20, 5, 10))
values.shape

# Create the spatial reference
grid = pv.ImageData()

# Set the grid dimensions: shape because we want to inject our values on the
#   POINT data
grid.dimensions = values.shape

# Edit the spatial reference
grid.origin = (100, 33, 55.6)  # The bottom left corner of the data set
grid.spacing = (1, 5, 2)  # These are the cell sizes along each axis

# Add the data values to the cell data
grid.point_data["values"] = values.flatten(order="F")  # Flatten the array

# Now plot the grid
grid.plot(show_edges=True)
Total running time of the script: (0 minutes 1.075 seconds)