注釈
Go to the end をクリックすると完全なサンプルコードをダウンロードできます.
線分から2 Dサーフェスをまとう#
サーフェス(2次元配列)を3 D空間の線分からまといます.
これはGPRや空中EMプロファイル(地球物理学的応用)のようなデータの2.5 D画像/断面メッシュを作成する一般的なタスクです.この例では,これらのユースケースの一般的なデータから2.5 D断面メッシュを作成する方法について説明します.
この例では,地表(線)に計測器のパスがあり,そのラインの下に収集されたイメージの2 D配列があります.
このサポートのイシュー で最初に掲載されました.
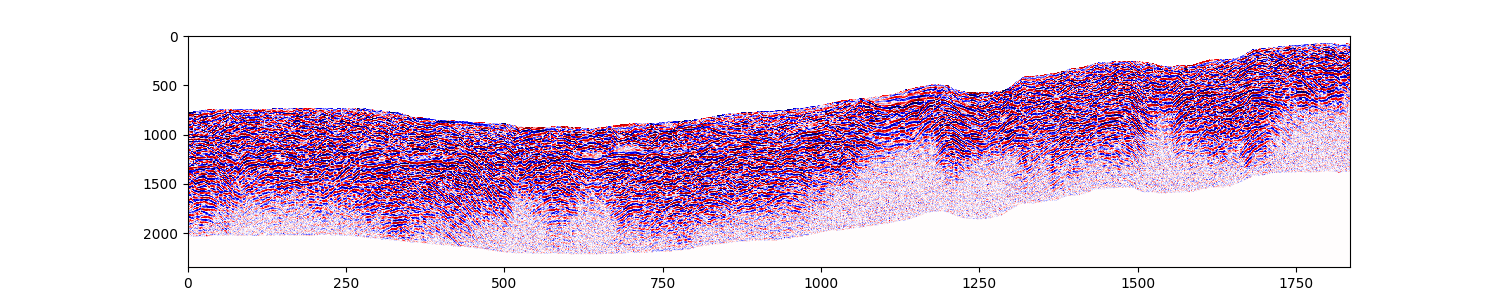
GPRデータ(深さ方向の値を持つデータの行を生成するものは何でもかまいません)があるとします.これらのデータを使用して,データ値の2 Dイメージ/配列と,その線分/プロファイルが3 D空間のどこにあるかの3 D座標を取得できます(地形の表面のデータを集めて).以下に,1) GPRパスのXYZ座標,2) GPRから生成されたデータ値の2 D配列の例を示します.
ここのデータは奇妙(質の高い共有可能なデータを入手するのは難しい)なので,無視して構造に注意してください.我々が持っている座標は技術的に上にシフトされ,我々は表面の上にいくつかのNaNフィラーがあります-それは奇妙で,それを無視します.通常は,2 D配列内の各柱の上端に関連付けられた座標を持つ,より均一に見える2 Dプロファイルが作成されます.
import matplotlib.pyplot as plt
import numpy as np

import pyvista as pv
from pyvista import examples

# Extract the data archive and load these files
# 2D array of XYZ coordinates
path = examples.download_gpr_path().points
# 2D array of the data values from the imaging equipment
data = examples.download_gpr_data_array()
plt.figure(figsize=(15, 3))
plt.pcolormesh(data, cmap="seismic", clim=[-1, 1])
plt.gca().invert_yaxis()
GPRプロファイルのパスをトップダウンの視点から表示します.完全な座標(XYとZ)があるため,これらの座標から下に構造化メッシュ "ドレーピング" を作成し,GPRイメージデータを保持できます.
plt.scatter(path[:, 1], path[:, 0])
plt.axis("image")
plt.xlabel("Northing")
plt.ylabel("Easting")
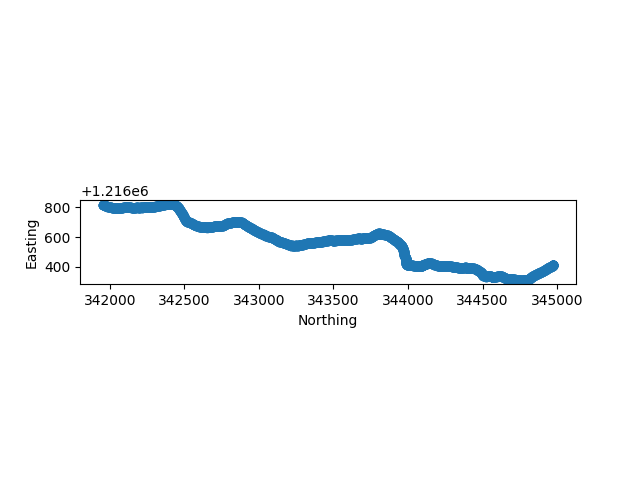
Text(38.347222222222214, 0.5, 'Easting')
assert len(path) in data.shape, "Make sure coordinates are present for every trace."
# If not, you'll need to interpolate the path

# Grab the number of samples (in Z dir) and number of traces/soundings
nsamples, ntraces = data.shape  # Might be opposite for your data, pay attention here

# Define the Z spacing of your 2D section
z_spacing = 0.12

# Create structured points draping down from the path
points = np.repeat(path, nsamples, axis=0)
# repeat the Z locations across
tp = np.arange(0, z_spacing * nsamples, z_spacing)
tp = path[:, 2][:, None] - tp
points[:, -1] = tp.ravel()
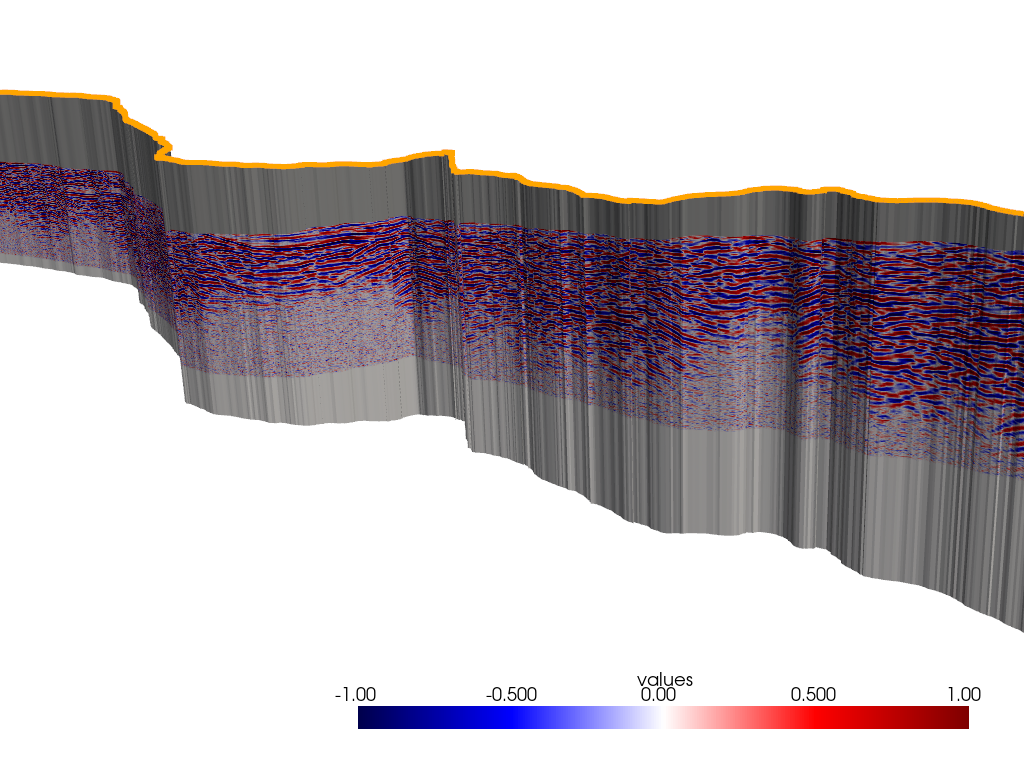
構造化された点からStructuredGridを作成する
これはPyVistaメッシュであり,PyVistaでは無限の可能性があるため,これでプロットでしたり,何かを処理したり,実行したりできます.
cpos = [
    (1217002.366883762, 345363.80666238244, 3816.828857791056),
    (1216322.4753436751, 344033.0310674846, 3331.052985309526),
    (-0.17716571330686096, -0.25634368781817973, 0.9502106207279767),
]

p = pv.Plotter()
p.add_mesh(grid, cmap="seismic", clim=[-1, 1])
p.add_mesh(pv.PolyData(path), color='orange')
p.show(cpos=cpos)
Total running time of the script: (0 minutes 41.441 seconds)