注釈
完全なサンプルコードをダウンロードしたり、Binderを使ってブラウザでこのサンプルを実行するには、 最後に進んでください 。
均一グリッドを作成#
値の3D NumPy配列から単純な均一グリッドを作成します.
import numpy as np
import pyvista as pv
各軸がXYZデカルト軸に対応する空間データを保持するデータ値の3 D NumPy配列を取ります.この例では,値の3 D NumPy配列をプロットできる3 Dグリッドの空間参照を保持する pyvista.ImageData を作成します.
空間的に参照されるデータの3 D NumPy配列を作成します.これは,グリッドが (20, 5, 10), (nx, ny, nz) であるように空間的に参照さます.
values = np.linspace(0, 10, 1000).reshape((20, 5, 10))
values.shape
(20, 5, 10)
ImageDataの作成
grid = pv.ImageData()
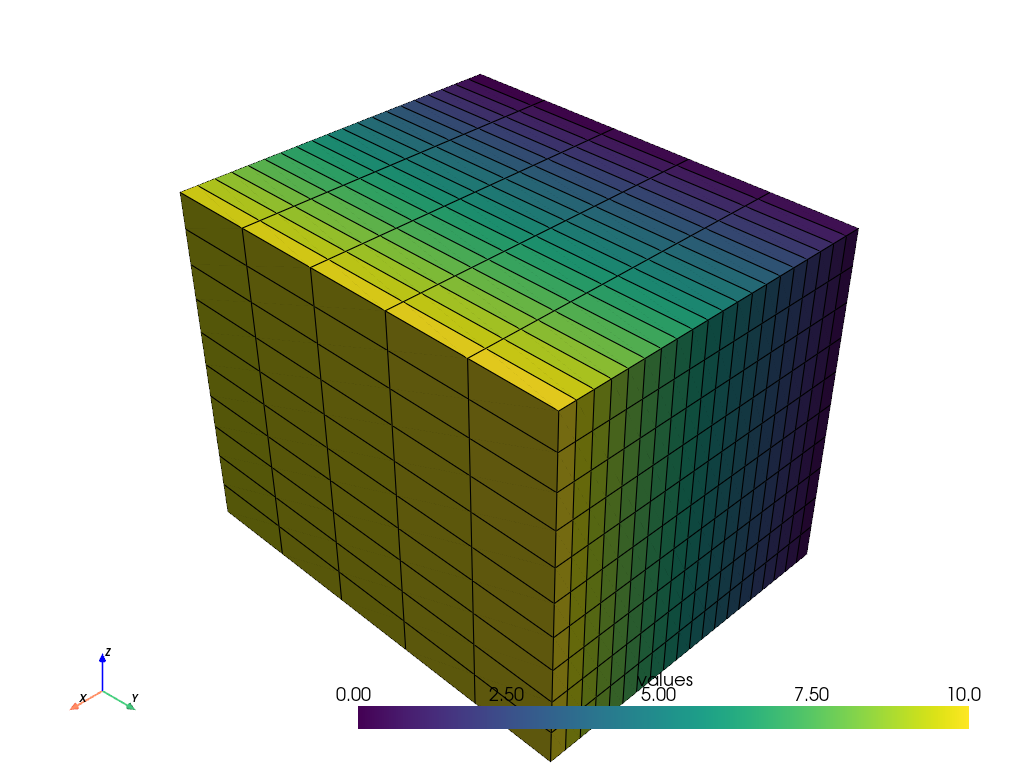
CELLデータに値を注入したいので,グリッドの寸法を shape + 1 に設定します.
grid.dimensions = np.array(values.shape) + 1
空間リファレンスを編集する
grid.origin = (100, 33, 55.6)  # The bottom left corner of the data set
grid.spacing = (1, 5, 2)  # These are the cell sizes along each axis
セルデータにデータを代入します. ImageData オブジェクトのデータは必ずFortranオーダリングを使用して平坦化します.
grid.cell_data["values"] = values.flatten(order="F")
grid
さて,グリッドをプロットしてみましょう!
grid.plot(show_edges=True)
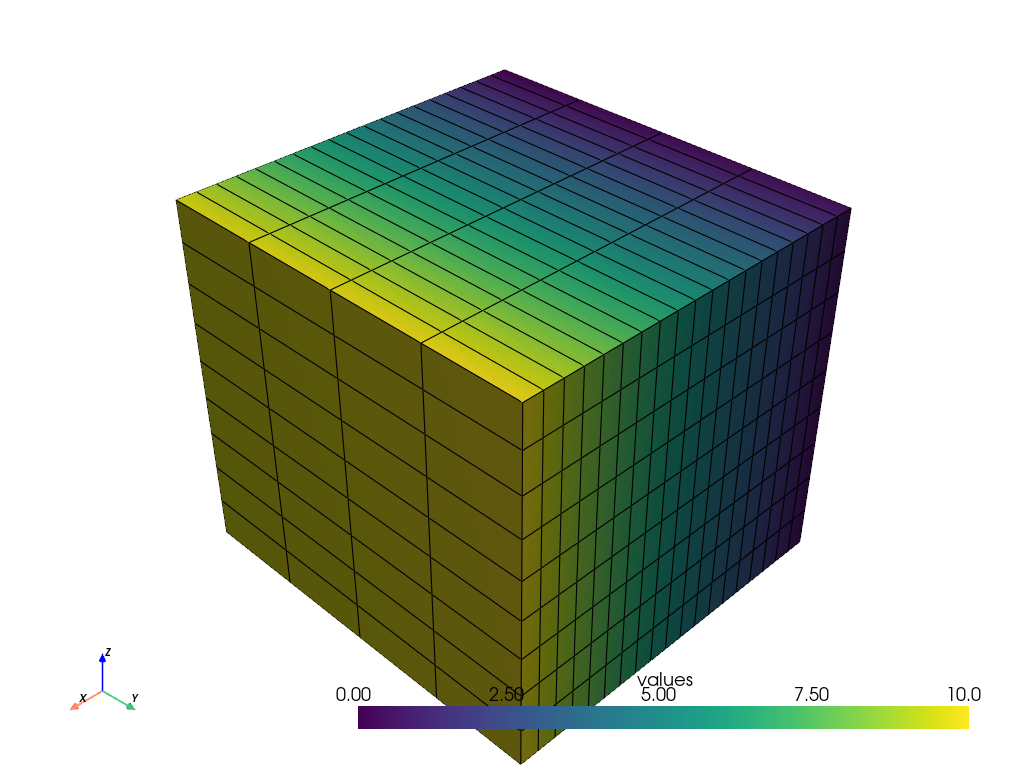
セルデータが嫌いですか?NumPyの配列を pyvista.ImageData の点データに追加することもできます.初期化時にグリッドの寸法を設定する際に,微妙な違いに注意してください.
# Create the 3D NumPy array of spatially referenced data again.
values = np.linspace(0, 10, 1000).reshape((20, 5, 10))
values.shape
(20, 5, 10)
PyVistaオブジェクトを作成し,上記と同じように属性を設定します.
grid = pv.ImageData()

# Set the grid dimensions to ``shape`` because we want to inject our values on
# the POINT data
grid.dimensions = values.shape

# Edit the spatial reference
grid.origin = (100, 33, 55.6)  # The bottom left corner of the data set
grid.spacing = (1, 5, 2)  # These are the cell sizes along each axis
セルデータにデータ値を追加する
grid.point_data["values"] = values.flatten(order="F")  # Flatten the array!
grid
さて,グリッドをプロットしてみましょう!
grid.plot(show_edges=True)
演習#
それでは,3D NumPyの配列から,あなた自身の pyvista.ImageData を作ってみましょう!
help(pv.ImageData)
Help on class ImageData in module pyvista.core.grid:
class ImageData(Grid, pyvista.core.filters.image_data.ImageDataFilters, vtkmodules.vtkCommonDataModel.vtkImageData)
| ImageData(*args, **kwargs) -> '_T'
|
| Models datasets with uniform spacing in the three coordinate directions.
|
| Can be initialized in one of several ways:
|
| - Create empty grid
| - Initialize from a :vtk:`vtkImageData` object
| - Initialize based on dimensions, cell spacing, and origin.
|
| .. versionchanged:: 0.33.0
| First argument must now be either a path or
| :vtk:`vtkImageData`. Use keyword arguments to specify the
| dimensions, spacing, and origin of the uniform grid.
|
| .. versionchanged:: 0.37.0
| The ``dims`` parameter has been renamed to ``dimensions``.
|
| Parameters
| ----------
| uinput : str | :vtk:`vtkImageData` | ImageData, optional
| Filename or dataset to initialize the uniform grid from. If
| set, remainder of arguments are ignored.
|
| dimensions : sequence[int], optional
| :attr:`dimensions` of the uniform grid.
|
| spacing : sequence[float], default: (1.0, 1.0, 1.0)
| :attr:`spacing` of the uniform grid in each dimension. Must be positive.
|
| origin : sequence[float], default: (0.0, 0.0, 0.0)
| :attr:`origin` of the uniform grid.
|
| deep : bool, default: False
| Whether to deep copy a :vtk:`vtkImageData` object. Keyword only.
|
| direction_matrix : RotationLike, optional
| The :attr:`direction_matrix` is a 3x3 matrix which controls the orientation of
| the image data.
|
| .. versionadded:: 0.45
|
| offset : int | VectorLike[int], default: (0, 0, 0)
| The offset defines the minimum :attr:`extent` of the image. Offset values
| can be positive or negative. In physical space, the offset is relative
| to the image's :attr:`origin`.
|
| .. versionadded:: 0.45
|
| See Also
| --------
| :ref:`create_uniform_grid_example`
|
| Examples
| --------
| Create an empty ImageData.
|
| >>> import pyvista as pv
| >>> grid = pv.ImageData()
|
| Initialize from a :vtk:`vtkImageData` object.
|
| >>> import vtk
| >>> vtkgrid = vtk.vtkImageData()
| >>> grid = pv.ImageData(vtkgrid)
|
| Initialize using just the grid dimensions and default
| spacing and origin. These must be keyword arguments.
|
| >>> grid = pv.ImageData(dimensions=(10, 10, 10))
|
| Initialize using dimensions and spacing.
|
| >>> grid = pv.ImageData(
| ... dimensions=(10, 10, 10),
| ... spacing=(2, 1, 5),
| ... )
|
| Initialize using dimensions, spacing, and an origin.
|
| >>> grid = pv.ImageData(
| ... dimensions=(10, 10, 10),
| ... spacing=(2, 1, 5),
| ... origin=(10, 35, 50),
| ... )
|
| Initialize from another ImageData.
|
| >>> grid = pv.ImageData(
| ... dimensions=(10, 10, 10),
| ... spacing=(2, 1, 5),
| ... origin=(10, 35, 50),
| ... )
| >>> grid_from_grid = pv.ImageData(grid)
| >>> grid_from_grid == grid
| True
|
| Method resolution order:
| ImageData
| Grid
| pyvista.core.dataset.DataSet
| pyvista.core.filters.image_data.ImageDataFilters
| pyvista.core.filters.data_set.DataSetFilters
| pyvista.core.utilities.misc._BoundsSizeMixin
| pyvista.core.filters.data_object.DataObjectFilters
| pyvista.core.dataobject.DataObject
| pyvista.core.utilities.misc._NoNewAttrMixin
| pyvista.core._vtk_core.DisableVtkSnakeCase
| pyvista.core._vtk_core.vtkPyVistaOverride
| vtkmodules.vtkCommonDataModel.vtkImageData
| vtkmodules.vtkCommonDataModel.vtkDataSet
| vtkmodules.vtkCommonDataModel.vtkDataObject
| vtkmodules.vtkCommonCore.vtkObject
| vtkmodules.vtkCommonCore.vtkObjectBase
| builtins.object
|
| Methods defined here:
|
| __getitem__(self, key: "tuple[str, Literal['cell', 'point', 'field']] | str | tuple[int, int, int]") -> 'ImageData | pyvista_ndarray'
| Search for a data array or slice with IJK indexing.
|
| __init__(self: 'Self', uinput: 'ImageData | str | Path | None' = None, dimensions: 'VectorLike[int] | None' = None, spacing: 'VectorLike[float]' = (1.0, 1.0, 1.0), origin: 'VectorLike[float]' = (0.0, 0.0, 0.0), deep: 'bool' = False, direction_matrix: 'RotationLike | None' = None, offset: 'int | VectorLike[int] | None' = None) -> 'None'
| Initialize the uniform grid.
|
| __repr__(self: 'Self') -> 'str'
| Return the default representation.
|
| __str__(self: 'Self') -> 'str'
| Return the default str representation.
|
| cast_to_rectilinear_grid(self: 'Self') -> 'RectilinearGrid'
| Cast this uniform grid to a rectilinear grid.
|
| Returns
| -------
| pyvista.RectilinearGrid
| This uniform grid as a rectilinear grid.
|
| cast_to_structured_grid(self: 'Self') -> 'StructuredGrid'
| Cast this uniform grid to a structured grid.
|
| Returns
| -------
| pyvista.StructuredGrid
| This grid as a structured grid.
|
| to_tetrahedra(self, tetra_per_cell: 'int' = 5, mixed: 'str | Sequence[int] | bool' = False, pass_cell_ids: 'bool' = True, pass_data: 'bool' = True, progress_bar: 'bool' = False) from pyvista.core.filters.rectilinear_grid.RectilinearGridFilters
| Create a tetrahedral mesh structured grid.
|
| Parameters
| ----------
| tetra_per_cell : int, default: 5
| The number of tetrahedrons to divide each cell into. Can be
| either ``5``, ``6``, or ``12``. If ``mixed=True``, this value is
| overridden.
|
| mixed : str, bool, sequence, default: False
| When set, subdivides some cells into 5 and some cells into 12. Set
| to ``True`` to use the active cell scalars of the
| :class:`pyvista.RectilinearGrid` to be either 5 or 12 to
| determining the number of tetrahedra to generate per cell.
|
| When a sequence, uses these values to subdivide the cells. When a
| string uses a cell array rather than the active array to determine
| the number of tetrahedra to generate per cell.
|
| pass_cell_ids : bool, default: True
| Set to ``True`` to make the tetrahedra have scalar data indicating
| which cell they came from in the original
| :class:`pyvista.RectilinearGrid`. The name of this array is
| ``'vtkOriginalCellIds'`` within the ``cell_data``.
|
| pass_data : bool, default: True
| Set to ``True`` to make the tetrahedra mesh have the cell data from
| the original :class:`pyvista.RectilinearGrid`. This uses
| ``pass_cell_ids=True`` internally. If ``True``, ``pass_cell_ids``
| will also be set to ``True``.
|
| progress_bar : bool, default: False
| Display a progress bar to indicate progress.
|
| Returns
| -------
| pyvista.UnstructuredGrid
| UnstructuredGrid containing the tetrahedral cells.
|
| Examples
| --------
| Divide a rectangular grid into tetrahedrons. Each cell contains by
| default 5 tetrahedrons.
|
| First, create and plot the grid.
|
| >>> import numpy as np
| >>> import pyvista as pv
| >>> xrng = np.linspace(0, 1, 2)
| >>> yrng = np.linspace(0, 1, 2)
| >>> zrng = np.linspace(0, 2, 3)
| >>> grid = pv.RectilinearGrid(xrng, yrng, zrng)
| >>> grid.plot()
|
| Now, generate the tetrahedra plot in the exploded view of the cell.
|
| >>> tet_grid = grid.to_tetrahedra()
| >>> tet_grid.explode(factor=0.5).plot(show_edges=True)
|
| Take the same grid but divide the first cell into 5 cells and the other
| cell into 12 tetrahedrons per cell.
|
| >>> tet_grid = grid.to_tetrahedra(mixed=[5, 12])
| >>> tet_grid.explode(factor=0.5).plot(show_edges=True)
|
| ----------------------------------------------------------------------
| Readonly properties defined here:
|
| x
| Return all the X points.
|
| Examples
| --------
| >>> import pyvista as pv
| >>> grid = pv.ImageData(dimensions=(2, 2, 2))
| >>> grid.x
| array([0., 1., 0., 1., 0., 1., 0., 1.])
|
| y
| Return all the Y points.
|
| Examples
| --------
| >>> import pyvista as pv
| >>> grid = pv.ImageData(dimensions=(2, 2, 2))
| >>> grid.y
| array([0., 0., 1., 1., 0., 0., 1., 1.])
|
| z
| Return all the Z points.
|
| Examples
| --------
| >>> import pyvista as pv
| >>> grid = pv.ImageData(dimensions=(2, 2, 2))
| >>> grid.z
| array([0., 0., 0., 0., 1., 1., 1., 1.])
|
| ----------------------------------------------------------------------
| Data descriptors defined here:
|
| direction_matrix
| Set or get the direction matrix.
|
| The direction matrix is a 3x3 matrix which controls the orientation of the
| image data.
|
| .. versionadded:: 0.45
|
| Returns
| -------
| np.ndarray
| Direction matrix as a 3x3 NumPy array.
|
| extent
| Return or set the extent of the ImageData.
|
| The extent is simply the first and last indices for each of the three axes.
| It encodes information about the image's :attr:`offset` and :attr:`dimensions`.
|
| Examples
| --------
| Create a ``ImageData`` and show its extent.
|
| >>> import pyvista as pv
| >>> grid = pv.ImageData(dimensions=(10, 10, 10))
| >>> grid.extent
| (0, 9, 0, 9, 0, 9)
|
| >>> grid.extent = (2, 5, 2, 5, 2, 5)
| >>> grid.extent
| (2, 5, 2, 5, 2, 5)
|
| Note how this also modifies the grid's :attr:`offset`, :attr:`dimensions`,
| and :attr:`bounds`. Since we use default spacing of 1 here, the bounds
| match the extent exactly.
|
| >>> grid.offset
| (2, 2, 2)
|
| >>> grid.dimensions
| (4, 4, 4)
|
| >>> grid.bounds
| BoundsTuple(x_min = 2.0,
| x_max = 5.0,
| y_min = 2.0,
| y_max = 5.0,
| z_min = 2.0,
| z_max = 5.0)
|
| index_to_physical_matrix
| Return or set 4x4 matrix to transform index space (ijk) to physical space (xyz).
|
| .. note::
| Setting this property modifies the object's :class:`~pyvista.ImageData.origin`,
| :class:`~pyvista.ImageData.spacing`, and :class:`~pyvista.ImageData.direction_matrix`
| properties.
|
| .. versionadded:: 0.45
|
| Returns
| -------
| np.ndarray
| 4x4 transformation matrix.
|
| offset
| Return or set the index offset of the ImageData.
|
| The offset is simply the first indices for each of the three axes
| and defines the minimum :attr:`extent` of the image. Offset values
| can be positive or negative. In physical space, the offset is relative
| to the image's :attr:`origin`.
|
| .. versionadded:: 0.45
|
| Examples
| --------
| Create a ``ImageData`` and show that the offset is zeros by default.
|
| >>> import pyvista as pv
| >>> grid = pv.ImageData(dimensions=(10, 10, 10))
| >>> grid.offset
| (0, 0, 0)
|
| The offset defines the minimum extent.
|
| >>> grid.extent
| (0, 9, 0, 9, 0, 9)
|
| Set the offset to a new value for all axes.
|
| >>> grid.offset = 2
| >>> grid.offset
| (2, 2, 2)
|
| Show the extent again. Note how all values have increased by the offset value.
|
| >>> grid.extent
| (2, 11, 2, 11, 2, 11)
|
| Set the offset for each axis separately and show the extent again.
|
| >>> grid.offset = (-1, -2, -3)
| >>> grid.extent
| (-1, 8, -2, 7, -3, 6)
|
| origin
| Return the origin of the grid (bottom southwest corner).
|
| Examples
| --------
| >>> import pyvista as pv
| >>> grid = pv.ImageData(dimensions=(5, 5, 5))
| >>> grid.origin
| (0.0, 0.0, 0.0)
|
| Show how the origin is in the bottom "southwest" corner of the
| ImageData.
|
| >>> pl = pv.Plotter()
| >>> _ = pl.add_mesh(grid, show_edges=True)
| >>> _ = pl.add_axes_at_origin(ylabel=None)
| >>> pl.camera_position = 'xz'
| >>> pl.show()
|
| Set the origin to ``(1, 1, 1)`` and show how this shifts the
| ImageData.
|
| >>> grid.origin = (1, 1, 1)
| >>> pl = pv.Plotter()
| >>> _ = pl.add_mesh(grid, show_edges=True)
| >>> _ = pl.add_axes_at_origin(ylabel=None)
| >>> pl.camera_position = 'xz'
| >>> pl.show()
|
| physical_to_index_matrix
| Return or set 4x4 matrix to transform from physical space (xyz) to index space (ijk).
|
| .. note::
| Setting this property modifies the object's :class:`~pyvista.ImageData.origin`,
| :class:`~pyvista.ImageData.spacing`, and :class:`~pyvista.ImageData.direction_matrix`
| properties.
|
| .. versionadded:: 0.45
|
| Returns
| -------
| np.ndarray
| 4x4 transformation matrix.
|
| points
| Build a copy of the implicitly defined points as a numpy array.
|
| Returns
| -------
| numpy.ndarray
| Array of points representing the image data.
|
| Notes
| -----
| The ``points`` for a :class:`pyvista.ImageData` cannot be set.
|
| Examples
| --------
| >>> import pyvista as pv
| >>> grid = pv.ImageData(dimensions=(2, 2, 2))
| >>> grid.points
| array([[0., 0., 0.],
| [1., 0., 0.],
| [0., 1., 0.],
| [1., 1., 0.],
| [0., 0., 1.],
| [1., 0., 1.],
| [0., 1., 1.],
| [1., 1., 1.]])
|
| spacing
| Return or set the spacing for each axial direction.
|
| Notes
| -----
| Spacing must be non-negative. While VTK accepts negative
| spacing, this results in unexpected behavior. See:
| https://github.com/pyvista/pyvista/issues/1967
|
| Examples
| --------
| Create a 5 x 5 x 5 uniform grid.
|
| >>> import pyvista as pv
| >>> grid = pv.ImageData(dimensions=(5, 5, 5))
| >>> grid.spacing
| (1.0, 1.0, 1.0)
| >>> grid.plot(show_edges=True)
|
| Modify the spacing to ``(1, 2, 3)``
|
| >>> grid.spacing = (1, 2, 3)
| >>> grid.plot(show_edges=True)
|
| ----------------------------------------------------------------------
| Data and other attributes defined here:
|
| __abstractmethods__ = frozenset()
|
| __annotations__ = {'_WRITERS': 'ClassVar[dict[str, type[_vtk.vtkDataSe...
|
| ----------------------------------------------------------------------
| Methods inherited from Grid:
|
| __new__(cls, *args, **kwargs) from pyvista.core.utilities.misc.abstract_class.<locals>
|
| ----------------------------------------------------------------------
| Readonly properties inherited from Grid:
|
| dimensionality
| Return the dimensionality of the grid.
|
| Returns
| -------
| int
| The grid dimensionality.
|
| Examples
| --------
| Get the dimensionality of a 2D uniform grid.
|
| >>> import pyvista as pv
| >>> grid = pv.ImageData(dimensions=(1, 2, 3))
| >>> grid.dimensionality
| 2
|
| Get the dimensionality of a 3D uniform grid.
|
| >>> grid = pv.ImageData(dimensions=(2, 3, 4))
| >>> grid.dimensionality
| 3
|
| ----------------------------------------------------------------------
| Data descriptors inherited from Grid:
|
| dimensions
| Return the grid's dimensions.
|
| These are effectively the number of points along each of the
| three dataset axes.
|
| Returns
| -------
| tuple[int]
| Dimensions of the grid.
|
| Examples
| --------
| Create a uniform grid with dimensions ``(1, 2, 3)``.
|
| >>> import pyvista as pv
| >>> grid = pv.ImageData(dimensions=(2, 3, 4))
| >>> grid.dimensions
| (2, 3, 4)
| >>> grid.plot(show_edges=True)
|
| Set the dimensions to ``(3, 4, 5)``
|
| >>> grid.dimensions = (3, 4, 5)
| >>> grid.plot(show_edges=True)
|
| ----------------------------------------------------------------------
| Methods inherited from pyvista.core.dataset.DataSet:
|
| __getattr__(self: 'Self', item: 'str') -> 'Any'
| Get attribute from base class if not found.
|
| __setitem__(self: 'Self', name: 'str', scalars: 'NumpyArray[float] | Sequence[float] | float') -> 'None'
| Add/set an array in the point_data, or cell_data accordingly.
|
| It depends on the array's length, or specified mode.
|
| cast_to_pointset(self: 'Self', pass_cell_data: 'bool' = False) -> 'pyvista.PointSet'
| Extract the points of this dataset and return a :class:`pyvista.PointSet`.
|
| Parameters
| ----------
| pass_cell_data : bool, default: False
| Run the :func:`cell_data_to_point_data()
| <pyvista.DataObjectFilters.cell_data_to_point_data>` filter and pass
| cell data fields to the new pointset.
|
| Returns
| -------
| pyvista.PointSet
| Dataset cast into a :class:`pyvista.PointSet`.
|
| Notes
| -----
| This will produce a deep copy of the points and point/cell data of
| the original mesh.
|
| See Also
| --------
| :ref:`create_pointset_example`
|
| Examples
| --------
| >>> import pyvista as pv
| >>> mesh = pv.Wavelet()
| >>> pointset = mesh.cast_to_pointset()
| >>> type(pointset)
| <class 'pyvista.core.pointset.PointSet'>
|
| cast_to_poly_points(self: 'Self', pass_cell_data: 'bool' = False) -> 'pyvista.PolyData'
| Extract the points of this dataset and return a :class:`pyvista.PolyData`.
|
| Parameters
| ----------
| pass_cell_data : bool, default: False
| Run the :func:`cell_data_to_point_data()
| <pyvista.DataObjectFilters.cell_data_to_point_data>` filter and pass
| cell data fields to the new pointset.
|
| Returns
| -------
| pyvista.PolyData
| Dataset cast into a :class:`pyvista.PolyData`.
|
| Notes
| -----
| This will produce a deep copy of the points and point/cell data of
| the original mesh.
|
| Examples
| --------
| >>> from pyvista import examples
| >>> mesh = examples.load_uniform()
| >>> points = mesh.cast_to_poly_points(pass_cell_data=True)
| >>> type(points)
| <class 'pyvista.core.pointset.PolyData'>
| >>> points.n_arrays
| 2
| >>> points.point_data
| pyvista DataSetAttributes
| Association : POINT
| Active Scalars : Spatial Point Data
| Active Vectors : None
| Active Texture : None
| Active Normals : None
| Contains arrays :
| Spatial Point Data float64 (1000,) SCALARS
| >>> points.cell_data
| pyvista DataSetAttributes
| Association : CELL
| Active Scalars : None
| Active Vectors : None
| Active Texture : None
| Active Normals : None
| Contains arrays :
| Spatial Cell Data float64 (1000,)
|
| cast_to_unstructured_grid(self: 'Self') -> 'pyvista.UnstructuredGrid'
| Get a new representation of this object as a :class:`pyvista.UnstructuredGrid`.
|
| Returns
| -------
| pyvista.UnstructuredGrid
| Dataset cast into a :class:`pyvista.UnstructuredGrid`.
|
| Examples
| --------
| Cast a :class:`pyvista.PolyData` to a
| :class:`pyvista.UnstructuredGrid`.
|
| >>> import pyvista as pv
| >>> mesh = pv.Sphere()
| >>> type(mesh)
| <class 'pyvista.core.pointset.PolyData'>
| >>> grid = mesh.cast_to_unstructured_grid()
| >>> type(grid)
| <class 'pyvista.core.pointset.UnstructuredGrid'>
|
| cell_neighbors(self: 'Self', ind: 'int', connections: 'str' = 'points') -> 'list[int]'
| Get the cell neighbors of the ind-th cell.
|
| Concrete implementation of :vtk:`vtkDataSet.GetCellNeighbors`.
|
| Parameters
| ----------
| ind : int
| Cell ID.
|
| connections : str, default: "points"
| Describe how the neighbor cell(s) must be connected to the current
| cell to be considered as a neighbor.
| Can be either ``'points'``, ``'edges'`` or ``'faces'``.
|
| Returns
| -------
| list[int]
| List of neighbor cells IDs for the ind-th cell.
|
| Warnings
| --------
| For a :class:`pyvista.ExplicitStructuredGrid`, use
| :func:`pyvista.ExplicitStructuredGrid.neighbors`.
|
| See Also
| --------
| pyvista.DataSet.cell_neighbors_levels
|
| Examples
| --------
| >>> from pyvista import examples
| >>> mesh = examples.load_airplane()
|
| Get the neighbor cell ids that have at least one point in common with
| the 0-th cell.
|
| >>> mesh.cell_neighbors(0, 'points')
| [1, 2, 3, 388, 389, 11, 12, 395, 14, 209, 211, 212]
|
| Get the neighbor cell ids that have at least one edge in common with
| the 0-th cell.
|
| >>> mesh.cell_neighbors(0, 'edges')
| [1, 3, 12]
|
| For unstructured grids with cells of dimension 3 (Tetrahedron for example),
| cell neighbors can be defined using faces.
|
| >>> mesh = examples.download_tetrahedron()
| >>> mesh.cell_neighbors(0, 'faces')
| [1, 5, 7]
|
| Show a visual example.
|
| >>> from functools import partial
| >>> import pyvista as pv
| >>> mesh = pv.Sphere(theta_resolution=10)
| >>>
| >>> pl = pv.Plotter(shape=(1, 2))
| >>> pl.link_views()
| >>> add_point_labels = partial(
| ... pl.add_point_labels,
| ... text_color='white',
| ... font_size=20,
| ... shape=None,
| ... show_points=False,
| ... )
| >>>
| >>> for i, connection in enumerate(['points', 'edges']):
| ... pl.subplot(0, i)
| ... pl.view_xy()
| ... _ = pl.add_title(
| ... f'{connection.capitalize()} neighbors',
| ... color='red',
| ... shadow=True,
| ... font_size=8,
| ... )
| ...
| ... # Add current cell
| ... i_cell = 0
| ... current_cell = mesh.extract_cells(i_cell)
| ... _ = pl.add_mesh(current_cell, show_edges=True, color='blue')
| ... _ = add_point_labels(
| ... current_cell.cell_centers().points,
| ... labels=[f'{i_cell}'],
| ... )
| ...
| ... # Add neighbors
| ... ids = mesh.cell_neighbors(i_cell, connection)
| ... cells = mesh.extract_cells(ids)
| ... _ = pl.add_mesh(cells, color='red', show_edges=True)
| ... _ = add_point_labels(
| ... cells.cell_centers().points,
| ... labels=[f'{i}' for i in ids],
| ... )
| ...
| ... # Add other cells
| ... ids.append(i_cell)
| ... others = mesh.extract_cells(ids, invert=True)
| ... _ = pl.add_mesh(others, show_edges=True)
| >>> pl.show()
|
| cell_neighbors_levels(self: 'Self', ind: 'int', connections: 'str' = 'points', n_levels: 'int' = 1) -> 'Generator[list[int], None, None]'
| Get consecutive levels of cell neighbors.
|
| Parameters
| ----------
| ind : int
| Cell ID.
|
| connections : str, default: "points"
| Describe how the neighbor cell(s) must be connected to the current
| cell to be considered as a neighbor.
| Can be either ``'points'``, ``'edges'`` or ``'faces'``.
|
| n_levels : int, default: 1
| Number of levels to search for cell neighbors.
| When equal to 1, it is equivalent to :func:`pyvista.DataSet.cell_neighbors`.
|
| Returns
| -------
| generator[list[int]]
| A generator of list of cell IDs for each level.
|
| Warnings
| --------
| For a :class:`pyvista.ExplicitStructuredGrid`, use
| :func:`pyvista.ExplicitStructuredGrid.neighbors`.
|
| See Also
| --------
| pyvista.DataSet.cell_neighbors
|
| Examples
| --------
| Get the cell neighbors IDs starting from the 0-th cell
| up until the third level.
|
| >>> import pyvista as pv
| >>> mesh = pv.Sphere(theta_resolution=10)
| >>> nbr_levels = mesh.cell_neighbors_levels(0, connections='edges', n_levels=3)
| >>> nbr_levels = list(nbr_levels)
| >>> nbr_levels[0]
| [1, 21, 9]
| >>> nbr_levels[1]
| [2, 8, 74, 75, 20, 507]
| >>> nbr_levels[2]
| [128, 129, 3, 453, 7, 77, 23, 506]
|
| Visualize these cells IDs.
|
| >>> from functools import partial
| >>> pv.global_theme.color_cycler = [
| ... 'red',
| ... 'green',
| ... 'blue',
| ... 'purple',
| ... ]
| >>> pl = pv.Plotter()
| >>>
| >>> # Define partial function to add point labels
| >>> add_point_labels = partial(
| ... pl.add_point_labels,
| ... text_color='white',
| ... font_size=40,
| ... shape=None,
| ... show_points=False,
| ... )
| >>>
| >>> # Add the 0-th cell to the plotter
| >>> cell = mesh.extract_cells(0)
| >>> _ = pl.add_mesh(cell, show_edges=True)
| >>> _ = add_point_labels(cell.cell_centers().points, labels=['0'])
| >>> other_ids = [0]
| >>>
| >>> # Add the neighbors to the plot
| >>> neighbors = mesh.cell_neighbors_levels(0, connections='edges', n_levels=3)
| >>> for i, ids in enumerate(neighbors, start=1):
| ... cells = mesh.extract_cells(ids)
| ... _ = pl.add_mesh(cells, show_edges=True)
| ... _ = add_point_labels(
| ... cells.cell_centers().points, labels=[f'{i}'] * len(ids)
| ... )
| ... other_ids.extend(ids)
| >>>
| >>> # Add the cell IDs that are not neighbors (ie. the rest of the sphere)
| >>> cells = mesh.extract_cells(other_ids, invert=True)
| >>> _ = pl.add_mesh(cells, color='white', show_edges=True)
| >>>
| >>> pl.view_xy()
| >>> pl.camera.zoom(6.0)
| >>> pl.show()
|
| clear_cell_data(self: 'Self') -> 'None'
| Remove all cell arrays.
|
| clear_data(self: 'Self') -> 'None'
| Remove all arrays from point/cell/field data.
|
| Examples
| --------
| Clear all arrays from a mesh.
|
| >>> import pyvista as pv
| >>> import numpy as np
| >>> mesh = pv.Sphere()
| >>> mesh.point_data.keys()
| ['Normals']
| >>> mesh.clear_data()
| >>> mesh.point_data.keys()
| []
|
| clear_point_data(self: 'Self') -> 'None'
| Remove all point arrays.
|
| Examples
| --------
| Clear all point arrays from a mesh.
|
| >>> import pyvista as pv
| >>> import numpy as np
| >>> mesh = pv.Sphere()
| >>> mesh.point_data.keys()
| ['Normals']
| >>> mesh.clear_point_data()
| >>> mesh.point_data.keys()
| []
|
| copy_from(self: 'Self', mesh: '_vtk.vtkDataSet', deep: 'bool' = True) -> 'None'
| Overwrite this dataset inplace with the new dataset's geometries and data.
|
| Parameters
| ----------
| mesh : :vtk:`vtkDataSet`
| The overwriting mesh.
|
| deep : bool, default: True
| Whether to perform a deep or shallow copy.
|
| Examples
| --------
| Create two meshes and overwrite ``mesh_a`` with ``mesh_b``.
| Show that ``mesh_a`` is equal to ``mesh_b``.
|
| >>> import pyvista as pv
| >>> mesh_a = pv.Sphere()
| >>> mesh_b = pv.Cube()
| >>> mesh_a.copy_from(mesh_b)
| >>> mesh_a == mesh_b
| True
|
| copy_meta_from(self: 'Self', ido: 'DataSet', deep: 'bool' = True) -> 'None'
| Copy pyvista meta data onto this object from another object.
|
| Parameters
| ----------
| ido : pyvista.DataSet
| Dataset to copy the metadata from.
|
| deep : bool, default: True
| Deep or shallow copy.
|
| find_cells_along_line(self: 'Self', pointa: 'VectorLike[float]', pointb: 'VectorLike[float]', tolerance: 'float' = 0.0) -> 'NumpyArray[int]'
| Find the index of cells whose bounds intersect a line.
|
| Line is defined from ``pointa`` to ``pointb``.
|
| Parameters
| ----------
| pointa : VectorLike
| Length 3 coordinate of the start of the line.
|
| pointb : VectorLike
| Length 3 coordinate of the end of the line.
|
| tolerance : float, default: 0.0
| The absolute tolerance to use to find cells along line.
|
| Returns
| -------
| numpy.ndarray
| Index or indices of the cell(s) whose bounds intersect
| the line.
|
| Warnings
| --------
| This method returns cells whose bounds intersect the line.
| This means that the line may not intersect the cell itself.
| To obtain cells that intersect the line, use
| :func:`pyvista.DataSet.find_cells_intersecting_line`.
|
| See Also
| --------
| DataSet.find_closest_point
| DataSet.find_closest_cell
| DataSet.find_containing_cell
| DataSet.find_cells_within_bounds
| DataSet.find_cells_intersecting_line
|
| Examples
| --------
| >>> import pyvista as pv
| >>> mesh = pv.Sphere()
| >>> mesh.find_cells_along_line([0.0, 0, 0], [1.0, 0, 0])
| array([ 86, 87, 1652, 1653])
|
| find_cells_intersecting_line(self: 'Self', pointa: 'VectorLike[float]', pointb: 'VectorLike[float]', tolerance: 'float' = 0.0) -> 'NumpyArray[int]'
| Find the index of cells that intersect a line.
|
| Line is defined from ``pointa`` to ``pointb``. This
| method requires vtk version >=9.2.0.
|
| Parameters
| ----------
| pointa : sequence[float]
| Length 3 coordinate of the start of the line.
|
| pointb : sequence[float]
| Length 3 coordinate of the end of the line.
|
| tolerance : float, default: 0.0
| The absolute tolerance to use to find cells along line.
|
| Returns
| -------
| numpy.ndarray
| Index or indices of the cell(s) that intersect
| the line.
|
| See Also
| --------
| DataSet.find_closest_point
| DataSet.find_closest_cell
| DataSet.find_containing_cell
| DataSet.find_cells_within_bounds
| DataSet.find_cells_along_line
|
| Examples
| --------
| >>> import pyvista as pv
| >>> mesh = pv.Sphere()
| >>> mesh.find_cells_intersecting_line([0.0, 0, 0], [1.0, 0, 0])
| array([ 86, 1653])
|
| find_cells_within_bounds(self: 'Self', bounds: 'BoundsTuple') -> 'NumpyArray[int]'
| Find the index of cells in this mesh within bounds.
|
| Parameters
| ----------
| bounds : sequence[float]
| Bounding box. The form is: ``(x_min, x_max, y_min, y_max, z_min, z_max)``.
|
| Returns
| -------
| numpy.ndarray
| Index or indices of the cell in this mesh that are closest
| to the given point.
|
| See Also
| --------
| DataSet.find_closest_point
| DataSet.find_closest_cell
| DataSet.find_containing_cell
| DataSet.find_cells_along_line
|
| Examples
| --------
| >>> import pyvista as pv
| >>> mesh = pv.Cube()
| >>> index = mesh.find_cells_within_bounds([-2.0, 2.0, -2.0, 2.0, -2.0, 2.0])
|
| find_closest_cell(self: 'Self', point: 'VectorLike[float] | MatrixLike[float]', return_closest_point: 'bool' = False) -> 'int | NumpyArray[int] | tuple[int | NumpyArray[int], NumpyArray[int]]'
| Find index of closest cell in this mesh to the given point.
|
| Parameters
| ----------
| point : VectorLike[float] | MatrixLike[float]
| Coordinates of point to query (length 3) or a
| :class:`numpy.ndarray` of ``n`` points with shape ``(n, 3)``.
|
| return_closest_point : bool, default: False
| If ``True``, the closest point within a mesh cell to that point is
| returned. This is not necessarily the closest nodal point on the
| mesh. Default is ``False``.
|
| Returns
| -------
| int or numpy.ndarray
| Index or indices of the cell in this mesh that is/are closest
| to the given point(s).
|
| .. versionchanged:: 0.35.0
| Inputs of shape ``(1, 3)`` now return a :class:`numpy.ndarray`
| of shape ``(1,)``.
|
| numpy.ndarray
| Point or points inside a cell of the mesh that is/are closest
| to the given point(s). Only returned if
| ``return_closest_point=True``.
|
| .. versionchanged:: 0.35.0
| Inputs of shape ``(1, 3)`` now return a :class:`numpy.ndarray`
| of the same shape.
|
| Warnings
| --------
| This method may still return a valid cell index even if the point
| contains a value like ``numpy.inf`` or ``numpy.nan``.
|
| See Also
| --------
| DataSet.find_closest_point
| DataSet.find_containing_cell
| DataSet.find_cells_along_line
| DataSet.find_cells_within_bounds
| :ref:`distance_between_surfaces_example`
|
| Examples
| --------
| Find nearest cell on a sphere centered on the
| origin to the point ``[0.1, 0.2, 0.3]``.
|
| >>> import pyvista as pv
| >>> mesh = pv.Sphere()
| >>> point = [0.1, 0.2, 0.3]
| >>> index = mesh.find_closest_cell(point)
| >>> index
| 338
|
| Make sure that this cell indeed is the closest to
| ``[0.1, 0.2, 0.3]``.
|
| >>> import numpy as np
| >>> cell_centers = mesh.cell_centers()
| >>> relative_position = cell_centers.points - point
| >>> distance = np.linalg.norm(relative_position, axis=1)
| >>> np.argmin(distance)
| np.int64(338)
|
| Find the nearest cells to several random points that
| are centered on the origin.
|
| >>> points = 2 * np.random.default_rng().random((5000, 3)) - 1
| >>> indices = mesh.find_closest_cell(points)
| >>> indices.shape
| (5000,)
|
| For the closest cell, find the point inside the cell that is
| closest to the supplied point. The rectangle is a unit square
| with 1 cell and 4 nodal points at the corners in the plane with
| ``z`` normal and ``z=0``. The closest point inside the cell is
| not usually at a nodal point.
|
| >>> unit_square = pv.Rectangle()
| >>> index, closest_point = unit_square.find_closest_cell(
| ... [0.25, 0.25, 0.5], return_closest_point=True
| ... )
| >>> closest_point
| array([0.25, 0.25, 0. ])
|
| But, the closest point can be a nodal point, although the index of
| that point is not returned. If the closest nodal point by index is
| desired, see :func:`DataSet.find_closest_point`.
|
| >>> index, closest_point = unit_square.find_closest_cell(
| ... [1.0, 1.0, 0.5], return_closest_point=True
| ... )
| >>> closest_point
| array([1., 1., 0.])
|
| find_closest_point(self: 'Self', point: 'Iterable[float]', n: 'int' = 1) -> 'int | VectorLike[int]'
| Find index of closest point in this mesh to the given point.
|
| If wanting to query many points, use a KDTree with scipy or another
| library as those implementations will be easier to work with.
|
| See: https://github.com/pyvista/pyvista-support/issues/107
|
| Parameters
| ----------
| point : sequence[float]
| Length 3 coordinate of the point to query.
|
| n : int, optional
| If greater than ``1``, returns the indices of the ``n`` closest
| points.
|
| Returns
| -------
| int
| The index of the point in this mesh that is closest to the given point.
|
| See Also
| --------
| DataSet.find_closest_cell
| DataSet.find_containing_cell
| DataSet.find_cells_along_line
| DataSet.find_cells_within_bounds
|
| Examples
| --------
| Find the index of the closest point to ``(0, 1, 0)``.
|
| >>> import pyvista as pv
| >>> mesh = pv.Sphere()
| >>> index = mesh.find_closest_point((0, 1, 0))
| >>> index
| 239
|
| Get the coordinate of that point.
|
| >>> mesh.points[index]
| pyvista_ndarray([-0.05218758, 0.49653167, 0.02706946], dtype=float32)
|
| find_containing_cell(self: 'Self', point: 'VectorLike[float] | MatrixLike[float]') -> 'int | NumpyArray[int]'
| Find index of a cell that contains the given point.
|
| Parameters
| ----------
| point : VectorLike[float] | MatrixLike[float],
| Coordinates of point to query (length 3) or a
| :class:`numpy.ndarray` of ``n`` points with shape ``(n, 3)``.
|
| Returns
| -------
| int or numpy.ndarray
| Index or indices of the cell in this mesh that contains
| the given point.
|
| .. versionchanged:: 0.35.0
| Inputs of shape ``(1, 3)`` now return a :class:`numpy.ndarray`
| of shape ``(1,)``.
|
| See Also
| --------
| DataSet.find_closest_point
| DataSet.find_closest_cell
| DataSet.find_cells_along_line
| DataSet.find_cells_within_bounds
|
| Examples
| --------
| A unit square with 16 equal sized cells is created and a cell
| containing the point ``[0.3, 0.3, 0.0]`` is found.
|
| >>> import pyvista as pv
| >>> mesh = pv.ImageData(dimensions=[5, 5, 1], spacing=[1 / 4, 1 / 4, 0])
| >>> mesh
| ImageData...
| >>> mesh.find_containing_cell([0.3, 0.3, 0.0])
| 5
|
| A point outside the mesh domain will return ``-1``.
|
| >>> mesh.find_containing_cell([0.3, 0.3, 1.0])
| -1
|
| Find the cells that contain 1000 random points inside the mesh.
|
| >>> import numpy as np
| >>> points = np.random.default_rng().random((1000, 3))
| >>> indices = mesh.find_containing_cell(points)
| >>> indices.shape
| (1000,)
|
| get_array(self: 'Self', name: 'str', preference: 'CellLiteral | PointLiteral | FieldLiteral' = 'cell') -> 'pyvista.pyvista_ndarray'
| Search both point, cell and field data for an array.
|
| Parameters
| ----------
| name : str
| Name of the array.
|
| preference : str, default: "cell"
| When scalars is specified, this is the preferred array
| type to search for in the dataset. Must be either
| ``'point'``, ``'cell'``, or ``'field'``.
|
| Returns
| -------
| pyvista.pyvista_ndarray
| Requested array.
|
| Examples
| --------
| Create a DataSet with a variety of arrays.
|
| >>> import pyvista as pv
| >>> mesh = pv.Cube()
| >>> mesh.clear_data()
| >>> mesh.point_data['point-data'] = range(mesh.n_points)
| >>> mesh.cell_data['cell-data'] = range(mesh.n_cells)
| >>> mesh.field_data['field-data'] = ['a', 'b', 'c']
| >>> mesh.array_names
| ['point-data', 'field-data', 'cell-data']
|
| Get the point data array.
|
| >>> mesh.get_array('point-data')
| pyvista_ndarray([0, 1, 2, 3, 4, 5, 6, 7])
|
| Get the cell data array.
|
| >>> mesh.get_array('cell-data')
| pyvista_ndarray([0, 1, 2, 3, 4, 5])
|
| Get the field data array.
|
| >>> mesh.get_array('field-data')
| pyvista_ndarray(['a', 'b', 'c'], dtype='<U1')
|
| get_array_association(self: 'Self', name: 'str', preference: "Literal['cell', 'point', 'field']" = 'cell') -> 'FieldAssociation'
| Get the association of an array.
|
| Parameters
| ----------
| name : str
| Name of the array.
|
| preference : str, default: "cell"
| When ``name`` is specified, this is the preferred array
| association to search for in the dataset. Must be either
| ``'point'``, ``'cell'``, or ``'field'``.
|
| Returns
| -------
| pyvista.core.utilities.arrays.FieldAssociation
| Field association of the array.
|
| Examples
| --------
| Create a DataSet with a variety of arrays.
|
| >>> import pyvista as pv
| >>> mesh = pv.Cube()
| >>> mesh.clear_data()
| >>> mesh.point_data['point-data'] = range(mesh.n_points)
| >>> mesh.cell_data['cell-data'] = range(mesh.n_cells)
| >>> mesh.field_data['field-data'] = ['a', 'b', 'c']
| >>> mesh.array_names
| ['point-data', 'field-data', 'cell-data']
|
| Get the point data array association.
|
| >>> mesh.get_array_association('point-data')
| <FieldAssociation.POINT: 0>
|
| Get the cell data array association.
|
| >>> mesh.get_array_association('cell-data')
| <FieldAssociation.CELL: 1>
|
| Get the field data array association.
|
| >>> mesh.get_array_association('field-data')
| <FieldAssociation.NONE: 2>
|
| get_cell(self: 'Self', index: 'int') -> 'pyvista.Cell'
| Return a :class:`pyvista.Cell` object.
|
| Parameters
| ----------
| index : int
| Cell ID.
|
| Returns
| -------
| pyvista.Cell
| The i-th pyvista.Cell.
|
| Notes
| -----
| Cells returned from this method are deep copies of the original
| cells. Changing properties (for example, ``points``) will not affect
| the dataset they originated from.
|
| Examples
| --------
| Get the 0-th cell.
|
| >>> from pyvista import examples
| >>> mesh = examples.load_airplane()
| >>> cell = mesh.get_cell(0)
| >>> cell
| Cell ...
|
| Get the point ids of the first cell
|
| >>> cell.point_ids
| [0, 1, 2]
|
| Get the point coordinates of the first cell
|
| >>> cell.points
| array([[897.0, 48.8, 82.3],
| [906.6, 48.8, 80.7],
| [907.5, 55.5, 83.7]])
|
| For the first cell, get the points associated with the first edge
|
| >>> cell.edges[0].point_ids
| [0, 1]
|
| For a Tetrahedron, get the point ids of the last face
|
| >>> mesh = examples.cells.Tetrahedron()
| >>> cell = mesh.get_cell(0)
| >>> cell.faces[-1].point_ids
| [0, 2, 1]
|
| get_data_range(self: 'Self', arr_var: 'str | NumpyArray[float] | None' = None, preference: 'PointLiteral | CellLiteral | FieldLiteral' = 'cell') -> 'tuple[float, float]'
| Get the min and max of a named array.
|
| Parameters
| ----------
| arr_var : str, np.ndarray, optional
| The name of the array to get the range. If ``None``, the
| active scalars is used.
|
| preference : str, default: "cell"
| When scalars is specified, this is the preferred array type
| to search for in the dataset. Must be either ``'point'``,
| ``'cell'``, or ``'field'``.
|
| Returns
| -------
| tuple
| ``(min, max)`` of the named array.
|
| plot(var_item, off_screen=None, full_screen=None, screenshot=None, interactive=True, cpos=None, window_size=None, show_bounds=False, show_axes=None, notebook=None, background=None, text='', return_img=False, eye_dome_lighting=False, volume=False, parallel_projection=False, jupyter_backend=None, return_viewer=False, return_cpos=False, jupyter_kwargs=None, theme=None, anti_aliasing=None, zoom=None, border=False, border_color='k', border_width=2.0, ssao=False, **kwargs) from pyvista._plot
| Plot a PyVista, numpy, or vtk object.
|
| Parameters
| ----------
| var_item : pyvista.DataSet
| See :func:`Plotter.add_mesh <pyvista.Plotter.add_mesh>` for all
| supported types.
|
| off_screen : bool, optional
| Plots off screen when ``True``. Helpful for saving
| screenshots without a window popping up. Defaults to the
| global setting ``pyvista.OFF_SCREEN``.
|
| full_screen : bool, default: :attr:`pyvista.plotting.themes.Theme.full_screen`
| Opens window in full screen. When enabled, ignores
| ``window_size``.
|
| screenshot : str or bool, optional
| Saves screenshot to file when enabled. See:
| :func:`Plotter.screenshot() <pyvista.Plotter.screenshot>`.
| Default ``False``.
|
| When ``True``, takes screenshot and returns ``numpy`` array of
| image.
|
| interactive : bool, default: :attr:`pyvista.plotting.themes.Theme.interactive`
| Allows user to pan and move figure.
|
| cpos : list, optional
| List of camera position, focal point, and view up.
|
| window_size : sequence, default: :attr:`pyvista.plotting.themes.Theme.window_size`
| Window size in pixels.
|
| show_bounds : bool, default: False
| Shows mesh bounds when ``True``.
|
| show_axes : bool, default: :attr:`pyvista.plotting.themes._AxesConfig.show`
| Shows a vtk axes widget.
|
| notebook : bool, default: :attr:`pyvista.plotting.themes.Theme.notebook`
| When ``True``, the resulting plot is placed inline a jupyter
| notebook. Assumes a jupyter console is active.
|
| background : ColorLike, default: :attr:`pyvista.plotting.themes.Theme.background`
| Color of the background.
|
| text : str, optional
| Adds text at the bottom of the plot.
|
| return_img : bool, default: False
| Returns numpy array of the last image rendered.
|
| eye_dome_lighting : bool, optional
| Enables eye dome lighting.
|
| volume : bool, default: False
| Use the :func:`Plotter.add_volume()
| <pyvista.Plotter.add_volume>` method for volume rendering.
|
| parallel_projection : bool, default: False
| Enable parallel projection.
|
| jupyter_backend : str, default: :attr:`pyvista.plotting.themes.Theme.jupyter_backend`
| Jupyter notebook plotting backend to use. One of the
| following:
|
| * ``'none'`` : Do not display in the notebook.
| * ``'static'`` : Display a static figure.
| * ``'trame'`` : Display using ``trame``.
|
| This can also be set globally with
| :func:`pyvista.set_jupyter_backend`.
|
| return_viewer : bool, default: False
| Return the jupyterlab viewer, scene, or display object
| when plotting with jupyter notebook.
|
| return_cpos : bool, default: False
| Return the last camera position from the render window
| when enabled. Defaults to value in theme settings.
|
| jupyter_kwargs : dict, optional
| Keyword arguments for the Jupyter notebook plotting backend.
| See :ref:`customize_trame_toolbar_example` for an example
| using this keyword.
|
| theme : pyvista.plotting.themes.Theme, optional
| Plot-specific theme.
|
| anti_aliasing : str | bool, default: :attr:`pyvista.plotting.themes.Theme.anti_aliasing`
| Enable or disable anti-aliasing. If ``True``, uses ``"msaa"``. If False,
| disables anti_aliasing. If a string, should be either ``"fxaa"`` or
| ``"ssaa"``.
|
| zoom : float, str, optional
| Camera zoom. Either ``'tight'`` or a float. A value greater than 1
| is a zoom-in, a value less than 1 is a zoom-out. Must be greater
| than 0.
|
| border : bool, default: False
| Draw a border around each render window.
|
| border_color : ColorLike, default: "k"
| Either a string, rgb list, or hex color string. For example:
|
| * ``color='white'``
| * ``color='w'``
| * ``color=[1.0, 1.0, 1.0]``
| * ``color='#FFFFFF'``
|
| border_width : float, default: 2.0
| Width of the border in pixels when enabled.
|
| ssao : bool, optional
| Enable surface space ambient occlusion (SSAO). See
| :func:`Plotter.enable_ssao` for more details.
|
| **kwargs : dict, optional
| See :func:`pyvista.Plotter.add_mesh` for additional options.
|
| Returns
| -------
| cpos : list
| List of camera position, focal point, and view up.
| Returned only when ``return_cpos=True`` or set in the
| default global or plot theme. Not returned when in a
| jupyter notebook and ``return_viewer=True``.
|
| image : np.ndarray
| Numpy array of the last image when either ``return_img=True``
| or ``screenshot=True`` is set. Not returned when in a
| jupyter notebook with ``return_viewer=True``. Optionally
| contains alpha values. Sized:
|
| * [Window height x Window width x 3] if the theme sets
| ``transparent_background=False``.
| * [Window height x Window width x 4] if the theme sets
| ``transparent_background=True``.
|
| widget : ipywidgets.Widget
| IPython widget when ``return_viewer=True``.
|
| Examples
| --------
| Plot a simple sphere while showing its edges.
|
| >>> import pyvista as pv
| >>> mesh = pv.Sphere()
| >>> mesh.plot(show_edges=True)
|
| Plot a volume mesh. Color by distance from the center of the
| ImageData. Note ``volume=True`` is passed.
|
| >>> import numpy as np
| >>> grid = pv.ImageData(dimensions=(32, 32, 32), spacing=(0.5, 0.5, 0.5))
| >>> grid['data'] = np.linalg.norm(grid.center - grid.points, axis=1)
| >>> grid['data'] = np.abs(grid['data'] - grid['data'].max()) ** 3
| >>> grid.plot(volume=True)
|
| point_cell_ids(self: 'Self', ind: 'int') -> 'list[int]'
| Get the cell IDs that use the ind-th point.
|
| Implements :vtk:`vtkDataSet.GetPointCells`.
|
| Parameters
| ----------
| ind : int
| Point ID.
|
| Returns
| -------
| list[int]
| List of cell IDs using the ind-th point.
|
| Examples
| --------
| Get the cell ids using the 0-th point.
|
| >>> import pyvista as pv
| >>> mesh = pv.Sphere(theta_resolution=10)
| >>> mesh.point_cell_ids(0)
| [0, 1, 2, 3, 4, 5, 6, 7, 8, 9]
|
| Plot them.
|
| >>> pl = pv.Plotter()
| >>> _ = pl.add_mesh(mesh, show_edges=True)
| >>>
| >>> # Label the 0-th point
| >>> _ = pl.add_point_labels(
| ... mesh.points[0], ['0'], text_color='blue', font_size=20
| ... )
| >>>
| >>> # Get the cells ids using the 0-th point
| >>> ids = mesh.point_cell_ids(0)
| >>> cells = mesh.extract_cells(ids)
| >>> _ = pl.add_mesh(cells, color='red', show_edges=True)
| >>> centers = cells.cell_centers().points
| >>> _ = pl.add_point_labels(
| ... centers,
| ... labels=[f'{i}' for i in ids],
| ... text_color='white',
| ... font_size=20,
| ... shape=None,
| ... show_points=False,
| ... )
| >>>
| >>> # Plot the other cells
| >>> others = mesh.extract_cells(
| ... [i for i in range(mesh.n_cells) if i not in ids]
| ... )
| >>> _ = pl.add_mesh(others, show_edges=True)
| >>>
| >>> pl.camera_position = 'xy'
| >>> pl.camera.zoom(7.0)
| >>> pl.show()
|
| point_is_inside_cell(self: 'Self', ind: 'int', point: 'VectorLike[float] | MatrixLike[float]') -> 'bool | NumpyArray[np.bool_]'
| Return whether one or more points are inside a cell.
|
| .. versionadded:: 0.35.0
|
| Parameters
| ----------
| ind : int
| Cell ID.
|
| point : VectorLike[float] | MatrixLike[float]
| Point or points to query if are inside a cell.
|
| Returns
| -------
| bool or numpy.ndarray
| Whether point(s) is/are inside cell. A single bool is only returned if
| the input point has shape ``(3,)``.
|
| Examples
| --------
| >>> from pyvista import examples
| >>> mesh = examples.load_hexbeam()
| >>> mesh.get_cell(0).bounds
| BoundsTuple(x_min = 0.0,
| x_max = 0.5,
| y_min = 0.0,
| y_max = 0.5,
| z_min = 0.0,
| z_max = 0.5)
| >>> mesh.point_is_inside_cell(0, [0.2, 0.2, 0.2])
| True
|
| point_neighbors(self: 'Self', ind: 'int') -> 'list[int]'
| Get the point neighbors of the ind-th point.
|
| Parameters
| ----------
| ind : int
| Point ID.
|
| Returns
| -------
| list[int]
| List of neighbor points IDs for the ind-th point.
|
| See Also
| --------
| pyvista.DataSet.point_neighbors_levels
|
| Examples
| --------
| Get the point neighbors of the 0-th point.
|
| >>> import pyvista as pv
| >>> mesh = pv.Sphere(theta_resolution=10)
| >>> mesh.point_neighbors(0)
| [2, 226, 198, 170, 142, 114, 86, 254, 58, 30]
|
| Plot them.
|
| >>> pl = pv.Plotter()
| >>> _ = pl.add_mesh(mesh, show_edges=True)
| >>>
| >>> # Label the 0-th point
| >>> _ = pl.add_point_labels(
| ... mesh.points[0], ['0'], text_color='blue', font_size=40
| ... )
| >>>
| >>> # Get the point neighbors and plot them
| >>> neighbors = mesh.point_neighbors(0)
| >>> _ = pl.add_point_labels(
| ... mesh.points[neighbors],
| ... labels=[f'{i}' for i in neighbors],
| ... text_color='red',
| ... font_size=40,
| ... )
| >>> pl.camera_position = 'xy'
| >>> pl.camera.zoom(7.0)
| >>> pl.show()
|
| point_neighbors_levels(self: 'Self', ind: 'int', n_levels: 'int' = 1) -> 'Generator[list[int], None, None]'
| Get consecutive levels of point neighbors.
|
| Parameters
| ----------
| ind : int
| Point ID.
|
| n_levels : int, default: 1
| Number of levels to search for point neighbors.
| When equal to 1, it is equivalent to :func:`pyvista.DataSet.point_neighbors`.
|
| Returns
| -------
| generator[list[[int]]
| A generator of list of neighbor points IDs for the ind-th point.
|
| See Also
| --------
| pyvista.DataSet.point_neighbors
|
| Examples
| --------
| Get the point neighbors IDs starting from the 0-th point
| up until the third level.
|
| >>> import pyvista as pv
| >>> mesh = pv.Sphere(theta_resolution=10)
| >>> pt_nbr_levels = mesh.point_neighbors_levels(0, 3)
| >>> pt_nbr_levels = list(pt_nbr_levels)
| >>> pt_nbr_levels[0]
| [2, 226, 198, 170, 142, 114, 86, 30, 58, 254]
| >>> pt_nbr_levels[1]
| [3, 227, 255, 199, 171, 143, 115, 87, 59, 31]
| >>> pt_nbr_levels[2]
| [256, 32, 4, 228, 200, 172, 144, 116, 88, 60]
|
| Visualize these points IDs.
|
| >>> from functools import partial
| >>> pl = pv.Plotter()
| >>> _ = pl.add_mesh(mesh, show_edges=True)
| >>>
| >>> # Define partial function to add point labels
| >>> add_point_labels = partial(
| ... pl.add_point_labels,
| ... text_color='white',
| ... font_size=40,
| ... point_size=10,
| ... )
| >>>
| >>> # Add the first point label
| >>> _ = add_point_labels(mesh.points[0], labels=['0'], text_color='blue')
| >>>
| >>> # Add the neighbors to the plot
| >>> neighbors = mesh.point_neighbors_levels(0, n_levels=3)
| >>> for i, ids in enumerate(neighbors, start=1):
| ... _ = add_point_labels(
| ... mesh.points[ids],
| ... labels=[f'{i}'] * len(ids),
| ... text_color='red',
| ... )
| >>>
| >>> pl.view_xy()
| >>> pl.camera.zoom(4.0)
| >>> pl.show()
|
| rename_array(self: 'Self', old_name: 'str', new_name: 'str', preference: 'PointLiteral | CellLiteral | FieldLiteral' = 'cell') -> 'None'
| Change array name by searching for the array then renaming it.
|
| Parameters
| ----------
| old_name : str
| Name of the array to rename.
|
| new_name : str
| Name to rename the array to.
|
| preference : str, default: "cell"
| If there are two arrays of the same name associated with
| points, cells, or field data, it will prioritize an array
| matching this type. Can be either ``'cell'``,
| ``'field'``, or ``'point'``.
|
| Examples
| --------
| Create a cube, assign a point array to the mesh named
| ``'my_array'``, and rename it to ``'my_renamed_array'``.
|
| >>> import pyvista as pv
| >>> import numpy as np
| >>> cube = pv.Cube()
| >>> cube['my_array'] = range(cube.n_points)
| >>> cube.rename_array('my_array', 'my_renamed_array')
| >>> cube['my_renamed_array']
| pyvista_ndarray([0, 1, 2, 3, 4, 5, 6, 7])
|
| set_active_scalars(self: 'Self', name: 'str | None', preference: 'PointLiteral | CellLiteral' = 'cell') -> 'tuple[FieldAssociation, NumpyArray[float] | None]'
| Find the scalars by name and appropriately sets it as active.
|
| To deactivate any active scalars, pass ``None`` as the ``name``.
|
| Parameters
| ----------
| name : str, optional
| Name of the scalars array to assign as active. If
| ``None``, deactivates active scalars for both point and
| cell data.
|
| preference : str, default: "cell"
| If there are two arrays of the same name associated with
| points or cells, it will prioritize an array matching this
| type. Can be either ``'cell'`` or ``'point'``.
|
| Returns
| -------
| pyvista.core.utilities.arrays.FieldAssociation
| Association of the scalars matching ``name``.
|
| pyvista_ndarray
| An array from the dataset matching ``name``.
|
| set_active_tensors(self: 'Self', name: 'str | None', preference: 'PointLiteral | CellLiteral' = 'point') -> 'None'
| Find the tensors by name and appropriately sets it as active.
|
| To deactivate any active tensors, pass ``None`` as the ``name``.
|
| Parameters
| ----------
| name : str, optional
| Name of the tensors array to assign as active.
|
| preference : str, default: "point"
| If there are two arrays of the same name associated with
| points, cells, or field data, it will prioritize an array
| matching this type. Can be either ``'cell'``,
| ``'field'``, or ``'point'``.
|
| set_active_vectors(self: 'Self', name: 'str | None', preference: 'PointLiteral | CellLiteral' = 'point') -> 'None'
| Find the vectors by name and appropriately sets it as active.
|
| To deactivate any active vectors, pass ``None`` as the ``name``.
|
| Parameters
| ----------
| name : str, optional
| Name of the vectors array to assign as active.
|
| preference : str, default: "point"
| If there are two arrays of the same name associated with
| points, cells, or field data, it will prioritize an array
| matching this type. Can be either ``'cell'``,
| ``'field'``, or ``'point'``.
|
| ----------------------------------------------------------------------
| Readonly properties inherited from pyvista.core.dataset.DataSet:
|
| active_normals
| Return the active normals as an array.
|
| Returns
| -------
| pyvista_ndarray
| Active normals of this dataset.
|
| Notes
| -----
| If both point and cell normals exist, this returns point
| normals by default.
|
| Examples
| --------
| Compute normals on an example sphere mesh and return the
| active normals for the dataset. Show that this is the same size
| as the number of points.
|
| >>> import pyvista as pv
| >>> mesh = pv.Sphere()
| >>> mesh = mesh.compute_normals()
| >>> normals = mesh.active_normals
| >>> normals.shape
| (842, 3)
| >>> mesh.n_points
| 842
|
| active_scalars
| Return the active scalars as an array.
|
| Returns
| -------
| Optional[pyvista_ndarray]
| Active scalars as an array.
|
| active_scalars_info
| Return the active scalar's association and name.
|
| Association refers to the data association (e.g. point, cell, or
| field) of the active scalars.
|
| Returns
| -------
| ActiveArrayInfo
| The scalars info in an object with namedtuple semantics,
| with attributes ``association`` and ``name``.
|
| Notes
| -----
| If both cell and point scalars are present and neither have
| been set active within at the dataset level, point scalars
| will be made active.
|
| Examples
| --------
| Create a mesh, add scalars to the mesh, and return the active
| scalars info. Note how when the scalars are added, they
| automatically become the active scalars.
|
| >>> import pyvista as pv
| >>> mesh = pv.Sphere()
| >>> mesh['Z Height'] = mesh.points[:, 2]
| >>> mesh.active_scalars_info
| ActiveArrayInfoTuple(association=<FieldAssociation.POINT: 0>, name='Z Height')
|
| active_tensors
| Return the active tensors array.
|
| Returns
| -------
| Optional[np.ndarray]
| Active tensors array.
|
| active_tensors_info
| Return the active tensor's field and name: [field, name].
|
| Returns
| -------
| ActiveArrayInfo
| Active tensor's field and name: [field, name].
|
| active_vectors
| Return the active vectors array.
|
| Returns
| -------
| Optional[pyvista_ndarray]
| Active vectors array.
|
| Examples
| --------
| Create a mesh, compute the normals inplace, and return the
| normals vector array.
|
| >>> import pyvista as pv
| >>> mesh = pv.Sphere()
| >>> _ = mesh.compute_normals(inplace=True)
| >>> mesh.active_vectors # doctest:+SKIP
| pyvista_ndarray([[-2.48721432e-10, -1.08815623e-09, -1.00000000e+00],
| [-2.48721432e-10, -1.08815623e-09, 1.00000000e+00],
| [-1.18888125e-01, 3.40539310e-03, -9.92901802e-01],
| ...,
| [-3.11940581e-01, -6.81432486e-02, 9.47654784e-01],
| [-2.09880397e-01, -4.65070531e-02, 9.76620376e-01],
| [-1.15582108e-01, -2.80492082e-02, 9.92901802e-01]],
| dtype=float32)
|
| active_vectors_info
| Return the active vector's association and name.
|
| Association refers to the data association (e.g. point, cell, or
| field) of the active vectors.
|
| Returns
| -------
| ActiveArrayInfo
| The vectors info in an object with namedtuple semantics,
| with attributes ``association`` and ``name``.
|
| Notes
| -----
| If both cell and point vectors are present and neither have
| been set active within at the dataset level, point vectors
| will be made active.
|
| Examples
| --------
| Create a mesh, compute the normals inplace, set the active
| vectors to the normals, and show that the active vectors are
| the ``'Normals'`` array associated with points.
|
| >>> import pyvista as pv
| >>> mesh = pv.Sphere()
| >>> _ = mesh.compute_normals(inplace=True)
| >>> mesh.active_vectors_name = 'Normals'
| >>> mesh.active_vectors_info
| ActiveArrayInfoTuple(association=<FieldAssociation.POINT: 0>, name='Normals')
|
| area
| Return the mesh area if 2D.
|
| This will return 0 for meshes with 3D cells.
|
| Returns
| -------
| float
| Total area of the mesh.
|
| Examples
| --------
| Get the area of a square of size 2x2.
| Note 5 points in each direction.
|
| >>> import pyvista as pv
| >>> mesh = pv.ImageData(dimensions=(5, 5, 1))
| >>> mesh.area
| 16.0
|
| A mesh with 3D cells does not have an area. To get
| the outer surface area, first extract the surface using
| :func:`pyvista.DataSetFilters.extract_surface`.
|
| >>> mesh = pv.ImageData(dimensions=(5, 5, 5))
| >>> mesh.area
| 0.0
|
| Get the area of a sphere. Discretization error results
| in slight difference from ``pi``.
|
| >>> mesh = pv.Sphere()
| >>> mesh.area
| 3.13
|
| array_names
| Return a list of array names for the dataset.
|
| This makes sure to put the active scalars' name first in the list.
|
| Returns
| -------
| list[str]
| List of array names for the dataset.
|
| Examples
| --------
| Return the array names for a mesh.
|
| >>> import pyvista as pv
| >>> mesh = pv.Sphere()
| >>> mesh.point_data['my_array'] = range(mesh.n_points)
| >>> mesh.array_names
| ['my_array', 'Normals']
|
| arrows
| Return a glyph representation of the active vector data as arrows.
|
| Arrows will be located at the points or cells of the mesh and
| their size will be dependent on the norm of the vector.
| Their direction will be the "direction" of the vector.
|
| If there are both active point and cell vectors, preference is
| given to the point vectors.
|
| Returns
| -------
| pyvista.PolyData
| Active vectors represented as arrows.
|
| Examples
| --------
| Create a mesh, compute the normals and set them active.
|
| >>> import pyvista as pv
| >>> mesh = pv.Cube()
| >>> mesh_w_normals = mesh.compute_normals()
| >>> mesh_w_normals.active_vectors_name = 'Normals'
|
| Plot the active vectors as arrows. Show the original mesh as wireframe for
| context.
|
| >>> arrows = mesh_w_normals.arrows
| >>> pl = pv.Plotter()
| >>> _ = pl.add_mesh(mesh, style='wireframe')
| >>> _ = pl.add_mesh(arrows, color='red')
| >>> pl.show()
|
| bounds
| Return the bounding box of this dataset.
|
| Returns
| -------
| BoundsLike
| Bounding box of this dataset.
| The form is: ``(x_min, x_max, y_min, y_max, z_min, z_max)``.
|
| Examples
| --------
| Create a cube and return the bounds of the mesh.
|
| >>> import pyvista as pv
| >>> cube = pv.Cube()
| >>> cube.bounds
| BoundsTuple(x_min = -0.5,
| x_max = 0.5,
| y_min = -0.5,
| y_max = 0.5,
| z_min = -0.5,
| z_max = 0.5)
|
| cell
| A generator that provides an easy way to loop over all cells.
|
| To access a single cell, use :func:`pyvista.DataSet.get_cell`.
|
| .. versionchanged:: 0.39.0
| Now returns a generator instead of a list.
| Use ``get_cell(i)`` instead of ``cell[i]``.
|
| Yields
| ------
| pyvista.Cell
|
| See Also
| --------
| pyvista.DataSet.get_cell
|
| Examples
| --------
| Loop over the cells
|
| >>> import pyvista as pv
| >>> # Create a grid with 9 points and 4 cells
| >>> mesh = pv.ImageData(dimensions=(3, 3, 1))
| >>> for cell in mesh.cell: # doctest: +SKIP
| ... cell
|
| cell_data
| Return cell data as DataSetAttributes.
|
| Returns
| -------
| DataSetAttributes
| Cell data as DataSetAttributes.
|
| Examples
| --------
| Add cell arrays to a mesh and list the available ``cell_data``.
|
| >>> import pyvista as pv
| >>> import numpy as np
| >>> mesh = pv.Cube()
| >>> mesh.clear_data()
| >>> mesh.cell_data['my_array'] = np.random.default_rng().random(mesh.n_cells)
| >>> mesh.cell_data['my_other_array'] = np.arange(mesh.n_cells)
| >>> mesh.cell_data
| pyvista DataSetAttributes
| Association : CELL
| Active Scalars : my_array
| Active Vectors : None
| Active Texture : None
| Active Normals : None
| Contains arrays :
| my_array float64 (6,) SCALARS
| my_other_array int64 (6,)
|
| Access an array from ``cell_data``.
|
| >>> mesh.cell_data['my_other_array']
| pyvista_ndarray([0, 1, 2, 3, 4, 5])
|
| Or access it directly from the mesh.
|
| >>> mesh['my_array'].shape
| (6,)
|
| center
| Return the center of the bounding box.
|
| Returns
| -------
| tuple[float, float, float]
| Center of the bounding box.
|
| Examples
| --------
| Get the center of a mesh.
|
| >>> import pyvista as pv
| >>> mesh = pv.Sphere(center=(1, 2, 0))
| >>> mesh.center
| (1.0, 2.0, 0.0)
|
| is_empty
| Return ``True`` if there are no points.
|
| .. versionadded:: 0.45
|
| Examples
| --------
| >>> import pyvista as pv
| >>> mesh = pv.PolyData()
| >>> mesh.is_empty
| True
|
| >>> mesh = pv.Sphere()
| >>> mesh.is_empty
| False
|
| length
| Return the length of the diagonal of the bounding box.
|
| Returns
| -------
| float
| Length of the diagonal of the bounding box.
|
| Examples
| --------
| Get the length of the bounding box of a cube. This should
| match ``3**(1/2)`` since it is the diagonal of a cube that is
| ``1 x 1 x 1``.
|
| >>> import pyvista as pv
| >>> mesh = pv.Cube()
| >>> mesh.length
| 1.7320508075688772
|
| n_arrays
| Return the number of arrays present in the dataset.
|
| Returns
| -------
| int
| Number of arrays present in the dataset.
|
| n_cells
| Return the number of cells in the entire dataset.
|
| Returns
| -------
| int :
| Number of cells in the entire dataset.
|
| Notes
| -----
| This returns the total number of cells -- for :class:`pyvista.PolyData`
| this includes vertices, lines, triangle strips and polygonal faces.
|
| Examples
| --------
| Create a mesh and return the number of cells in the
| mesh.
|
| >>> import pyvista as pv
| >>> cube = pv.Cube()
| >>> cube.n_cells
| 6
|
| n_points
| Return the number of points in the entire dataset.
|
| Returns
| -------
| int
| Number of points in the entire dataset.
|
| Examples
| --------
| Create a mesh and return the number of points in the
| mesh.
|
| >>> import pyvista as pv
| >>> cube = pv.Cube()
| >>> cube.n_points
| 8
|
| number_of_cells
| Return the number of cells.
|
| Returns
| -------
| int :
| Number of cells.
|
| number_of_points
| Return the number of points.
|
| Returns
| -------
| int :
| Number of points.
|
| point_data
| Return point data as DataSetAttributes.
|
| Returns
| -------
| DataSetAttributes
| Point data as DataSetAttributes.
|
| Examples
| --------
| Add point arrays to a mesh and list the available ``point_data``.
|
| >>> import pyvista as pv
| >>> import numpy as np
| >>> mesh = pv.Cube()
| >>> mesh.clear_data()
| >>> mesh.point_data['my_array'] = np.random.default_rng().random(mesh.n_points)
| >>> mesh.point_data['my_other_array'] = np.arange(mesh.n_points)
| >>> mesh.point_data
| pyvista DataSetAttributes
| Association : POINT
| Active Scalars : my_array
| Active Vectors : None
| Active Texture : None
| Active Normals : None
| Contains arrays :
| my_array float64 (8,) SCALARS
| my_other_array int64 (8,)
|
| Access an array from ``point_data``.
|
| >>> mesh.point_data['my_other_array']
| pyvista_ndarray([0, 1, 2, 3, 4, 5, 6, 7])
|
| Or access it directly from the mesh.
|
| >>> mesh['my_array'].shape
| (8,)
|
| volume
| Return the mesh volume.
|
| This will return 0 for meshes with 2D cells.
|
| Returns
| -------
| float
| Total volume of the mesh.
|
| Examples
| --------
| Get the volume of a cube of size 4x4x4.
| Note that there are 5 points in each direction.
|
| >>> import pyvista as pv
| >>> mesh = pv.ImageData(dimensions=(5, 5, 5))
| >>> mesh.volume
| 64.0
|
| A mesh with 2D cells has no volume.
|
| >>> mesh = pv.ImageData(dimensions=(5, 5, 1))
| >>> mesh.volume
| 0.0
|
| :class:`pyvista.PolyData` is special as a 2D surface can
| enclose a 3D volume. This case uses a different methodology,
| see :func:`pyvista.PolyData.volume`.
|
| >>> mesh = pv.Sphere()
| >>> mesh.volume
| 0.51825
|
| ----------------------------------------------------------------------
| Data descriptors inherited from pyvista.core.dataset.DataSet:
|
| active_scalars_name
| Return the name of the active scalars.
|
| Returns
| -------
| str
| Name of the active scalars.
|
| Examples
| --------
| Create a mesh, add scalars to the mesh, and return the name of
| the active scalars.
|
| >>> import pyvista as pv
| >>> mesh = pv.Sphere()
| >>> mesh['Z Height'] = mesh.points[:, 2]
| >>> mesh.active_scalars_name
| 'Z Height'
|
| active_tensors_name
| Return the name of the active tensor array.
|
| Returns
| -------
| str
| Name of the active tensor array.
|
| active_texture_coordinates
| Return the active texture coordinates on the points.
|
| Returns
| -------
| Optional[pyvista_ndarray]
| Active texture coordinates on the points.
|
| Examples
| --------
| Return the active texture coordinates from the globe example.
|
| >>> from pyvista import examples
| >>> globe = examples.load_globe()
| >>> globe.active_texture_coordinates
| pyvista_ndarray([[0. , 0. ],
| [0. , 0.07142857],
| [0. , 0.14285714],
| ...,
| [1. , 0.85714286],
| [1. , 0.92857143],
| [1. , 1. ]], shape=(540, 2))
|
| active_vectors_name
| Return the name of the active vectors array.
|
| Returns
| -------
| str
| Name of the active vectors array.
|
| Examples
| --------
| Create a mesh, compute the normals, set them as active, and
| return the name of the active vectors.
|
| >>> import pyvista as pv
| >>> mesh = pv.Sphere()
| >>> mesh_w_normals = mesh.compute_normals()
| >>> mesh_w_normals.active_vectors_name = 'Normals'
| >>> mesh_w_normals.active_vectors_name
| 'Normals'
|
| ----------------------------------------------------------------------
| Methods inherited from pyvista.core.filters.image_data.ImageDataFilters:
|
| cells_to_points(self: 'ImageData', scalars: 'str | None' = None, *, dimensionality: "VectorLike[bool] | Literal[0, 1, 2, 3, '0D', '1D', '2D', '3D', 'preserve']" = 'preserve', copy: 'bool' = True)
| Re-mesh image data from a cell-based to a point-based representation.
|
| This filter changes how image data is represented. Data represented as cells
| at the input is re-meshed into an alternative representation as points at the
| output. Only the :class:`~pyvista.ImageData` container is modified so that
| the number of input cells equals the number of output points. The re-meshing is
| otherwise lossless in the sense that cell data at the input is passed through
| unmodified and stored as point data at the output. Any point data at the input is
| ignored and is not used by this filter.
|
| To change the image data's representation, the input cell centers are used to
| represent the output points. This has the effect of "shrinking" the
| input image dimensions by one along each axis (i.e. half the cell width on each
| side). For example, an image with 101 points and 100 cells along an axis at the
| input will have 100 points and 99 cells at the output. If the input has 1mm
| spacing, the axis size will also decrease from 100mm to 99mm.
|
| Since filters may be inherently cell-based (e.g. some :class:`~pyvista.DataSetFilters`)
| or may operate on point data exclusively (e.g. most :class:`~pyvista.ImageDataFilters`),
| re-meshing enables the same data to be used with either kind of filter while
| ensuring the input data to those filters has the appropriate representation.
| This filter is also useful when plotting image data to achieve a desired visual
| effect, such as plotting images as points instead of as voxel cells.
|
| .. note::
| Only the input's :attr:`~pyvista.ImageData.dimensions`, and
| :attr:`~pyvista.ImageData.origin` are modified by this filter. Other spatial
| properties such as :attr:`~pyvista.ImageData.spacing` and
| :attr:`~pyvista.ImageData.direction_matrix` are not affected.
|
| .. versionadded:: 0.44.0
|
| See Also
| --------
| points_to_cells
| Inverse of this filter to represent points as cells.
| :meth:`~pyvista.DataObjectFilters.cell_data_to_point_data`
| Resample cell data as point data without modifying the container.
| :meth:`~pyvista.DataObjectFilters.cell_data_to_point_data`
| Resample point data as cell data without modifying the container.
|
| Parameters
| ----------
| scalars : str, optional
| Name of cell data scalars to pass through to the output as point data. Use
| this parameter to restrict the output to only include the specified array.
| By default, all cell data arrays at the input are passed through as point
| data at the output.
|
| dimensionality : VectorLike[bool], Literal[0, 1, 2, 3, "0D", "1D", "2D", "3D", "preserve"]
| Control which dimensions will be modified by the filter.
| ``'preserve'`` is used by default.
|
| - Can be specified as a sequence of 3 boolean to allow modification on a per
| dimension basis.
| - ``0`` or ``'0D'``: convenience alias to output a 0D ImageData with
| dimensions ``(1, 1, 1)``. Only valid for 0D inputs.
| - ``1`` or ``'1D'``: convenience alias to output a 1D ImageData where
| exactly one dimension is greater than one, e.g. ``(>1, 1, 1)``. Only valid
| for 0D or 1D inputs.
| - ``2`` or ``'2D'``: convenience alias to output a 2D ImageData where
| exactly two dimensions are greater than one, e.g. ``(>1, >1, 1)``. Only
| valid for 0D, 1D, or 2D inputs.
| - ``3`` or ``'3D'``: convenience alias to output a 3D ImageData, where all
| three dimensions are greater than one, e.g. ``(>1, >1, >1)``. Valid for
| any 0D, 1D, 2D, or 3D inputs.
| - ``'preserve'`` (default): convenience alias to not modify singleton
| dimensions.
|
| .. note::
| This filter does not modify singleton dimensions with ``dimensionality``
| set as ``'preserve'`` by default.
|
| copy : bool, default: True
| Copy the input cell data before associating it with the output point data.
| If ``False``, the input and output will both refer to the same data array(s).
|
| Returns
| -------
| pyvista.ImageData
| Image with a point-based representation.
|
| Examples
| --------
| Load an image with cell data.
|
| >>> from pyvista import examples
| >>> image = examples.load_uniform()
|
| Show the current properties and cell arrays of the image.
|
| >>> image
| ImageData (...)
| N Cells: 729
| N Points: 1000
| X Bounds: 0.000e+00, 9.000e+00
| Y Bounds: 0.000e+00, 9.000e+00
| Z Bounds: 0.000e+00, 9.000e+00
| Dimensions: 10, 10, 10
| Spacing: 1.000e+00, 1.000e+00, 1.000e+00
| N Arrays: 2
|
| >>> image.cell_data.keys()
| ['Spatial Cell Data']
|
| Re-mesh the cells and cell data as points and point data.
|
| >>> points_image = image.cells_to_points()
|
| Show the properties and point arrays of the re-meshed image.
|
| >>> points_image
| ImageData (...)
| N Cells: 512
| N Points: 729
| X Bounds: 5.000e-01, 8.500e+00
| Y Bounds: 5.000e-01, 8.500e+00
| Z Bounds: 5.000e-01, 8.500e+00
| Dimensions: 9, 9, 9
| Spacing: 1.000e+00, 1.000e+00, 1.000e+00
| N Arrays: 1
|
| >>> points_image.point_data.keys()
| ['Spatial Cell Data']
|
| Observe that:
|
| - The input cell array is now a point array
| - The output has one less array (the input point data is ignored)
| - The dimensions have decreased by one
| - The bounds have decreased by half the spacing
| - The output ``N Points`` equals the input ``N Cells``
|
| See :ref:`image_representations_example` for more examples using this filter.
|
| contour_labeled(self, n_labels: 'int | None' = None, smoothing: 'bool' = False, smoothing_num_iterations: 'int' = 50, smoothing_relaxation_factor: 'float' = 0.5, smoothing_constraint_distance: 'float' = 1, output_mesh_type: "Literal['quads', 'triangles']" = 'quads', output_style: "Literal['default', 'boundary']" = 'default', scalars: 'str | None' = None, progress_bar: 'bool' = False) -> 'pyvista.PolyData'
| Generate labeled contours from 3D label maps.
|
| SurfaceNets algorithm is used to extract contours preserving sharp
| boundaries for the selected labels from the label maps.
| Optionally, the boundaries can be smoothened to reduce the staircase
| appearance in case of low resolution input label maps.
|
| This filter requires that the :class:`ImageData` has integer point
| scalars, such as multi-label maps generated from image segmentation.
|
| .. note::
| Requires ``vtk>=9.3.0``.
|
| .. deprecated:: 0.45
| This filter produces unexpected results and is deprecated.
| Use :meth:`~pyvista.ImageDataFilters.contour_labels` instead.
| See https://github.com/pyvista/pyvista/issues/5981 for details.
|
| To replicate the default behavior from this filter, call `contour_labels`
| with the following arguments:
|
| .. code-block:: python
|
| image.contour_labels(
| boundary_style='strict_external', # old filter strictly uses external polygons
| smoothing=False, # old filter does not apply smoothing
| output_mesh_type='quads', # old filter generates quads
| pad_background=False, # old filter generates open surfaces at input edges
| orient_faces=False, # old filter does not orient faces
| simplify_output=False, # old filter returns multi-component scalars
| )
|
| Parameters
| ----------
| n_labels : int, optional
| Number of labels to be extracted (all are extracted if None is given).
|
| smoothing : bool, default: False
| Apply smoothing to the meshes.
|
| smoothing_num_iterations : int, default: 50
| Number of smoothing iterations.
|
| smoothing_relaxation_factor : float, default: 0.5
| Relaxation factor of the smoothing.
|
| smoothing_constraint_distance : float, default: 1
| Constraint distance of the smoothing.
|
| output_mesh_type : str, default: 'quads'
| Type of the output mesh. Must be either ``'quads'``, or ``'triangles'``.
|
| output_style : str, default: 'default'
| Style of the output mesh. Must be either ``'default'`` or ``'boundary'``.
| When ``'default'`` is specified, the filter produces a mesh with both
| interior and exterior polygons. When ``'boundary'`` is selected, only
| polygons on the border with the background are produced (without interior
| polygons). Note that style ``'selected'`` is currently not implemented.
|
| scalars : str, optional
| Name of scalars to process. Defaults to currently active scalars.
|
| progress_bar : bool, default: False
| Display a progress bar to indicate progress.
|
| Returns
| -------
| pyvista.PolyData
| :class:`pyvista.PolyData` Labeled mesh with the segments labeled.
|
| References
| ----------
| Sarah F. Frisken, SurfaceNets for Multi-Label Segmentations with Preservation
| of Sharp Boundaries, Journal of Computer Graphics Techniques (JCGT), vol. 11,
| no. 1, 34-54, 2022. Available online http://jcgt.org/published/0011/01/03/
|
| https://www.kitware.com/really-fast-isocontouring/
|
| Examples
| --------
| See :ref:`contouring_example` for a full example using this filter.
|
| See Also
| --------
| pyvista.DataSetFilters.contour
| Generalized contouring method which uses MarchingCubes or FlyingEdges.
|
| pyvista.DataSetFilters.pack_labels
| Function used internally by SurfaceNets to generate contiguous label data.
|
| contour_labels(self: 'ImageData', boundary_style: "Literal['external', 'internal', 'all', 'strict_external']" = 'external', *, background_value: 'int' = 0, select_inputs: 'int | VectorLike[int] | None' = None, select_outputs: 'int | VectorLike[int] | None' = None, pad_background: 'bool' = True, output_mesh_type: "Literal['quads', 'triangles'] | None" = None, scalars: 'str | None' = None, orient_faces: 'bool' = True, simplify_output: 'bool | None' = None, smoothing: 'bool' = True, smoothing_iterations: 'int' = 16, smoothing_relaxation: 'float' = 0.5, smoothing_distance: 'float | None' = None, smoothing_scale: 'float' = 1.0, progress_bar: 'bool' = False) -> 'PolyData'
| Generate surface contours from 3D image label maps.
|
| This filter uses :vtk:`vtkSurfaceNets3D`
| to extract polygonal surface contours from non-continuous label maps, which
| corresponds to discrete regions in an input 3D image (i.e., volume). It is
| designed to generate surfaces from image point data, e.g. voxel point
| samples from 3D medical images, though images with cell data are also supported.
|
| The generated surface is smoothed using a constrained smoothing filter, which
| may be fine-tuned to control the smoothing process. Optionally, smoothing may
| be disabled to generate a staircase-like surface.
|
| The output surface includes a two-component cell data array ``'boundary_labels'``.
| The array indicates the labels/regions on either side of the polygons composing
| the output. The array's values are structured as follows:
|
| External boundary values
|
| Polygons between a foreground region and the background have the
| form ``[foreground, background]``.
|
| E.g. ``[1, 0]`` for the boundary between region ``1`` and background ``0``.
|
| Internal boundary values
|
| Polygons between two connected foreground regions are sorted in ascending order.
|
| E.g. ``[1, 2]`` for the boundary between regions ``1`` and ``2``.
|
| By default, this filter returns ``'external'`` contours only. Optionally,
| only the ``'internal'`` contours or ``'all'`` contours (i.e. internal and
| external) may be returned.
|
| .. note::
|
| This filter requires VTK version ``9.3.0`` or greater.
|
| .. versionadded:: 0.45
|
| Parameters
| ----------
| boundary_style : 'external' | 'internal' | 'all' | 'strict_external', default: 'external'
| Style of boundary polygons to generate. ``'internal'`` polygons are generated
| between two connected foreground regions. ``'external'`` polygons are
| generated between foreground and background regions. ``'all'`` includes
| both internal and external boundary polygons.
|
| These styles are generated such that ``internal + external = all``.
| Internally, the filter computes all boundary polygons by default and
| then removes any undesired polygons in post-processing.
| This improves the quality of the output, but can negatively affect the
| filter's performance since all boundaries are always initially computed.
|
| The ``'strict_external'`` style can be used as a fast alternative to
| ``'external'``. This style `strictly` generates external polygons and does
| not compute or consider internal boundaries. This computation is fast, but
| also results in jagged, non-smooth boundaries between regions. The
| ``select_inputs`` and ``select_outputs`` options cannot be used with this
| style.
|
| background_value : int, default: 0
| Background value of the input image. All other values are considered
| as foreground.
|
| select_inputs : int | VectorLike[int], default: None
| Specify label ids to include as inputs to the filter. Labels that are not
| selected are removed from the input *before* generating the surface. By
| default, all label ids are used.
|
| Since the smoothing operation occurs across selected input regions, using
| this option to filter the input can result in smoother and more visually
| pleasing surfaces since non-selected inputs are not considered during
| smoothing. However, this also means that the generated surface will change
| shape depending on which inputs are selected.
|
| .. note::
|
| Selecting inputs can affect whether a boundary polygon is considered to
| be ``internal`` or ``external``. That is, an internal boundary becomes an
| external boundary when only one of the two foreground regions on the
| boundary is selected.
|
| select_outputs : int | VectorLike[int], default: None
| Specify label ids to include in the output of the filter. Labels that are
| not selected are removed from the output *after* generating the surface. By
| default, all label ids are used.
|
| Since the smoothing operation occurs across all input regions, using this
| option to filter the output means that the selected output regions will have
| the same shape (i.e. smoothed in the same manner), regardless of the outputs
| that are selected. This is useful for generating a surface for specific
| labels while also preserving sharp boundaries with non-selected outputs.
|
| .. note::
|
| Selecting outputs does not affect whether a boundary polygon is
| considered to be ``internal`` or ``external``. That is, an internal
| boundary remains internal even if only one of the two foreground regions
| on the boundary is selected.
|
| pad_background : bool, default: True
| :meth:`Pad <pyvista.ImageDataFilters.pad_image>` the image
| with ``background_value`` prior to contouring. This will
| generate polygons to "close" the surface at the boundaries of the image.
| This option is only relevant when there are foreground regions on the border
| of the image. Setting this value to ``False`` is useful if processing multiple
| volumes separately so that the generated surfaces fit together without
| creating surface overlap.
|
| output_mesh_type : str, default: None
| Type of the output mesh. Can be either ``'quads'``, or ``'triangles'``. By
| default, the output mesh has :attr:`~pyvista.CellType.TRIANGLE` cells when
| ``smoothing`` is enabled and :attr:`~pyvista.CellType.QUAD` cells (quads)
| otherwise. The mesh type can be forced to be triangles or quads; however,
| if smoothing is enabled and the type is ``'quads'``, the generated quads
| may not be planar.
|
| scalars : str, optional
| Name of scalars to process. Defaults to currently active scalars. If cell
| scalars are specified, the input image is first re-meshed with
| :meth:`~pyvista.ImageDataFilters.cells_to_points` to transform the cell
| data into point data.
|
| orient_faces : bool, default: True
| Orient the faces of the generated contours so that they have consistent
| ordering and face outward. If ``False``, the generated polygons may have
| inconsistent ordering and orientation, which can negatively impact
| downstream calculations and the shading used for rendering.
|
| .. note::
|
| Orienting the faces can be computationally expensive for large meshes.
| Consider disabling this option to improve this filter's performance.
|
| .. warning::
|
| Enabling this option is `likely` to generate surfaces with normals
| pointing outward when ``pad_background`` is ``True`` and
| ``boundary_style`` is ``'external'`` (the default). However, this is
| not guaranteed if the generated surface is not closed or if internal
| boundaries are generated. Do not assume the normals will point outward
| in all cases.
|
| simplify_output : bool, optional
| Simplify the ``'boundary_labels'`` array as a single-component 1D array.
| If ``False``, the returned ``'boundary_labels'`` array is a two-component
| 2D array. This simplification is useful when only external boundaries
| are generated and/or when visualizing internal boundaries. The
| simplification is as follows:
|
| - External boundaries are simplified by keeping the first component and
| removing the second. Since external polygons may only share a boundary
| with the background, the second component is always ``background_value``
| and therefore can be dropped without loss of information. The values
| of external boundaries always match the foreground values of the input.
|
| - Internal boundaries are simplified by assigning them unique negative
| values sequentially. E.g. the boundary label ``[1, 2]`` is replaced with
| ``-1``, ``[1, 3]`` is replaced with ``-2``, etc. The mapping to negative
| values is not fixed, and can change depending on the input.
|
| This simplification is particularly useful for unsigned integer labels
| (e.g. scalars with ``'uint8'`` dtype) since external boundaries
| will be positive and internal boundaries will be negative in this case.
|
| By default, the output is simplified when ``boundary_type`` is
| ``'external'`` or ``'strict_external'``, and is not simplified otherwise.
|
| smoothing : bool, default: True
| Smooth the generated surface using a constrained smoothing filter. Each
| point in the surface is smoothed as follows:
|
| For a point ``pi`` connected to a list of points ``pj`` via an edge, ``pi``
| is moved towards the average position of ``pj`` multiplied by the
| ``smoothing_relaxation`` factor, and limited by the ``smoothing_distance``
| constraint. This process is repeated either until convergence occurs, or
| the maximum number of ``smoothing_iterations`` is reached.
|
| smoothing_iterations : int, default: 16
| Maximum number of smoothing iterations to use.
|
| smoothing_relaxation : float, default: 0.5
| Relaxation factor used at each smoothing iteration.
|
| smoothing_distance : float, default: None
| Maximum distance each point is allowed to move (in any direction) during
| smoothing. This distance may be scaled with ``smoothing_scale``. By default,
| the distance is computed dynamically from the image spacing as:
|
| ``distance = norm(image_spacing) * smoothing_scale``.
|
| smoothing_scale : float, default: 1.0
| Relative scaling factor applied to ``smoothing_distance``. See that
| parameter for details.
|
| progress_bar : bool, default: False
| Display a progress bar to indicate progress.
|
| Returns
| -------
| pyvista.PolyData
| Surface mesh of labeled regions.
|
| See Also
| --------
| :meth:`~pyvista.DataSetFilters.voxelize_binary_mask`
| Filter that generates binary labeled :class:`~pyvista.ImageData` from
| :class:`~pyvista.PolyData` surface contours. Can beloosely considered as
| an inverse of this filter.
|
| :meth:`~pyvista.ImageDataFilters.cells_to_points`
| Re-mesh :class:`~pyvista.ImageData` to a points-based representation.
|
| :meth:`~pyvista.DataSetFilters.extract_values`
| Threshold-like filter which can used to process the multi-component
| scalars generated by this filter.
|
| :meth:`~pyvista.DataSetFilters.contour`
| Generalized contouring method which uses MarchingCubes or FlyingEdges.
|
| :meth:`~pyvista.DataSetFilters.pack_labels`
| Function used internally by SurfaceNets to generate contiguous label data.
|
| :meth:`~pyvista.DataSetFilters.color_labels`
| Color labeled data, e.g. labeled volumes or contours.
|
| :ref:`contouring_example`, :ref:`anatomical_groups_example`
| Additional examples using this filter.
|
| References
| ----------
| S. Frisken, “SurfaceNets for Multi-Label Segmentations with Preservation of
| Sharp Boundaries”, J. Computer Graphics Techniques, 2022. Available online:
| http://jcgt.org/published/0011/01/03/
|
| W. Schroeder, S. Tsalikis, M. Halle, S. Frisken. A High-Performance SurfaceNets
| Discrete Isocontouring Algorithm. arXiv:2401.14906. 2024. Available online:
| `http://arxiv.org/abs/2401.14906 <http://arxiv.org/abs/2401.14906>`__
|
| Examples
| --------
| Load labeled image data with a background region ``0`` and four foreground
| regions.
|
| >>> import pyvista as pv
| >>> import numpy as np
| >>> from pyvista import examples
| >>> image = examples.load_channels()
| >>> label_ids = np.unique(image.active_scalars)
| >>> label_ids
| pyvista_ndarray([0, 1, 2, 3, 4])
| >>> image.dimensions
| (251, 251, 101)
|
| Crop the image to simplify the data.
|
| >>> image = image.extract_subset(voi=(75, 109, 75, 109, 85, 100))
| >>> image.dimensions
| (35, 35, 16)
|
| Plot the cropped image for context. Use :meth:`~pyvista.DataSetFilters.color_labels`
| to generate consistent coloring of the regions for all plots. Negative indexing
| is used for plotting internal boundaries.
|
| >>> def labels_plotter(mesh, zoom=None):
| ... colored_mesh = mesh.color_labels(negative_indexing=True)
| ... plotter = pv.Plotter()
| ... plotter.add_mesh(colored_mesh, show_edges=True)
| ... if zoom:
| ... plotter.camera.zoom(zoom)
| ... return plotter
| >>>
| >>> labels_plotter(image).show()
|
| Generate surface contours of the foreground regions and plot it. Note that
| the ``background_value`` is ``0`` by default.
|
| >>> contours = image.contour_labels()
| >>> labels_plotter(contours, zoom=1.5).show()
|
| By default, only external boundary polygons are generated and the returned
| ``'boundary_labels'`` array is a single-component array. The output values
| match the input label values.
|
| >>> contours['boundary_labels'].ndim
| 1
| >>> np.unique(contours['boundary_labels'])
| pyvista_ndarray([1, 2, 3, 4])
|
| Set ``simplify_output`` to ``False`` to generate a two-component
| array instead showing the two boundary regions associated with each polygon.
|
| >>> contours = image.contour_labels(simplify_output=False)
| >>> contours['boundary_labels'].ndim
| 2
|
| Show the unique values. Since only ``'external'`` boundaries are generated
| by default, the second component is always ``0`` (i.e. the ``background_value``).
| Note that all four foreground regions share a boundary with the background.
|
| >>> np.unique(contours['boundary_labels'], axis=0)
| array([[1, 0],
| [2, 0],
| [3, 0],
| [4, 0]])
|
| Repeat the example but this time generate internal contours only. The generated
| array is 2D by default.
|
| >>> contours = image.contour_labels('internal')
| >>> contours['boundary_labels'].ndim
| 2
|
| Show the unique two-component boundary labels again. From these values we can
| determine that all foreground regions share an internal boundary with each
| other `except` for regions ``1`` and ``3`` since the boundary value ``[1, 3]``
| is missing.
|
| >>> np.unique(contours['boundary_labels'], axis=0)
| array([[1, 2],
| [1, 4],
| [2, 3],
| [2, 4],
| [3, 4]])
|
| Simplify the output so that each internal multi-component boundary value is
| assigned a unique negative integer value instead. This makes it easier to
| visualize the result with :meth:`~pyvista.DataSetFilters.color_labels` using
| the ``negative_indexing`` option.
|
| >>> contours = image.contour_labels('internal', simplify_output=True)
| >>> contours['boundary_labels'].ndim
| 1
| >>> np.unique(contours['boundary_labels'])
| pyvista_ndarray([-5, -4, -3, -2, -1])
|
| >>> labels_plotter(contours, zoom=1.5).show()
|
| Generate contours for all boundaries, and use ``select_outputs`` to filter
| the output to only include polygons which share a boundary with region ``3``.
|
| >>> region_3 = image.contour_labels(
| ... 'all', select_outputs=3, simplify_output=True
| ... )
| >>> labels_plotter(region_3, zoom=3).show()
|
| Note how using ``select_outputs`` preserves the sharp features and boundary
| labels for non-selected regions. If desired, use ``select_inputs`` instead to
| completely "ignore" non-selected regions.
|
| >>> region_3 = image.contour_labels(select_inputs=3)
| >>> labels_plotter(region_3, zoom=3).show()
|
| The sharp features are now smoothed and the internal boundaries are now labeled
| as external boundaries. Note that using ``'all'`` here is optional since
| using ``select_inputs`` converts previously-internal boundaries into external
| ones.
|
| Do not pad the image with background values before contouring. Since the input image
| has foreground regions visible at the edges of the image (e.g. the ``+Z`` bound),
| setting ``pad_background=False`` in this example causes the top and sides of
| the mesh to be "open".
|
| >>> surf = image.contour_labels(pad_background=False)
| >>> labels_plotter(surf, zoom=1.5).show()
|
| Disable smoothing to generate staircase-like surface. Without smoothing, the
| surface has quadrilateral cells by default.
|
| >>> surf = image.contour_labels(smoothing=False)
| >>> labels_plotter(surf, zoom=1.5).show()
|
| Keep smoothing enabled but reduce the smoothing scale. A smoothing scale
| less than one may help preserve sharp features (e.g. corners).
|
| >>> surf = image.contour_labels(smoothing_scale=0.5)
| >>> labels_plotter(surf, zoom=1.5).show()
|
| Use the ``'strict_external'`` style to compute external contours quickly. Note
| that this produces jagged and non-smooth boundaries between regions, which may
| not be desirable. Also note how the top of the surface is perfectly flat compared
| to the default ``'external'`` style (see first example above) since the strict
| style ignores the smoothing effects of all internal boundaries.
|
| >>> surf = image.contour_labels('strict_external')
| >>> labels_plotter(surf, zoom=1.5).show()
|
| crop(self: 'ImageData', *, factor: 'float | VectorLike[float] | None' = None, margin: 'int | VectorLike[int] | None' = None, offset: 'VectorLike[int] | None' = None, dimensions: 'VectorLike[int] | None' = None, extent: 'VectorLike[int] | None' = None, normalized_bounds: 'VectorLike[float] | None' = None, mask: 'str | ImageData | NumpyArray[float] | Literal[True] | None' = None, padding: 'int | VectorLike[int] | None' = None, background_value: 'float | None' = None, keep_dimensions: 'bool' = False, fill_value: 'float | VectorLike[float] | None' = None, rebase_coordinates: 'bool' = False, progress_bar: 'bool' = False) -> 'ImageData'
| Crop this image to remove points at its boundaries.
|
| This filter is useful for extracting a volume or region of interest. There are several ways
| to crop:
|
| #. Use ``factor`` to crop a portion of the image symmetrically.
| #. Use ``margin`` to remove points from the image border.
| #. Use ``dimensions`` (and optionally, ``offset``) to explicitly crop to the specified
| :attr:`~pyvista.ImageData.dimensions` and :attr:`~pyvista.ImageData.offset`.
| #. Use ``extent`` to explicitly crop to a specified :attr:`~pyvista.ImageData.extent`.
| #. Use ``normalized_bounds`` to crop a bounding box relative to the input size.
| #. Use ``mask``, ``padding``, and ``background_value`` to crop to this mesh using scalar
| values to define the cropping region.
|
| These methods are all independent, e.g. it is not possible to specify both ``factor`` and
| ``margin``.
|
| By default, the cropped output's :attr:`~pyvista.ImageData.dimensions` are typically less
| than the input's dimensions. Optionally, use ``keep_dimensions`` and ``fill_value`` to
| ensure the output dimensions always match the input.
|
| .. note::
|
| All cropping is performed using the image's ijk-indices, not physical xyz-bounds.
|
| .. versionadded:: 0.46
|
| Parameters
| ----------
| factor : float, optional
| Cropping factor in range ``[0.0, 1.0]`` which specifies the proportion of the image to
| keep along each axis. Use a single float for uniform cropping or a vector of three
| floats for cropping each xyz-axis independently. The crop is centered in the image.
|
| margin : int | VectorLike[int], optional
| Margin to remove from each side of each axis. Specify:
|
| - A single value to remove from all boundaries equally.
| - Two values, one for each ``(X, Y)`` axis, to remove margin from
| each axis independently.
| - Three values, one for each ``(X, Y, Z)`` axis, to remove margin from
| each axis independently.
| - Four values, one for each ``(-X, +X, -Y, +Y)`` boundary, to remove
| margin from each boundary independently.
| - Six values, one for each ``(-X, +X, -Y, +Y, -Z, +Z)`` boundary, to remove
| margin from each boundary independently.
|
| offset : VectorLike[int], optional
| Length-3 vector of integers specifying the :attr:`~pyvista.ImageData.offset` indices
| where the cropping region originates. If specified, then ``dimensions`` must also be
| provided.
|
| dimensions : VectorLike[int], optional
| Length-3 vector of integers specifying the :attr:`~pyvista.ImageData.dimensions` of
| the cropping region. ``offset`` may also be provided, but if it is not, the crop is
| centered in the image.
|
| extent : VectorLike[int], optional
| Length-6 vector of integers specifying the full :attr:`~pyvista.ImageData.extent` of
| the cropping region.
|
| normalized_bounds : VectorLike[float], optional
| Normalized bounds relative to the input. These are floats between ``0.0`` and ``1.0``
| that define a box relative to the input size. The input is cropped such that it fully
| fits within these bounds. Has the form ``(x_min, x_max, y_min, y_max, z_min, z_max)``.
|
| mask : str | ImageData | NumpyArray[float] | bool, optional
| Scalar values that define the cropping region. Set this option to:
|
| - a string denoting the name of scalars belonging to this mesh
| - ``True`` to use this mesh's default scalars
| - a separate image, in which case the other image's active scalars are used
| - a 1D or 2D (multi-component) array
|
| The length of the scalar array must equal the number of points.
|
| This mesh will be cropped to the bounds of the foreground values of the array, i.e.
| values that are not equal to the specified ``background_value``.
|
| padding : int | VectorLike[int], optional
| Padding to add to foreground region `before` cropping. Only valid when using a mask to
| crop the image. Specify:
|
| - A single value to pad all boundaries equally.
| - Two values, one for each ``(X, Y)`` axis, to apply symmetric padding to
| each axis independently.
| - Three values, one for each ``(X, Y, Z)`` axis, to apply symmetric padding
| to each axis independently.
| - Four values, one for each ``(-X, +X, -Y, +Y)`` boundary, to apply
| padding to each boundary independently.
| - Six values, one for each ``(-X, +X, -Y, +Y, -Z, +Z)`` boundary, to apply
| padding to each boundary independently.
|
| The specified value is the `maximum` padding that may be applied. If the padding
| extends beyond the actual extents of this mesh, it is clipped and does not extend
| outside the bounds of the image.
|
| background_value : float | VectorLike[float], optional
| Value or multi-component vector considered to be the background. Only valid when using
| a mask to crop the image.
|
| keep_dimensions : bool, default: False
| If ``True``, the cropped output is :meth:`padded <pad_image>` with ``fill_value`` to
| ensure the output dimensions match the input.
|
| fill_value : float | VectorLike[float], optional
| Value used when padding the cropped output if ``keep_dimensions`` is ``True``. May be
| a single float or a multi-component vector (e.g. RGB vector).
|
| rebase_coordinates : bool, default: False
| Rebase the coordinate reference of the cropped output:
|
| - the :attr:`~pyvista.ImageData.origin` is set to the minimum bounds of the subset
| - the :attr:`~pyvista.ImageData.offset` is reset to ``(0, 0, 0)``
|
| The rebasing effectively applies a positive translation in world (XYZ) coordinates and
| a similar (i.e. inverse) negative translation in voxel (IJK) coordinates. As a result,
| the :attr:`~pyvista.DataSet.bounds` of the output are unchanged, but the coordinate
| reference frame is modified.
|
| Set this to ``False`` to leave the origin unmodified and keep the offset used by the
| crop.
|
| progress_bar : bool, default: False
| Display a progress bar to indicate progress.
|
| Returns
| -------
| ImageData
| Cropped image.
|
| See Also
| --------
| pad_image
| Add points to image boundaries. This is the inverse operation of the ``margin`` crop.
|
| resample
| Modify an image's dimensions and spacing.
|
| select_values
| Threshold-like filter which may be used to generate a mask for cropping.
|
| extract_subset
| Equivalent filter to ``crop(extent=voi, rebase_coordinates=True)``.
|
| :ref:`crop_labeled_example`
| Example cropping :class:`~pyvista.ImageData` using a segmentation mask.
|
| Examples
| --------
| Load a grayscale image.
|
| >>> import numpy as np
| >>> import pyvista as pv
| >>> from pyvista import examples
| >>> gray_image = examples.download_yinyang()
| >>> gray_image.dimensions
| (512, 342, 1)
|
| Define a custom plotting helper to show the image as pixel cells.
|
| >>> def image_plotter(image):
| ... pixel_cells = image.points_to_cells()
| ...
| ... pl = pv.Plotter()
| ... pl.add_mesh(
| ... pixel_cells,
| ... cmap='gray',
| ... clim=[0, 255],
| ... lighting=False,
| ... show_scalar_bar=False,
| ... )
| ... pl.view_xy()
| ... pl.camera.tight()
| ... return pl
|
| Plot the image for context.
|
| >>> image_plotter(gray_image).show()
|
| Crop the white border around the image using active scalars as a mask. Here we specify a
| background value of ``255`` to correspond to white pixels. If this was an RGB image, we
| could also specify ``(255, 255, 255)`` as the background value.
|
| >>> cropped = gray_image.crop(mask=True, background_value=255)
| >>> cropped.dimensions
| (237, 238, 1)
| >>> image_plotter(cropped).show()
|
| Use ``margin`` instead to remove 100 and 20 pixels from each side of the x- and y-axis,
| respectively.
|
| >>> cropped = gray_image.crop(margin=(100, 20))
| >>> cropped.dimensions
| (312, 302, 1)
| >>> image_plotter(cropped).show()
|
| Use ``offset`` to select a starting location for the crop (from the origin at the
| bottom-left corner) along with ``dimensions`` to define the crop size.
|
| >>> cropped = gray_image.crop(offset=(50, 20, 0), dimensions=(300, 200, 1))
| >>> cropped.dimensions
| (300, 200, 1)
| >>> image_plotter(cropped).show()
|
| Use ``extent`` directly instead of using ``dimensions`` and ``offset`` to yield the same
| result as above.
|
| >>> cropped = gray_image.crop(extent=(50, 349, 20, 219, 0, 0))
| >>> cropped.extent
| (50, 349, 20, 219, 0, 0)
| >>> image_plotter(cropped).show()
|
| Use ``factor`` to crop 40% of the image. This `keeps` 40% of the pixels along each axis,
| and `removes` 60% (i.e. 30% from each side).
|
| >>> cropped = gray_image.crop(factor=0.4)
| >>> cropped.dimensions
| (204, 136, 1)
| >>> image_plotter(cropped).show()
|
| Use ``normalized_bounds`` to crop from 40% to 80% of the image along the x-axis, and
| from 30% to 90% of the image along the y-axis.
|
| >>> cropped = gray_image.crop(normalized_bounds=[0.4, 0.8, 0.3, 0.9, 0.0, 1.0])
| >>> cropped.extent
| (205, 408, 103, 306, 0, 0)
| >>> image_plotter(cropped).show()
|
| extract_subset(self, voi, rate=(1, 1, 1), boundary: 'bool' = False, rebase_coordinates: 'bool' = True, progress_bar: 'bool' = False)
| Select piece (e.g., volume of interest).
|
| To use this filter set the VOI ivar which are i-j-k min/max indices
| that specify a rectangular region in the data. (Note that these are
| 0-offset.) You can also specify a sampling rate to subsample the
| data.
|
| Typical applications of this filter are to extract a slice from a
| volume for image processing, subsampling large volumes to reduce data
| size, or extracting regions of a volume with interesting data.
|
| Parameters
| ----------
| voi : sequence[int]
| Length 6 iterable of ints: ``(x_min, x_max, y_min, y_max, z_min, z_max)``.
| These bounds specify the volume of interest in i-j-k min/max
| indices.
|
| rate : sequence[int], default: (1, 1, 1)
| Length 3 iterable of ints: ``(xrate, yrate, zrate)``.
|
| boundary : bool, default: False
| Control whether to enforce that the "boundary" of the grid
| is output in the subsampling process. This only has effect
| when the rate in any direction is not equal to 1. When
| this is enabled, the subsampling will always include the
| boundary of the grid even though the sample rate is not an
| even multiple of the grid dimensions. By default this is
| disabled.
|
| rebase_coordinates : bool, default: True
| If ``True`` (default), reset the coordinate reference of the extracted subset:
|
| - the :attr:`~pyvista.ImageData.origin` is set to the minimum bounds of the subset
| - the :attr:`~pyvista.ImageData.offset` is reset to ``(0, 0, 0)``
|
| The rebasing effectively applies a positive translation in world (XYZ) coordinates and
| a similar (i.e. inverse) negative translation in voxel (IJK) coordinates. As a result,
| the :attr:`~pyvista.DataSet.bounds` of the output are unchanged, but the coordinate
| reference frame is modified.
|
| Set this to ``False`` to leave the origin unmodified and keep the offset specified by
| the ``voi`` parameter.
|
| .. versionadded:: 0.46
|
| progress_bar : bool, default: False
| Display a progress bar to indicate progress.
|
| Returns
| -------
| pyvista.ImageData
| ImageData subset.
|
| See Also
| --------
| slice_index
| crop
|
| fft(self, output_scalars_name=None, progress_bar: 'bool' = False)
| Apply a fast Fourier transform (FFT) to the active scalars.
|
| The input can be real or complex data, but the output is always
| :attr:`numpy.complex128`. The filter is fastest for images that have
| power of two sizes.
|
| The filter uses a butterfly diagram for each prime factor of the
| dimension. This makes images with prime number dimensions (i.e. 17x17)
| much slower to compute. FFTs of multidimensional meshes (i.e volumes)
| are decomposed so that each axis executes serially.
|
| The frequencies of the output assume standard order: along each axis
| first positive frequencies are assumed from 0 to the maximum, then
| negative frequencies are listed from the largest absolute value to
| smallest. This implies that the corners of the grid correspond to low
| frequencies, while the center of the grid corresponds to high
| frequencies.
|
| Parameters
| ----------
| output_scalars_name : str, optional
| The name of the output scalars. By default, this is the same as the
| active scalars of the dataset.
|
| progress_bar : bool, default: False
| Display a progress bar to indicate progress.
|
| Returns
| -------
| pyvista.ImageData
| :class:`pyvista.ImageData` with applied FFT.
|
| See Also
| --------
| rfft : The reverse transform.
| low_pass : Low-pass filtering of FFT output.
| high_pass : High-pass filtering of FFT output.
|
| Examples
| --------
| Apply FFT to an example image.
|
| >>> from pyvista import examples
| >>> image = examples.download_moonlanding_image()
| >>> fft_image = image.fft()
| >>> fft_image.point_data # doctest:+SKIP
| pyvista DataSetAttributes
| Association : POINT
| Active Scalars : PNGImage
| Active Vectors : None
| Active Texture : None
| Active Normals : None
| Contains arrays :
| PNGImage complex128 (298620,) SCALARS
|
| See :ref:`image_fft_example` for a full example using this filter.
|
| gaussian_smooth(self, radius_factor=1.5, std_dev=2.0, scalars=None, progress_bar: 'bool' = False)
| Smooth the data with a Gaussian kernel.
|
| Parameters
| ----------
| radius_factor : float | sequence[float], default: 1.5
| Unitless factor to limit the extent of the kernel.
|
| std_dev : float | sequence[float], default: 2.0
| Standard deviation of the kernel in pixel units.
|
| scalars : str, optional
| Name of scalars to process. Defaults to currently active scalars.
|
| progress_bar : bool, default: False
| Display a progress bar to indicate progress.
|
| Returns
| -------
| pyvista.ImageData
| Uniform grid with smoothed scalars.
|
| Notes
| -----
| This filter only supports point data. For inputs with cell data, consider
| re-meshing the cell data as point data with
| :meth:`~pyvista.ImageDataFilters.cells_to_points`
| or resampling the cell data to point data with
| :func:`~pyvista.DataObjectFilters.cell_data_to_point_data`.
|
| Examples
| --------
| First, create sample data to smooth. Here, we use
| :func:`pyvista.perlin_noise() <pyvista.core.utilities.features.perlin_noise>`
| to create meaningful data.
|
| >>> import numpy as np
| >>> import pyvista as pv
| >>> noise = pv.perlin_noise(0.1, (2, 5, 8), (0, 0, 0))
| >>> grid = pv.sample_function(
| ... noise, bounds=[0, 1, 0, 1, 0, 1], dim=(20, 20, 20)
| ... )
| >>> grid.plot(show_scalar_bar=False)
|
| Next, smooth the sample data.
|
| >>> smoothed = grid.gaussian_smooth()
| >>> smoothed.plot(show_scalar_bar=False)
|
| See :ref:`gaussian_smoothing_example` for a full example using this filter.
|
| high_pass(self, x_cutoff, y_cutoff, z_cutoff, order=1, output_scalars_name=None, progress_bar: 'bool' = False)
| Perform a Butterworth high pass filter in the frequency domain.
|
| This filter requires that the :class:`ImageData` have a complex point
| scalars, usually generated after the :class:`ImageData` has been
| converted to the frequency domain by a :func:`ImageDataFilters.fft`
| filter.
|
| A :func:`ImageDataFilters.rfft` filter can be used to convert the
| output back into the spatial domain. This filter attenuates low
| frequency components. Input and output are complex arrays with
| datatype :attr:`numpy.complex128`.
|
| The frequencies of the input assume standard order: along each axis
| first positive frequencies are assumed from 0 to the maximum, then
| negative frequencies are listed from the largest absolute value to
| smallest. This implies that the corners of the grid correspond to low
| frequencies, while the center of the grid corresponds to high
| frequencies.
|
| Parameters
| ----------
| x_cutoff : float
| The cutoff frequency for the x-axis.
|
| y_cutoff : float
| The cutoff frequency for the y-axis.
|
| z_cutoff : float
| The cutoff frequency for the z-axis.
|
| order : int, default: 1
| The order of the cutoff curve. Given from the equation
| ``1/(1 + (cutoff/freq(i, j))**(2*order))``.
|
| output_scalars_name : str, optional
| The name of the output scalars. By default, this is the same as the
| active scalars of the dataset.
|
| progress_bar : bool, default: False
| Display a progress bar to indicate progress.
|
| Returns
| -------
| pyvista.ImageData
| :class:`pyvista.ImageData` with the applied high pass filter.
|
| See Also
| --------
| fft : Direct fast Fourier transform.
| rfft : Reverse fast Fourier transform.
| low_pass : Low-pass filtering of FFT output.
|
| Examples
| --------
| See :ref:`image_fft_perlin_noise_example` for a full example using this filter.
|
| image_dilate_erode(self, dilate_value=1.0, erode_value=0.0, kernel_size=(3, 3, 3), scalars=None, progress_bar: 'bool' = False)
| Dilates one value and erodes another.
|
| ``image_dilate_erode`` will dilate one value and erode another. It uses
| an elliptical footprint, and only erodes/dilates on the boundary of the
| two values. The filter is restricted to the X, Y, and Z axes for now.
| It can degenerate to a 2 or 1-dimensional filter by setting the kernel
| size to 1 for a specific axis.
|
| Parameters
| ----------
| dilate_value : float, default: 1.0
| Dilate value in the dataset.
|
| erode_value : float, default: 0.0
| Erode value in the dataset.
|
| kernel_size : sequence[int], default: (3, 3, 3)
| Determines the size of the kernel along the three axes.
|
| scalars : str, optional
| Name of scalars to process. Defaults to currently active scalars.
|
| progress_bar : bool, default: False
| Display a progress bar to indicate progress.
|
| Returns
| -------
| pyvista.ImageData
| Dataset that has been dilated/eroded on the boundary of the specified scalars.
|
| Notes
| -----
| This filter only supports point data. For inputs with cell data, consider
| re-meshing the cell data as point data with
| :meth:`~pyvista.ImageDataFilters.cells_to_points`
| or resampling the cell data to point data with
| :func:`~pyvista.DataObjectFilters.cell_data_to_point_data`.
|
| Examples
| --------
| Demonstrate image dilate/erode on an example dataset. First, plot
| the example dataset with the active scalars.
|
| >>> from pyvista import examples
| >>> uni = examples.load_uniform()
| >>> uni.plot()
|
| Now, plot the image threshold with ``threshold=[400, 600]``. Note how
| values within the threshold are 1 and outside are 0.
|
| >>> ithresh = uni.image_threshold([400, 600])
| >>> ithresh.plot()
|
| Note how there is a hole in the thresholded image. Apply a dilation/
| erosion filter with a large kernel to fill that hole in.
|
| >>> idilate = ithresh.image_dilate_erode(kernel_size=[5, 5, 5])
| >>> idilate.plot()
|
| image_threshold(self, threshold, in_value=1.0, out_value=0.0, scalars=None, preference='point', progress_bar: 'bool' = False)
| Apply a threshold to scalar values in a uniform grid.
|
| If a single value is given for threshold, scalar values above or equal
| to the threshold are ``'in'`` and scalar values below the threshold are ``'out'``.
| If two values are given for threshold (sequence) then values equal to
| or between the two values are ``'in'`` and values outside the range are ``'out'``.
|
| If ``None`` is given for ``in_value``, scalars that are ``'in'`` will not be replaced.
| If ``None`` is given for ``out_value``, scalars that are ``'out'`` will not be replaced.
|
| Warning: applying this filter to cell data will send the output to a
| new point array with the same name, overwriting any existing point data
| array with the same name.
|
| Parameters
| ----------
| threshold : float or sequence[float]
| Single value or (min, max) to be used for the data threshold. If
| a sequence, then length must be 2. Threshold(s) for deciding which
| cells/points are ``'in'`` or ``'out'`` based on scalar data.
|
| in_value : float, default: 1.0
| Scalars that match the threshold criteria for ``'in'`` will be replaced with this.
|
| out_value : float, default: 0.0
| Scalars that match the threshold criteria for ``'out'`` will be replaced with this.
|
| scalars : str, optional
| Name of scalars to process. Defaults to currently active scalars.
|
| preference : str, default: "point"
| When scalars is specified, this is the preferred array
| type to search for in the dataset. Must be either
| ``'point'`` or ``'cell'``.
|
| progress_bar : bool, default: False
| Display a progress bar to indicate progress.
|
| Returns
| -------
| pyvista.ImageData
| Dataset with the specified scalars thresholded.
|
| See Also
| --------
| select_values
| Threshold-like method for keeping some values and replacing others.
| :meth:`~pyvista.DataSetFilters.threshold`
| General threshold method that returns a :class:`~pyvista.UnstructuredGrid`.
|
| Examples
| --------
| Demonstrate image threshold on an example dataset. First, plot
| the example dataset with the active scalars.
|
| >>> from pyvista import examples
| >>> uni = examples.load_uniform()
| >>> uni.plot()
|
| Now, plot the image threshold with ``threshold=100``. Note how
| values above the threshold are 1 and below are 0.
|
| >>> ithresh = uni.image_threshold(100)
| >>> ithresh.plot()
|
| See :ref:`image_representations_example` for more examples using this filter.
|
| label_connectivity(self, *, scalars: 'str | None' = None, scalar_range: "Literal['auto', 'foreground', 'vtk_default'] | VectorLike[float]" = 'auto', extraction_mode: "Literal['all', 'largest', 'seeded']" = 'all', point_seeds: 'MatrixLike[float] | VectorLike[float] | _vtk.vtkDataSet | None' = None, label_mode: "Literal['size', 'constant', 'seeds']" = 'size', constant_value: 'int | None' = None, inplace: 'bool' = False, progress_bar: 'bool' = False) -> 'tuple[pyvista.ImageData, NDArray[int], NDArray[int]]'
| Find and label connected regions in a :class:`~pyvista.ImageData`.
|
| Only points whose `scalar` value is within the `scalar_range` are considered for
| connectivity. A 4-connectivity is used for 2D images or a 6-connectivity for 3D
| images. This filter operates on point-based data. If cell-based data are provided,
| they are re-meshed to a point-based representation using
| :func:`~pyvista.ImageDataFilters.cells_to_points` and the output is meshed back
| to a cell-based representation with :func:`~pyvista.ImageDataFilters.points_to_cells`,
| effectively filtering based on face connectivity. The connected regions are
| extracted and labelled according to the strategy defined by ``extraction_mode``
| and ``label_mode``, respectively. Unconnected regions are labelled with ``0`` value.
|
| .. versionadded:: 0.45.0
|
| Notes
| -----
| This filter implements :vtk:`vtkImageConnectivityFilter`.
|
| Parameters
| ----------
| scalars : str, optional
| Scalars to use to filter points. If ``None`` is provided, the scalars is
| automatically set, if possible.
|
| scalar_range : str, Literal['auto', 'foreground', 'vtk_default'], VectorLike[float]
| Points whose scalars value is within ``'scalar_range'`` are considered for
| connectivity. The bounds are inclusive.
|
| - ``'auto'``: (default) includes the full data range, similarly to
| :meth:`~pyvista.DataSetFilters.connectivity`.
| - ``'foreground'``: includes the full data range except the smallest value.
| - ``'vtk_default'``: default to [``0.5``, :const:`~vtk.VTK_DOUBLE_MAX`].
| - ``VectorLike[float]``: explicitly set the range.
|
| The bounds are always cast to floats since vtk expects doubles. The scalars
| data are also cast to floats to avoid unexpected behavior arising from implicit
| type conversion. The only exceptions is if both bounds are whole numbers, in
| which case the implicit conversion is safe. It will optimize resources consumption
| if the data are integers.
|
| extraction_mode : Literal['all', 'largest', 'seeded'], default: 'all'
| Determine how the connected regions are extracted. If ``'all'``, all connected
| regions are extracted. If ``'largest'``, only the largest region is extracted.
| If ``'seeded'``, only the regions that include the points defined with
| ``point_seeds`` are extracted.
|
| point_seeds : MatrixLike[float], VectorLike[float], :vtk:`vtkDataSet`, optional
| The point coordinates to use as seeds, specified as a (N, 3) array like or
| as a :vtk:`vtkDataSet`. Has no effect if ``extraction_mode`` is not
| ``'seeded'``.
|
| label_mode : Literal['size', 'constant', 'seeds'], default: 'size'
| Determine how the extracted regions are labelled. If ``'size'``, label regions
| by decreasing size (i.e., count of cells), starting at ``1``. If ``'constant'``,
| label with the provided ``constant_value``. If ``'seeds'``, label according to
| the seed order, starting at ``1``.
|
| constant_value : int, optional
| The constant label value to use. Has no effect if ``label_mode`` is not ``'seeds'``.
|
| inplace : bool, default: False
| If ``True``, perform an inplace labelling of the ImageData. Else, returns a
| new ImageData.
|
| progress_bar : bool, default: False
| Display a progress bar to indicate progress.
|
| Returns
| -------
| pyvista.ImageData
| Either the input ImageData or a generated one where connected regions are
| labelled with a ``'RegionId'`` point-based or cell-based data.
|
| NDArray[int]
| The labels of each extracted regions.
|
| NDArray[int]
| The size (i.e., number of cells) of each extracted regions.
|
| See Also
| --------
| pyvista.DataSetFilters.connectivity
| Similar general-purpose filter that performs 1-connectivity.
|
| Examples
| --------
| Prepare a segmented grid.
|
| >>> import pyvista as pv
| >>> segmented_grid = pv.ImageData(dimensions=(4, 3, 3))
| >>> segmented_grid.cell_data['Data'] = [
| ... 0,
| ... 0,
| ... 0,
| ... 1,
| ... 0,
| ... 1,
| ... 1,
| ... 2,
| ... 0,
| ... 0,
| ... 0,
| ... 0,
| ... ]
| >>> segmented_grid.plot(show_edges=True)
|
| Label the connected regions. The cells with a ``0`` value are excluded from the
| connected regions and labelled with ``0``. The remaining cells define 3 different
| regions that are labelled by decreasing size.
|
| >>> connected, labels, sizes = segmented_grid.label_connectivity(
| ... scalar_range='foreground'
| ... )
| >>> pl = pv.Plotter()
| >>> _ = pl.add_mesh(connected.threshold(0.5), show_edges=True)
| >>> _ = pl.add_mesh(
| ... connected.threshold(0.5, invert=True),
| ... show_edges=True,
| ... opacity=0.5,
| ... )
| >>> pl.show()
|
| Exclude the cell with a ``2`` value.
|
| >>> connected, labels, sizes = segmented_grid.label_connectivity(
| ... scalar_range=[1, 1]
| ... )
| >>> pl = pv.Plotter()
| >>> _ = pl.add_mesh(connected.threshold(0.5), show_edges=True)
| >>> _ = pl.add_mesh(
| ... connected.threshold(0.5, invert=True),
| ... show_edges=True,
| ... opacity=0.5,
| ... )
| >>> pl.show()
|
| Label all connected regions with a constant value.
|
| >>> connected, labels, sizes = segmented_grid.label_connectivity(
| ... scalar_range='foreground',
| ... label_mode='constant',
| ... constant_value=10,
| ... )
| >>> pl = pv.Plotter()
| >>> _ = pl.add_mesh(connected.threshold(0.5), show_edges=True)
| >>> _ = pl.add_mesh(
| ... connected.threshold(0.5, invert=True),
| ... show_edges=True,
| ... opacity=0.5,
| ... )
| >>> pl.show()
|
| Label only the regions that include seed points, by seed order.
|
| >>> points = [(2.0, 1.0, 0.0), (0.0, 0.0, 1.0)]
| >>> connected, labels, sizes = segmented_grid.label_connectivity(
| ... scalar_range='foreground',
| ... extraction_mode='seeded',
| ... point_seeds=points,
| ... )
| >>> pl = pv.Plotter()
| >>> _ = pl.add_mesh(connected.threshold(0.5), show_edges=True)
| >>> _ = pl.add_mesh(
| ... connected.threshold(0.5, invert=True),
| ... show_edges=True,
| ... opacity=0.5,
| ... )
| >>> pl.show()
|
| low_pass(self, x_cutoff, y_cutoff, z_cutoff, order=1, output_scalars_name=None, progress_bar: 'bool' = False)
| Perform a Butterworth low pass filter in the frequency domain.
|
| This filter requires that the :class:`ImageData` have a complex point
| scalars, usually generated after the :class:`ImageData` has been
| converted to the frequency domain by a :func:`ImageDataFilters.fft`
| filter.
|
| A :func:`ImageDataFilters.rfft` filter can be used to convert the
| output back into the spatial domain. This filter attenuates high
| frequency components. Input and output are complex arrays with
| datatype :attr:`numpy.complex128`.
|
| The frequencies of the input assume standard order: along each axis
| first positive frequencies are assumed from 0 to the maximum, then
| negative frequencies are listed from the largest absolute value to
| smallest. This implies that the corners of the grid correspond to low
| frequencies, while the center of the grid corresponds to high
| frequencies.
|
| Parameters
| ----------
| x_cutoff : float
| The cutoff frequency for the x-axis.
|
| y_cutoff : float
| The cutoff frequency for the y-axis.
|
| z_cutoff : float
| The cutoff frequency for the z-axis.
|
| order : int, default: 1
| The order of the cutoff curve. Given from the equation
| ``1 + (cutoff/freq(i, j))**(2*order)``.
|
| output_scalars_name : str, optional
| The name of the output scalars. By default, this is the same as the
| active scalars of the dataset.
|
| progress_bar : bool, default: False
| Display a progress bar to indicate progress.
|
| Returns
| -------
| pyvista.ImageData
| :class:`pyvista.ImageData` with the applied low pass filter.
|
| See Also
| --------
| fft : Direct fast Fourier transform.
| rfft : Reverse fast Fourier transform.
| high_pass : High-pass filtering of FFT output.
|
| Examples
| --------
| See :ref:`image_fft_perlin_noise_example` for a full example using this filter.
|
| median_smooth(self, kernel_size=(3, 3, 3), scalars=None, preference='point', progress_bar: 'bool' = False)
| Smooth data using a median filter.
|
| The Median filter that replaces each pixel with the median value from a
| rectangular neighborhood around that pixel. Neighborhoods can be no
| more than 3 dimensional. Setting one axis of the neighborhood
| kernelSize to 1 changes the filter into a 2D median.
|
| See :vtk:`vtkImageMedian3D` for more details.
|
| Parameters
| ----------
| kernel_size : sequence[int], default: (3, 3, 3)
| Size of the kernel in each dimension (units of voxels), for example
| ``(x_size, y_size, z_size)``. Default is a 3D median filter. If you
| want to do a 2D median filter, set the size to 1 in the dimension
| you don't want to filter over.
|
| scalars : str, optional
| Name of scalars to process. Defaults to currently active scalars.
|
| preference : str, default: "point"
| When scalars is specified, this is the preferred array
| type to search for in the dataset. Must be either
| ``'point'`` or ``'cell'``.
|
| progress_bar : bool, default: False
| Display a progress bar to indicate progress.
|
| Returns
| -------
| pyvista.ImageData
| Uniform grid with smoothed scalars.
|
| Warnings
| --------
| Applying this filter to cell data will send the output to a new point
| array with the same name, overwriting any existing point data array
| with the same name.
|
| Examples
| --------
| First, create sample data to smooth. Here, we use
| :func:`pyvista.perlin_noise() <pyvista.core.utilities.features.perlin_noise>`
| to create meaningful data.
|
| >>> import numpy as np
| >>> import pyvista as pv
| >>> noise = pv.perlin_noise(0.1, (2, 5, 8), (0, 0, 0))
| >>> grid = pv.sample_function(
| ... noise, bounds=[0, 1, 0, 1, 0, 1], dim=(20, 20, 20)
| ... )
| >>> grid.plot(show_scalar_bar=False)
|
| Next, smooth the sample data.
|
| >>> smoothed = grid.median_smooth(kernel_size=(10, 10, 10))
| >>> smoothed.plot(show_scalar_bar=False)
|
| pad_image(self, pad_value: "float | VectorLike[float] | Literal['wrap', 'mirror']" = 0.0, *, pad_size: 'int | VectorLike[int]' = 1, dimensionality: "VectorLike[bool] | Literal[0, 1, 2, 3, '0D', '1D', '2D', '3D', 'preserve']" = 'preserve', scalars: 'str | None' = None, pad_all_scalars: 'bool' = False, progress_bar: 'bool' = False, pad_singleton_dims: 'bool | None' = None) -> 'pyvista.ImageData'
| Enlarge an image by padding its boundaries with new points.
|
| .. versionadded:: 0.44.0
|
| Padded points may be mirrored, wrapped, or filled with a constant value. By
| default, all boundaries of the image are padded with a single constant value.
|
| This filter is designed to work with 1D, 2D, or 3D image data and will only pad
| non-singleton dimensions unless otherwise specified.
|
| Parameters
| ----------
| pad_value : float | sequence[float] | 'mirror' | 'wrap', default: 0.0
| Padding value(s) given to new points outside the original image extent.
| Specify:
|
| - a number: New points are filled with the specified constant value.
| - a vector: New points are filled with the specified multi-component vector.
| - ``'wrap'``: New points are filled by wrapping around the padding axis.
| - ``'mirror'``: New points are filled by mirroring the padding axis.
|
| pad_size : int | sequence[int], default: 1
| Number of points to add to the image boundaries. Specify:
|
| - A single value to pad all boundaries equally.
| - Two values, one for each ``(X, Y)`` axis, to apply symmetric padding to
| each axis independently.
| - Three values, one for each ``(X, Y, Z)`` axis, to apply symmetric padding
| to each axis independently.
| - Four values, one for each ``(-X, +X, -Y, +Y)`` boundary, to apply
| padding to each boundary independently.
| - Six values, one for each ``(-X, +X, -Y, +Y, -Z, +Z)`` boundary, to apply
| padding to each boundary independently.
|
| dimensionality : VectorLike[bool], Literal[1, 2, 3, "1D", "2D", "3D", "preserve"]
| Control which dimensions will be padded by the filter.
| ``'preserve'`` is used by default.
|
| - Can be specified as a sequence of 3 boolean to apply padding on a per
| dimension basis.
| - ``1`` or ``'1D'``: apply padding such that the output is a 1D ImageData
| where exactly one dimension is greater than one, e.g. ``(>1, 1, 1)``.
| Only valid for 0D or 1D inputs.
| - ``2`` or ``'2D'``: apply padding such that the output is a 2D ImageData
| where exactly two dimensions are greater than one, e.g. ``(>1, >1, 1)``.
| Only valid for 0D, 1D, or 2D inputs.
| - ``3`` or ``'3D'``: apply padding such that the output is a 3D ImageData,
| where all three dimensions are greater than one, e.g. ``(>1, >1, >1)``.
| Valid for any 0D, 1D, 2D, or 3D inputs.
|
| .. note::
| The ``pad_size`` for singleton dimensions is set to ``0`` by default, even
| if non-zero pad sizes are specified for these axes with this parameter.
| Set ``dimensionality`` to a value different than ``'preserve'`` to
| override this behavior and enable padding any or all dimensions.
|
| .. versionadded:: 0.45.0
|
| scalars : str, optional
| Name of scalars to pad. Defaults to currently active scalars. Unless
| ``pad_all_scalars`` is ``True``, only the specified ``scalars`` are included
| in the output.
|
| pad_all_scalars : bool, default: False
| Pad all point data scalars and include them in the output. This is useful
| for padding images with multiple scalars. If ``False``, only the specified
| ``scalars`` are padded.
|
| progress_bar : bool, default: False
| Display a progress bar to indicate progress.
|
| pad_singleton_dims : bool, optional
| Control whether to pad singleton dimensions.
|
| .. deprecated:: 0.45.0
| Deprecated, use ``dimensionality='preserve'`` instead of
| ``pad_singleton_dims=True`` and ``dimensionality='3D'`` instead of
| ``pad_singleton_dims=False``.
|
| Estimated removal on v0.48.0.
|
| Returns
| -------
| pyvista.ImageData
| Padded image.
|
| See Also
| --------
| crop, resample, contour_labels
|
| Examples
| --------
| Pad a grayscale image with a 100-pixel wide border. The padding is black
| (i.e. has a value of ``0``) by default.
|
| >>> import pyvista as pv
| >>> from pyvista import examples
| >>>
| >>> gray_image = examples.download_moonlanding_image()
| >>> gray_image.dimensions
| (630, 474, 1)
| >>> padded = gray_image.pad_image(pad_size=100)
| >>> padded.dimensions
| (830, 674, 1)
|
| Plot the image. To show grayscale images correctly, we define a custom plotting
| method.
|
| >>> def grayscale_image_plotter(image):
| ... import vtk
| ...
| ... actor = vtk.vtkImageActor()
| ... actor.GetMapper().SetInputData(image)
| ... actor.GetProperty().SetInterpolationTypeToNearest()
| ... plot = pv.Plotter()
| ... plot.add_actor(actor)
| ... plot.view_xy()
| ... plot.camera.tight()
| ... return plot
| >>>
| >>> plot = grayscale_image_plotter(padded)
| >>> plot.show()
|
| Pad only the x-axis with a white border.
|
| >>> padded = gray_image.pad_image(pad_value=255, pad_size=(200, 0))
| >>> plot = grayscale_image_plotter(padded)
| >>> plot.show()
|
| Pad with wrapping.
|
| >>> padded = gray_image.pad_image('wrap', pad_size=100)
| >>> plot = grayscale_image_plotter(padded)
| >>> plot.show()
|
| Pad with mirroring.
|
| >>> padded = gray_image.pad_image('mirror', pad_size=100)
| >>> plot = grayscale_image_plotter(padded)
| >>> plot.show()
|
| Pad a color image using multi-component color vectors. Here, RGBA values are
| used.
|
| >>> color_image = examples.download_beach()
| >>> red = (255, 0, 0) # RGB
| >>> padded = color_image.pad_image(pad_value=red, pad_size=50)
| >>>
| >>> plot_kwargs = dict(cpos='xy', zoom='tight', rgb=True, show_axes=False)
| >>> padded.plot(**plot_kwargs)
|
| Pad each edge of the image separately with a different color.
|
| >>> orange = pv.Color('orange').int_rgb
| >>> purple = pv.Color('purple').int_rgb
| >>> blue = pv.Color('blue').int_rgb
| >>> green = pv.Color('green').int_rgb
| >>>
| >>> padded = color_image.pad_image(orange, pad_size=(25, 0, 0, 0))
| >>> padded = padded.pad_image(purple, pad_size=(0, 25, 0, 0))
| >>> padded = padded.pad_image(blue, pad_size=(0, 0, 25, 0))
| >>> padded = padded.pad_image(green, pad_size=(0, 0, 0, 25))
| >>>
| >>> padded.plot(**plot_kwargs)
|
| points_to_cells(self: 'ImageData', scalars: 'str | None' = None, *, dimensionality: "VectorLike[bool] | Literal[0, 1, 2, 3, '0D', '1D', '2D', '3D', 'preserve']" = 'preserve', copy: 'bool' = True)
| Re-mesh image data from a point-based to a cell-based representation.
|
| This filter changes how image data is represented. Data represented as points
| at the input is re-meshed into an alternative representation as cells at the
| output. Only the :class:`~pyvista.ImageData` container is modified so that
| the number of input points equals the number of output cells. The re-meshing is
| otherwise lossless in the sense that point data at the input is passed through
| unmodified and stored as cell data at the output. Any cell data at the input is
| ignored and is not used by this filter.
|
| To change the image data's representation, the input points are used to
| represent the centers of the output cells. This has the effect of "growing" the
| input image dimensions by one along each axis (i.e. half the cell width on each
| side). For example, an image with 100 points and 99 cells along an axis at the
| input will have 101 points and 100 cells at the output. If the input has 1mm
| spacing, the axis size will also increase from 99mm to 100mm. By default,
| only non-singleton dimensions are increased such that 1D or 2D inputs remain
| 1D or 2D at the output.
|
| Since filters may be inherently cell-based (e.g. some :class:`~pyvista.DataSetFilters`)
| or may operate on point data exclusively (e.g. most :class:`~pyvista.ImageDataFilters`),
| re-meshing enables the same data to be used with either kind of filter while
| ensuring the input data to those filters has the appropriate representation.
| This filter is also useful when plotting image data to achieve a desired visual
| effect, such as plotting images as voxel cells instead of as points.
|
| .. note::
| Only the input's :attr:`~pyvista.ImageData.dimensions`, and
| :attr:`~pyvista.ImageData.origin` are modified by this filter. Other spatial
| properties such as :attr:`~pyvista.ImageData.spacing` and
| :attr:`~pyvista.ImageData.direction_matrix` are not affected.
|
| .. versionadded:: 0.44.0
|
| See Also
| --------
| cells_to_points
| Inverse of this filter to represent cells as points.
| :meth:`~pyvista.DataObjectFilters.cell_data_to_point_data`
| Resample point data as cell data without modifying the container.
| :meth:`~pyvista.DataObjectFilters.cell_data_to_point_data`
| Resample cell data as point data without modifying the container.
|
| Parameters
| ----------
| scalars : str, optional
| Name of point data scalars to pass through to the output as cell data. Use
| this parameter to restrict the output to only include the specified array.
| By default, all point data arrays at the input are passed through as cell
| data at the output.
|
| dimensionality : VectorLike[bool], Literal[0, 1, 2, 3, "0D", "1D", "2D", "3D", "preserve"]
| Control which dimensions will be modified by the filter.
| ``'preserve'`` is used by default.
|
| - Can be specified as a sequence of 3 boolean to allow modification on a per
| dimension basis.
| - ``0`` or ``'0D'``: convenience alias to output a 0D ImageData with
| dimensions ``(1, 1, 1)``. Only valid for 0D inputs.
| - ``1`` or ``'1D'``: convenience alias to output a 1D ImageData where
| exactly one dimension is greater than one, e.g. ``(>1, 1, 1)``. Only valid
| for 0D or 1D inputs.
| - ``2`` or ``'2D'``: convenience alias to output a 2D ImageData where
| exactly two dimensions are greater than one, e.g. ``(>1, >1, 1)``. Only
| valid for 0D, 1D, or 2D inputs.
| - ``3`` or ``'3D'``: convenience alias to output a 3D ImageData, where all
| three dimensions are greater than one, e.g. ``(>1, >1, >1)``. Valid for
| any 0D, 1D, 2D, or 3D inputs.
| - ``'preserve'`` (default): convenience alias to not modify singleton
| dimensions.
|
| copy : bool, default: True
| Copy the input point data before associating it with the output cell data.
| If ``False``, the input and output will both refer to the same data array(s).
|
| Returns
| -------
| pyvista.ImageData
| Image with a cell-based representation.
|
| Examples
| --------
| Load an image with point data.
|
| >>> from pyvista import examples
| >>> image = examples.load_uniform()
|
| Show the current properties and point arrays of the image.
|
| >>> image
| ImageData (...)
| N Cells: 729
| N Points: 1000
| X Bounds: 0.000e+00, 9.000e+00
| Y Bounds: 0.000e+00, 9.000e+00
| Z Bounds: 0.000e+00, 9.000e+00
| Dimensions: 10, 10, 10
| Spacing: 1.000e+00, 1.000e+00, 1.000e+00
| N Arrays: 2
|
| >>> image.point_data.keys()
| ['Spatial Point Data']
|
| Re-mesh the points and point data as cells and cell data.
|
| >>> cells_image = image.points_to_cells()
|
| Show the properties and cell arrays of the re-meshed image.
|
| >>> cells_image
| ImageData (...)
| N Cells: 1000
| N Points: 1331
| X Bounds: -5.000e-01, 9.500e+00
| Y Bounds: -5.000e-01, 9.500e+00
| Z Bounds: -5.000e-01, 9.500e+00
| Dimensions: 11, 11, 11
| Spacing: 1.000e+00, 1.000e+00, 1.000e+00
| N Arrays: 1
|
| >>> cells_image.cell_data.keys()
| ['Spatial Point Data']
|
| Observe that:
|
| - The input point array is now a cell array
| - The output has one less array (the input cell data is ignored)
| - The dimensions have increased by one
| - The bounds have increased by half the spacing
| - The output ``N Cells`` equals the input ``N Points``
|
| Since the input points are 3D (i.e. there are no singleton dimensions), the
| output cells are 3D :attr:`~pyvista.CellType.VOXEL` cells.
|
| >>> cells_image.get_cell(0).type
| <CellType.VOXEL: 11>
|
| If the input points are 2D (i.e. one dimension is singleton), the
| output cells are 2D :attr:`~pyvista.CellType.PIXEL` cells when ``dimensions`` is
| set to ``'preserve'``.
|
| >>> image2D = examples.download_beach()
| >>> image2D.dimensions
| (100, 100, 1)
|
| >>> pixel_cells_image = image2D.points_to_cells(dimensionality='preserve')
| >>> pixel_cells_image.dimensions
| (101, 101, 1)
| >>> pixel_cells_image.get_cell(0).type
| <CellType.PIXEL: 8>
|
| This is equivalent as requesting a 2D output.
|
| >>> pixel_cells_image = image2D.points_to_cells(dimensionality='2D')
| >>> pixel_cells_image.dimensions
| (101, 101, 1)
| >>> pixel_cells_image.get_cell(0).type
| <CellType.PIXEL: 8>
|
| Use ``(True, True, True)`` to re-mesh 2D points as 3D cells.
|
| >>> voxel_cells_image = image2D.points_to_cells(
| ... dimensionality=(True, True, True)
| ... )
| >>> voxel_cells_image.dimensions
| (101, 101, 2)
| >>> voxel_cells_image.get_cell(0).type
| <CellType.VOXEL: 11>
|
| Or request a 3D output.
|
| >>> voxel_cells_image = image2D.points_to_cells(dimensionality='3D')
| >>> voxel_cells_image.dimensions
| (101, 101, 2)
| >>> voxel_cells_image.get_cell(0).type
| <CellType.VOXEL: 11>
|
| See :ref:`image_representations_example` for more examples using this filter.
|
| resample(self: 'ImageData', sample_rate: 'float | VectorLike[float] | None' = None, interpolation: "Literal['nearest', 'linear', 'cubic', 'lanczos', 'hamming', 'blackman']" = 'nearest', *, reference_image: 'ImageData | None' = None, dimensions: 'VectorLike[int] | None' = None, anti_aliasing: 'bool' = False, extend_border: 'bool | None' = None, scalars: 'str | None' = None, preference: "Literal['point', 'cell']" = 'point', inplace: 'bool' = False, progress_bar: 'bool' = False)
| Resample the image to modify its dimensions and spacing.
|
| The resampling can be controlled in several ways:
|
| #. Specify the output geometry using a ``reference_image``.
|
| #. Specify the ``dimensions`` explicitly.
|
| #. Specify the ``sample_rate`` explicitly.
|
| Use ``reference_image`` for full control of the resampled geometry. For
| all other options, the geometry is implicitly defined such that the resampled
| image fits the bounds of the input.
|
| This filter may be used to resample either point or cell data. For point data,
| this filter assumes the data is from discrete samples in space which represent
| pixels or voxels; the resampled bounds are therefore extended by 1/2 voxel
| spacing by default though this may be disabled.
|
| .. note::
|
| Singleton dimensions are not resampled by this filter, e.g. 2D images
| will remain 2D.
|
| .. versionadded:: 0.45
|
| Parameters
| ----------
| sample_rate : float | VectorLike[float], optional
| Sampling rate(s) to use. Can be a single value or vector of three values
| for each axis. Values greater than ``1.0`` will up-sample the axis and
| values less than ``1.0`` will down-sample it. Values must be greater than ``0``.
|
| interpolation : 'nearest' | 'linear' | 'cubic', 'lanczos', 'hamming', 'blackman'
| Interpolation mode to use. By default, ``'nearest'`` is used which
| duplicates (if upsampling) or removes (if downsampling) values but
| does not modify them. The ``'linear'`` and ``'cubic'`` modes use linear
| and cubic interpolation, respectively, and may modify the values. The
| ``'lanczos'``, ``'hamming'``, and ``'blackman'`` use a windowed sinc filter
| and may be used to preserve sharp details and/or reduce image artifacts.
|
| .. note::
|
| - use ``'nearest'`` for pixel art or categorical data such as segmentation masks
| - use ``'linear'`` for speed-critical tasks
| - use ``'cubic'`` for upscaling or general-purpose resampling
| - use ``'lanczos'`` for high-detail downsampling (at the cost of some ringing)
| - use ``'blackman'`` for minimizing ringing artifacts (at the cost of some detail)
| - use ``'hamming'`` for a balance between detail-preservation and reducing ringing
|
| reference_image : ImageData, optional
| Reference image to use. If specified, the input is resampled
| to match the geometry of the reference. The :attr:`~pyvista.ImageData.dimensions`,
| :attr:`~pyvista.ImageData.spacing`, :attr:`~pyvista.ImageData.origin`,
| :attr:`~pyvista.ImageData.offset`, and :attr:`~pyvista.ImageData.direction_matrix`
| of the resampled image will all match the reference image.
|
| dimensions : VectorLike[int]
| Set the output :attr:`~pyvista.ImageData.dimensions` of the resampled image.
|
| .. note::
|
| Dimensions is the number of `points` along each axis. If resampling
| `cell` data, each dimension should be one more than the number of
| desired output cells (since there are ``N`` cells and ``N+1`` points
| along each axis). See examples.
|
| anti_aliasing : bool, default: False
| Enable antialiasing. This will blur the image as part of the resampling
| to reduce image artifacts when down-sampling. Has no effect when up-sampling.
|
| extend_border : bool, optional
| Extend the apparent input border by approximately half the
| :attr:`~pyvista.ImageData.spacing`. If enabled, the bounds of the
| resampled points will be larger than the input image bounds.
| Enabling this option also has the effect that the re-sampled spacing
| will directly correlate with the resampled dimensions, e.g. if
| the dimensions are doubled the spacing will be halved. See examples.
|
| This option is enabled by default when resampling point data. Has no effect
| when resampling cell data or when a ``reference_image`` is provided.
|
| scalars : str, optional
| Name of scalars to resample. Defaults to currently active scalars.
|
| preference : str, default: 'point'
| When scalars is specified, this is the preferred array type to search
| for in the dataset. Must be either ``'point'`` or ``'cell'``.
|
| inplace : bool, default: False
| If ``True``, resample the image inplace. By default, a new
| :class:`~pyvista.ImageData` instance is returned.
|
| progress_bar : bool, default: False
| Display a progress bar to indicate progress.
|
| Returns
| -------
| ImageData
| Resampled image.
|
| See Also
| --------
| crop
| Crop image to remove points at the image's boundaries.
|
| :meth:`~pyvista.DataObjectFilters.sample`
| Resample array data from one mesh onto another.
|
| :meth:`~pyvista.DataSetFilters.interpolate`
| Interpolate values from one mesh onto another.
|
| :ref:`image_representations_example`
| Compare images represented as points vs. cells.
|
| Examples
| --------
| Create a small 2D grayscale image with dimensions ``3 x 2`` for demonstration.
|
| >>> import pyvista as pv
| >>> import numpy as np
| >>> from pyvista import examples
| >>> image = pv.ImageData(dimensions=(3, 2, 1))
| >>> image.point_data['data'] = np.linspace(0, 255, 6, dtype=np.uint8)
|
| Define a custom plotter to show the image. Although the image data is defined
| as point data, we use :meth:`points_to_cells` to display the image as
| :attr:`~pyvista.CellType.PIXEL` (or :attr:`~pyvista.CellType.VOXEL`) cells
| instead. Grayscale coloring is used and the camera is adjusted to fit the image.
|
| >>> def image_plotter(image: pv.ImageData) -> pv.Plotter:
| ... pl = pv.Plotter()
| ... image = image.points_to_cells()
| ... pl.add_mesh(
| ... image,
| ... lighting=False,
| ... show_edges=True,
| ... cmap='grey',
| ... show_scalar_bar=False,
| ... )
| ... pl.view_xy()
| ... pl.camera.tight()
| ... return pl
|
| Show the image.
|
| >>> plot = image_plotter(image)
| >>> plot.show()
|
| Use ``sample_rate`` to up-sample the image. ``'nearest'`` interpolation is
| used by default.
|
| >>> upsampled = image.resample(sample_rate=2.0)
| >>> plot = image_plotter(upsampled)
| >>> plot.show()
|
| Use ``'linear'`` interpolation. Note that the argument names ``sample_rate``
| and ``interpolation`` may be omitted.
|
| >>> upsampled = image.resample(2.0, 'linear')
| >>> plot = image_plotter(upsampled)
| >>> plot.show()
|
| Use ``'cubic'`` interpolation. Here we also specify the output
| ``dimensions`` explicitly instead of using ``sample_rate``.
|
| >>> upsampled = image.resample(dimensions=(6, 4, 1), interpolation='cubic')
| >>> plot = image_plotter(upsampled)
| >>> plot.show()
|
| Compare the relative physical size of the image before and after resampling.
|
| >>> image
| ImageData (...)
| N Cells: 2
| N Points: 6
| X Bounds: 0.000e+00, 2.000e+00
| Y Bounds: 0.000e+00, 1.000e+00
| Z Bounds: 0.000e+00, 0.000e+00
| Dimensions: 3, 2, 1
| Spacing: 1.000e+00, 1.000e+00, 1.000e+00
| N Arrays: 1
|
| >>> upsampled
| ImageData (...)
| N Cells: 15
| N Points: 24
| X Bounds: -2.500e-01, 2.250e+00
| Y Bounds: -2.500e-01, 1.250e+00
| Z Bounds: 0.000e+00, 0.000e+00
| Dimensions: 6, 4, 1
| Spacing: 5.000e-01, 5.000e-01, 1.000e+00
| N Arrays: 1
|
| Note that the upsampled :attr:`~pyvista.ImageData.dimensions` are doubled and
| the :attr:`~pyvista.ImageData.spacing` is halved (as expected). Also note,
| however, that the physical bounds of the input differ from the output.
| The upsampled :attr:`~pyvista.ImageData.origin` also differs:
|
| >>> image.origin
| (0.0, 0.0, 0.0)
| >>> upsampled.origin
| (-0.25, -0.25, 0.0)
|
| This is because the resampling is done with ``extend_border`` enabled by default
| which adds a half cell-width border to the image and adjusts the origin and
| spacing such that the bounds match when the image is represented as cells.
|
| Apply :meth:`points_to_cells` to the input and resampled images and show that
| the bounds match.
|
| >>> image_as_cells = image.points_to_cells()
| >>> image_as_cells.bounds
| BoundsTuple(x_min = -0.5,
| x_max = 2.5,
| y_min = -0.5,
| y_max = 1.5,
| z_min = 0.0,
| z_max = 0.0)
|
| >>> upsampled_as_cells = upsampled.points_to_cells()
| >>> upsampled_as_cells.bounds
| BoundsTuple(x_min = -0.5,
| x_max = 2.5,
| y_min = -0.5,
| y_max = 1.5,
| z_min = 0.0,
| z_max = 0.0)
|
| Plot the two images together as wireframe to visualize them. The original is in
| red, and the resampled image is in black.
|
| >>> plt = pv.Plotter()
| >>> _ = plt.add_mesh(
| ... image_as_cells, style='wireframe', color='red', line_width=10
| ... )
| >>> _ = plt.add_mesh(
| ... upsampled_as_cells, style='wireframe', color='black', line_width=2
| ... )
| >>> plt.view_xy()
| >>> plt.camera.tight()
| >>> plt.show()
|
| Disable ``extend_border`` to force the input and output bounds of the points
| to be the same instead.
|
| >>> upsampled = image.resample(sample_rate=2, extend_border=False)
|
| Compare the two images again.
|
| >>> image
| ImageData (...)
| N Cells: 2
| N Points: 6
| X Bounds: 0.000e+00, 2.000e+00
| Y Bounds: 0.000e+00, 1.000e+00
| Z Bounds: 0.000e+00, 0.000e+00
| Dimensions: 3, 2, 1
| Spacing: 1.000e+00, 1.000e+00, 1.000e+00
| N Arrays: 1
|
| >>> upsampled
| ImageData (...)
| N Cells: 15
| N Points: 24
| X Bounds: 0.000e+00, 2.000e+00
| Y Bounds: 0.000e+00, 1.000e+00
| Z Bounds: 0.000e+00, 0.000e+00
| Dimensions: 6, 4, 1
| Spacing: 4.000e-01, 3.333e-01, 1.000e+00
| N Arrays: 1
|
| This time the input and output bounds match without any further processing.
| Like before, the dimensions have doubled; unlike before, however, the spacing is
| not halved, but is instead smaller than half which is necessary to ensure the
| bounds remain the same. Also unlike before, the origin is unaffected:
|
| >>> image.origin
| (0.0, 0.0, 0.0)
| >>> upsampled.origin
| (0.0, 0.0, 0.0)
|
| All the above examples are with 2D images with point data. However, the filter
| also works with 3D volumes and will also work with cell data.
|
| Convert the 2D image with point data into a 3D volume with cell data and plot
| it for context.
|
| >>> volume = image.points_to_cells(dimensionality='3D')
| >>> volume.plot(show_edges=True, cmap='grey')
|
| Up-sample the volume. Set the sampling rate for each axis separately.
|
| >>> resampled = volume.resample(sample_rate=(3.0, 2.0, 1.0))
| >>> resampled.plot(show_edges=True, cmap='grey')
|
| Alternatively, we could have set the dimensions explicitly. Since we want
| ``9 x 4 x 1`` cells along the x-y-z axes (respectively), we set the dimensions
| to ``(10, 5, 2)``, i.e. one more than the desired number of cells.
|
| >>> resampled = volume.resample(dimensions=(10, 5, 2))
| >>> resampled.plot(show_edges=True, cmap='grey')
|
| Compare the bounds before and after resampling. Unlike with point data, the
| bounds are not (and cannot be) extended.
|
| >>> volume.bounds
| BoundsTuple(x_min = -0.5,
| x_max = 2.5,
| y_min = -0.5,
| y_max = 1.5,
| z_min = -0.5,
| z_max = 0.5)
| >>> resampled.bounds
| BoundsTuple(x_min = -0.5,
| x_max = 2.5,
| y_min = -0.5,
| y_max = 1.5,
| z_min = -0.5,
| z_max = 0.5)
|
| Use a reference image to control the resampling instead. Here we load two
| images with different dimensions:
| :func:`~pyvista.examples.downloads.download_puppy` and
| :func:`~pyvista.examples.downloads.download_gourds`.
|
| >>> puppy = examples.download_puppy()
| >>> puppy.dimensions
| (1600, 1200, 1)
|
| >>> gourds = examples.download_gourds()
| >>> gourds.dimensions
| (640, 480, 1)
|
| Use ``reference_image`` to resample the puppy to match the gourds geometry or
| vice-versa.
|
| >>> puppy_resampled = puppy.resample(reference_image=gourds)
| >>> puppy_resampled.dimensions
| (640, 480, 1)
|
| >>> gourds_resampled = gourds.resample(reference_image=puppy)
| >>> gourds_resampled.dimensions
| (1600, 1200, 1)
|
| Downsample the puppy image to 1/10th its original resolution using ``'lanczos'``
| interpolation.
|
| >>> downsampled = puppy.resample(0.1, 'lanczos')
| >>> downsampled.dimensions
| (160, 120, 1)
|
| Compare the downsampled image to the original and zoom in to show detail.
|
| >>> def compare_images_plotter(image1, image2):
| ... plt = pv.Plotter(shape=(1, 2))
| ... _ = plt.add_mesh(image1, rgba=True, show_edges=False, lighting=False)
| ... plt.subplot(0, 1)
| ... _ = plt.add_mesh(image2, rgba=True, show_edges=False, lighting=False)
| ... plt.link_views()
| ... plt.view_xy()
| ... plt.camera.zoom(3.0)
| ... return plt
|
| >>> plt = compare_images_plotter(puppy, downsampled)
| >>> plt.show()
|
| Note that downsampling can create image artifacts caused by aliasing. Enable
| anti-aliasing to smooth the image before resampling.
|
| >>> downsampled2 = puppy.resample(0.1, 'lanczos', anti_aliasing=True)
|
| Compare down-sampling with aliasing (left) to without aliasing (right).
|
| >>> plt = compare_images_plotter(downsampled, downsampled2)
| >>> plt.show()
|
| rfft(self, output_scalars_name=None, progress_bar: 'bool' = False)
| Apply a reverse fast Fourier transform (RFFT) to the active scalars.
|
| The input can be real or complex data, but the output is always
| :attr:`numpy.complex128`. The filter is fastest for images that have power
| of two sizes.
|
| The filter uses a butterfly diagram for each prime factor of the
| dimension. This makes images with prime number dimensions (i.e. 17x17)
| much slower to compute. FFTs of multidimensional meshes (i.e volumes)
| are decomposed so that each axis executes serially.
|
| The frequencies of the input assume standard order: along each axis
| first positive frequencies are assumed from 0 to the maximum, then
| negative frequencies are listed from the largest absolute value to
| smallest. This implies that the corners of the grid correspond to low
| frequencies, while the center of the grid corresponds to high
| frequencies.
|
| Parameters
| ----------
| output_scalars_name : str, optional
| The name of the output scalars. By default, this is the same as the
| active scalars of the dataset.
|
| progress_bar : bool, default: False
| Display a progress bar to indicate progress.
|
| Returns
| -------
| pyvista.ImageData
| :class:`pyvista.ImageData` with the applied reverse FFT.
|
| See Also
| --------
| fft : The direct transform.
| low_pass : Low-pass filtering of FFT output.
| high_pass : High-pass filtering of FFT output.
|
| Examples
| --------
| Apply reverse FFT to an example image.
|
| >>> from pyvista import examples
| >>> image = examples.download_moonlanding_image()
| >>> fft_image = image.fft()
| >>> image_again = fft_image.rfft()
| >>> image_again.point_data # doctest:+SKIP
| pyvista DataSetAttributes
| Association : POINT
| Active Scalars : PNGImage
| Active Vectors : None
| Active Texture : None
| Active Normals : None
| Contains arrays :
| PNGImage complex128 (298620,) SCALARS
|
| See :ref:`image_fft_example` for a full example using this filter.
|
| select_values(self: 'ImageData', values: 'float | VectorLike[float] | MatrixLike[float] | dict[str, float] | dict[float, str] | None' = None, *, ranges: 'VectorLike[float] | MatrixLike[float] | dict[str, VectorLike[float]] | dict[tuple[float, float], str] | None' = None, fill_value: 'float | VectorLike[float]' = 0, replacement_value: 'float | VectorLike[float] | None' = None, scalars: 'str | None' = None, preference: "Literal['point', 'cell']" = 'point', component_mode: "Literal['any', 'all', 'multi'] | int" = 'all', invert: 'bool' = False, split: 'bool' = False)
| Select values of interest and fill the rest with a constant.
|
| Point or cell data may be selected with a single value, multiple values, a range
| of values, or any mix of values and ranges. This enables threshold-like
| filtering of data in a discontinuous manner to select a single label or groups
| of labels from categorical data, or to select multiple regions from continuous
| data. Selected values may optionally be split into separate meshes.
|
| The selected values are stored in an array with the same name as the input.
|
| .. versionadded:: 0.45
|
| Parameters
| ----------
| values : float | ArrayLike[float] | dict, optional
| Value(s) to select. Can be a number, an iterable of numbers, or a dictionary
| with numeric entries. For ``dict`` inputs, either its keys or values may be
| numeric, and the other field must be strings. The numeric field is used as
| the input for this parameter, and if ``split`` is ``True``, the string field
| is used to set the block names of the returned :class:`~pyvista.MultiBlock`.
|
| .. note::
| When selecting multi-component values with ``component_mode=multi``,
| each value is specified as a multi-component scalar. In this case,
| ``values`` can be a single vector or an array of row vectors.
|
| ranges : ArrayLike[float] | dict, optional
| Range(s) of values to select. Can be a single range (i.e. a sequence of
| two numbers in the form ``[lower, upper]``), a sequence of ranges, or a
| dictionary with range entries. Any combination of ``values`` and ``ranges``
| may be specified together. The endpoints of the ranges are included in the
| selection. Ranges cannot be set when ``component_mode=multi``.
|
| For ``dict`` inputs, either its keys or values may be numeric, and the other
| field must be strings. The numeric field is used as the input for this
| parameter, and if ``split`` is ``True``, the string field is used to set the
| block names of the returned :class:`~pyvista.MultiBlock`.
|
| .. note::
| Use ``+/-`` infinity to specify an unlimited bound, e.g.:
|
| - ``[0, float('inf')]`` to select values greater than or equal to zero.
| - ``[float('-inf'), 0]`` to select values less than or equal to zero.
|
| fill_value : float | VectorLike[float], default: 0
| Value used to fill the image. Can be a single value or a multi-component
| vector. Non-selected parts of the image will have this value.
|
| replacement_value : float | VectorLike[float], optional
| Replacement value for the output array. Can be a single value or a
| multi-component vector. If provided, selected values will be replaced with
| the given value. If no value is given, the selected values are retained and
| returned as-is. Setting this value is useful for generating a binarized
| output array.
|
| scalars : str, optional
| Name of scalars to select from. Defaults to currently active scalars.
|
| preference : str, default: 'point'
| When ``scalars`` is specified, this is the preferred array type to search
| for in the dataset. Must be either ``'point'`` or ``'cell'``.
|
| component_mode : int | 'any' | 'all' | 'multi', default: 'all'
| Specify the component(s) to use when ``scalars`` is a multi-component array.
| Has no effect when the scalars have a single component. Must be one of:
|
| - number: specify the component number as a 0-indexed integer. The selected
| component must have the specified value(s).
| - ``'any'``: any single component can have the specified value(s).
| - ``'all'``: all individual components must have the specified values(s).
| - ``'multi'``: the entire multi-component item must have the specified value.
|
| invert : bool, default: False
| Invert the selection. If ``True`` values are selected which do *not* have
| the specified values.
|
| split : bool, default: False
| If ``True``, each value in ``values`` and each range in ``range`` is
| selected independently and returned as a :class:`~pyvista.MultiBlock`.
| The number of blocks returned equals the number of input values and ranges.
| The blocks may be named if a dictionary is used as input. See ``values``
| and ``ranges`` for details.
|
| .. note::
| Output blocks may contain meshes with only the ``fill_value`` if no
| values meet the selection criteria.
|
| See Also
| --------
| image_threshold
| Similar filter for thresholding :class:`~pyvista.ImageData`.
| :meth:`~pyvista.DataSetFilters.extract_values`
| Similar threshold-like filter for extracting values from any dataset.
| :meth:`~pyvista.DataSetFilters.split_values`
| Split a mesh by value into separate meshes.
| :meth:`~pyvista.DataSetFilters.threshold`
| Generalized thresholding filter which returns a :class:`~pyvista.UnstructuredGrid`.
|
| Returns
| -------
| pyvista.ImageData or pyvista.MultiBlock
| Image with selected values or a composite of meshes with selected
| values, depending on ``split``.
|
| Examples
| --------
| Load a CT image. Here we load
| :func:`~pyvista.examples.downloads.download_whole_body_ct_male`.
|
| >>> import pyvista as pv
| >>> from pyvista import examples
| >>> dataset = examples.download_whole_body_ct_male()
| >>> ct_image = dataset['ct']
|
| Show the initial data range.
|
| >>> ct_image.get_data_range()
| (np.int16(-1348), np.int16(3409))
|
| Select intensity values above ``150`` to select the bones.
|
| >>> bone_range = [150, float('inf')]
| >>> fill_value = -1000 # fill with intensity values corresponding to air
| >>> bone_image = ct_image.select_values(
| ... ranges=bone_range, fill_value=fill_value
| ... )
|
| Show the new data range.
|
| >>> bone_image.get_data_range()
| (np.int16(-1000), np.int16(3409))
|
| Plot the selected values. Use ``'foreground'`` opacity to make the fill value
| transparent and the selected values opaque.
|
| >>> pl = pv.Plotter()
| >>> _ = pl.add_volume(
| ... bone_image,
| ... opacity='foreground',
| ... cmap='bone',
| ... )
| >>> pl.view_zx()
| >>> pl.camera.up = (0, 0, 1)
| >>> pl.show()
|
| Use ``'replacement_value'`` to binarize the selected values instead. The fill
| value, or background, is ``0`` by default.
|
| >>> bone_mask = ct_image.select_values(ranges=bone_range, replacement_value=1)
| >>> bone_mask.get_data_range()
| (np.int16(0), np.int16(1))
|
| Generate a surface contour of the mask and plot it.
|
| >>> surf = bone_mask.contour_labels()
|
| >>> pl = pv.Plotter()
| >>> _ = pl.add_mesh(surf, color=True)
| >>> pl.view_zx()
| >>> pl.camera.up = (0, 0, 1)
| >>> pl.show()
|
| Load a color image. Here we load :func:`~pyvista.examples.downloads.download_beach`.
|
| >>> image = examples.download_beach()
| >>> plot_kwargs = dict(
| ... cpos='xy', rgb=True, lighting=False, zoom='tight', show_axes=False
| ... )
| >>> image.plot(**plot_kwargs)
|
| Select components from the image which have a strong red component.
| Use ``replacement_value`` to replace these pixels with a pure red color
| and ``fill_value`` to fill the rest of the image with white pixels.
|
| >>> white = [255, 255, 255]
| >>> red = [255, 0, 0]
| >>> red_range = [200, 255]
| >>> red_component = 0
| >>> selected = image.select_values(
| ... ranges=red_range,
| ... component_mode=red_component,
| ... replacement_value=red,
| ... fill_value=white,
| ... )
|
| >>> selected.plot(**plot_kwargs)
|
| slice_index(self: 'ImageData', i: 'int | VectorLike[int] | slice | None' = None, j: 'int | VectorLike[int] | slice | None' = None, k: 'int | VectorLike[int] | slice | None' = None, *, index_mode: "Literal['extent', 'dimensions']" = 'dimensions', strict_index: 'bool' = False, rebase_coordinates: 'bool' = False, progress_bar: 'bool' = False) -> 'ImageData'
| Extract a subset using IJK indices.
|
| This filter enables slicing :class:`~pyvista.ImageData` with Python-style indexing using
| IJK coordinates. It can be used to extract a single slice, multiple contiguous slices, or
| a volume of interest. Unlike other slicing filters, this filter returns
| :class:`~pyvista.ImageData`.
|
| .. note::
| Slicing by index is also possible using the "get index" operator ``[]``. See examples.
|
| .. versionadded::0.46
|
| Parameters
| ----------
| i, j, k : int | VectorLike[int] | slice, optional
| Indices to slice along the I, J, and K coordinate axes, respectively. Specify an
| integer for a single index, or two integers ``[start, stop)`` for a range of indices.
|
| .. note::
|
| Like regular Python slicing:
|
| - Half-open intervals are used, i.e. the ``start`` index is included in the range
| but the ``stop`` index is not.
| - Negative indexing is supported.
| - An ``IndexError`` is raised when a single integer is specified as the index and
| the index is out-of-bounds.
| - An ``IndexError`` is `not` raised when a range is specified as the index and
| the index is out-of-bounds. This default can be overridden by setting
| ``strict_index=True``.
| - A copy of the data is returned (modifying the sliced output does `not` affect
| the input data).
|
| index_mode : 'extent' | 'dimensions', default: 'dimensions'
| Mode to use when determining the range of values to index from.
|
| - Use ``'dimensions'`` to index values in the range ``[0, dimensions - 1]``.
| - Use ``'extent'`` to index values based on the :class:`~pyvista.ImageData.extent`,
| i.e. ``[offset, offset + dimensions - 1]``.
|
| The main difference between these modes is the inclusion or exclusion of the
| :attr:`~pyvista.ImageData.offset`. ``dimensions`` is more pythonic and is how the
| object's data arrays themselves would be indexed, whereas ``'extent'`` respects VTK's
| definition of ``extent`` and considers the object's geometry.
|
| strict_index : bool, default: False
| Raise an ``IndexError`` if `any` of the indices are out of range. By default, an
| ``IndexError`` is only raised if a single integer index is out of range, but not when
| a range of indices are specified; set this to ``True`` to raise in error in both cases.
|
| rebase_coordinates : bool, default: False
| Rebase the coordinate reference of the extracted subset:
|
| - the :attr:`~pyvista.ImageData.origin` is set to the minimum bounds of the subset
| - the :attr:`~pyvista.ImageData.offset` is reset to ``(0, 0, 0)``
|
| The rebasing effectively applies a positive translation in world (XYZ) coordinates and
| a similar (i.e. inverse) negative translation in voxel (IJK) coordinates. As a result,
| the :attr:`~pyvista.DataSet.bounds` of the output are unchanged, but the coordinate
| reference frame is modified.
|
| Set this to ``False`` to leave the origin unmodified and keep the offset specified by
| the indexing.
|
| progress_bar : bool, default: False
| Display a progress bar to indicate progress.
|
| Returns
| -------
| ImageData
| Sliced mesh.
|
| See Also
| --------
| crop
| extract_subset
| :meth:`~pyvista.DataObjectFilters.slice`
| :meth:`~pyvista.DataObjectFilters.slice_implicit`
| :meth:`~pyvista.DataObjectFilters.slice_orthogonal`
| :meth:`~pyvista.DataObjectFilters.slice_along_axis`
| :meth:`~pyvista.DataObjectFilters.slice_along_line`
|
| Examples
| --------
| Create a :class:`~pyvista.ImageData` mesh and give it some point data.
|
| >>> import pyvista as pv
| >>> mesh = pv.ImageData(dimensions=(10, 10, 10))
| >>> mesh['data'] = range(mesh.n_points)
|
| Extract a single slice along the k-axis.
|
| >>> sliced = mesh.slice_index(k=5)
| >>> sliced.dimensions
| (10, 10, 1)
|
| Equivalently:
|
| >>> sliced2 = mesh[:, :, 5]
| >>> sliced == sliced2
| True
|
| Extract a volume of interest.
|
| >>> sliced = mesh.slice_index(i=[1, 3], j=[2, 5], k=[5, 10])
| >>> sliced.dimensions
| (2, 3, 5)
|
| Equivalently:
|
| >>> sliced2 = mesh[1:3, 2:5, 5:10]
| >>> sliced == sliced2
| True
|
| Use ``None`` to implicitly define the start and/or stop indices.
|
| >>> sliced = mesh.slice_index(i=[None, 3], j=[2, None], k=None)
| >>> sliced.dimensions
| (3, 8, 10)
|
| Equivalently:
|
| >>> sliced2 = mesh[:3, 2:, :]
| >>> sliced == sliced2
| True
|
| See :ref:`slice_example` for more examples using this filter.
|
| ----------------------------------------------------------------------
| Methods inherited from pyvista.core.filters.data_set.DataSetFilters:
|
| __add__(self: '_DataSetType', dataset)
| Combine this mesh with another into a :class:`pyvista.UnstructuredGrid`.
|
| __iadd__(self: '_DataSetType', dataset)
| Merge another mesh into this one if possible.
|
| "If possible" means that ``self`` is a :class:`pyvista.UnstructuredGrid`.
| Otherwise we have to return a new object, and the attempted in-place
| merge will raise.
|
| align(self: '_DataSetType', target: 'DataSet | _vtk.vtkDataSet', max_landmarks: 'int' = 100, max_mean_distance: 'float' = 1e-05, max_iterations: 'int' = 500, check_mean_distance: 'bool' = True, start_by_matching_centroids: 'bool' = True, return_matrix: 'bool' = False)
| Align a dataset to another.
|
| Uses the iterative closest point algorithm to align the points of the
| two meshes. See the VTK class :vtk:`vtkIterativeClosestPointTransform`.
|
| Parameters
| ----------
| target : pyvista.DataSet
| The target dataset to align to.
|
| max_landmarks : int, default: 100
| The maximum number of landmarks.
|
| max_mean_distance : float, default: 1e-5
| The maximum mean distance for convergence.
|
| max_iterations : int, default: 500
| The maximum number of iterations.
|
| check_mean_distance : bool, default: True
| Whether to check the mean distance for convergence.
|
| start_by_matching_centroids : bool, default: True
| Whether to start the alignment by matching centroids. Default is True.
|
| return_matrix : bool, default: False
| Return the transform matrix as well as the aligned mesh.
|
| Returns
| -------
| aligned : pyvista.DataSet
| The dataset aligned to the target mesh.
|
| matrix : numpy.ndarray
| Transform matrix to transform the input dataset to the target dataset.
|
| See Also
| --------
| align_xyz
| Align a dataset to the x-y-z axes.
|
| Examples
| --------
| Create a cylinder, translate it, and use iterative closest point to
| align mesh to its original position.
|
| >>> import pyvista as pv
| >>> import numpy as np
| >>> source = pv.Cylinder(resolution=30).triangulate().subdivide(1)
| >>> transformed = source.rotate_y(20).translate([-0.75, -0.5, 0.5])
| >>> aligned = transformed.align(source)
| >>> _, closest_points = aligned.find_closest_cell(
| ... source.points, return_closest_point=True
| ... )
| >>> dist = np.linalg.norm(source.points - closest_points, axis=1)
|
| Visualize the source, transformed, and aligned meshes.
|
| >>> pl = pv.Plotter(shape=(1, 2))
| >>> _ = pl.add_text('Before Alignment')
| >>> _ = pl.add_mesh(source, style='wireframe', opacity=0.5, line_width=2)
| >>> _ = pl.add_mesh(transformed)
| >>> pl.subplot(0, 1)
| >>> _ = pl.add_text('After Alignment')
| >>> _ = pl.add_mesh(source, style='wireframe', opacity=0.5, line_width=2)
| >>> _ = pl.add_mesh(
| ... aligned,
| ... scalars=dist,
| ... scalar_bar_args={
| ... 'title': 'Distance to Source',
| ... 'fmt': '%.1E',
| ... },
| ... )
| >>> pl.show()
|
| Show that the mean distance between the source and the target is
| nearly zero.
|
| >>> np.abs(dist).mean() # doctest:+SKIP
| 9.997635192915073e-05
|
| align_xyz(self: '_DataSetType', *, centered: 'bool' = True, axis_0_direction: 'VectorLike[float] | str | None' = None, axis_1_direction: 'VectorLike[float] | str | None' = None, axis_2_direction: 'VectorLike[float] | str | None' = None, return_matrix: 'bool' = False)
| Align a dataset to the x-y-z axes.
|
| This filter aligns a mesh's :func:`~pyvista.principal_axes` to the world x-y-z
| axes. The principal axes are effectively used as a rotation matrix to rotate
| the dataset for the alignment. The transformation matrix used for the alignment
| can optionally be returned.
|
| Note that the transformation is not unique, since the signs of the principal
| axes are arbitrary. Consequently, applying this filter to similar meshes
| may result in dissimilar alignment (e.g. one axis may point up instead of down).
| To address this, the sign of one or two axes may optionally be "seeded" with a
| vector which approximates the axis or axes of the input. This can be useful
| for cases where the orientation of the input has a clear physical meaning.
|
| .. versionadded:: 0.45
|
| Parameters
| ----------
| centered : bool, default: True
| Center the mesh at the origin. If ``False``, the aligned dataset has the
| same center as the input.
|
| axis_0_direction : VectorLike[float] | str, optional
| Approximate direction vector of this mesh's primary axis prior to
| alignment. If set, this axis is flipped such that it best aligns with
| the specified vector. Can be a vector or string specifying the axis by
| name (e.g. ``'x'`` or ``'-x'``, etc.).
|
| axis_1_direction : VectorLike[float] | str, optional
| Approximate direction vector of this mesh's secondary axis prior to
| alignment. If set, this axis is flipped such that it best aligns with
| the specified vector. Can be a vector or string specifying the axis by
| name (e.g. ``'x'`` or ``'-x'``, etc.).
|
| axis_2_direction : VectorLike[float] | str, optional
| Approximate direction vector of this mesh's third axis prior to
| alignment. If set, this axis is flipped such that it best aligns with
| the specified vector. Can be a vector or string specifying the axis by
| name (e.g. ``'x'`` or ``'-x'``, etc.).
|
| return_matrix : bool, default: False
| Return the transform matrix as well as the aligned mesh.
|
| Returns
| -------
| pyvista.DataSet
| The dataset aligned to the x-y-z axes.
|
| numpy.ndarray
| Transform matrix to transform the input dataset to the x-y-z axes if
| ``return_matrix`` is ``True``.
|
| See Also
| --------
| pyvista.principal_axes
| Best-fit axes used by this filter for the alignment.
|
| align
| Align a source mesh to a target mesh using iterative closest point (ICP).
|
| Examples
| --------
| Create a dataset and align it to the x-y-z axes.
|
| >>> import pyvista as pv
| >>> from pyvista import examples
| >>> mesh = examples.download_oblique_cone()
| >>> aligned = mesh.align_xyz()
|
| Plot the aligned mesh along with the original. Show axes at the origin for
| context.
|
| >>> axes = pv.AxesAssembly(scale=aligned.length)
| >>> pl = pv.Plotter()
| >>> _ = pl.add_mesh(aligned)
| >>> _ = pl.add_mesh(mesh, style='wireframe', color='black', line_width=3)
| >>> _ = pl.add_actor(axes)
| >>> pl.show()
|
| Align the mesh but don't center it.
|
| >>> aligned = mesh.align_xyz(centered=False)
|
| Plot the result again. The aligned mesh has the same position as the input.
|
| >>> axes = pv.AxesAssembly(position=mesh.center, scale=aligned.length)
| >>> pl = pv.Plotter()
| >>> _ = pl.add_mesh(aligned)
| >>> _ = pl.add_mesh(mesh, style='wireframe', color='black', line_width=3)
| >>> _ = pl.add_actor(axes)
| >>> pl.show()
|
| Note how the tip of the cone is pointing along the z-axis. This indicates that
| the cone's axis is the third principal axis. It is also pointing in the negative
| z-direction. To control the alignment so that the cone points upward, we can
| seed an approximate direction specifying what "up" means for the original mesh
| in world coordinates prior to the alignment.
|
| We can see that the cone is originally pointing downward, somewhat in the
| negative z-direction. Therefore, we can specify the ``'-z'`` vector
| as the "up" direction of the mesh's third axis prior to alignment.
|
| >>> aligned = mesh.align_xyz(axis_2_direction='-z')
|
| Plot the mesh. The cone is now pointing upward in the desired direction.
|
| >>> axes = pv.AxesAssembly(scale=aligned.length)
| >>> pl = pv.Plotter()
| >>> _ = pl.add_mesh(aligned)
| >>> _ = pl.add_actor(axes)
| >>> pl.show()
|
| The specified direction only needs to be approximate. For example, we get the
| same result by specifying the ``'y'`` direction as the mesh's original "up"
| direction.
|
| >>> aligned, matrix = mesh.align_xyz(axis_2_direction='y', return_matrix=True)
| >>> axes = pv.AxesAssembly(scale=aligned.length)
| >>> pl = pv.Plotter()
| >>> _ = pl.add_mesh(aligned)
| >>> _ = pl.add_actor(axes)
| >>> pl.show()
|
| We can optionally return the transformation matrix.
|
| >>> aligned, matrix = mesh.align_xyz(axis_2_direction='y', return_matrix=True)
|
| The matrix can be inverted, for example, to transform objects from the world
| axes back to the original mesh's local coordinate system.
|
| >>> inverse = pv.Transform(matrix).inverse_matrix
|
| Use the inverse to label the object's axes prior to alignment. For actors,
| we set the :attr:`~pyvista.Prop3D.user_matrix` as the inverse.
|
| >>> axes_local = pv.AxesAssembly(
| ... scale=aligned.length,
| ... user_matrix=inverse,
| ... labels=["X'", "Y'", "Z'"],
| ... )
|
| Plot the original mesh with its local axes, along with the algned mesh and its
| axes.
|
| >>> axes_aligned = pv.AxesAssembly(scale=aligned.length)
| >>> pl = pv.Plotter()
| >>> # Add aligned mesh with axes
| >>> _ = pl.add_mesh(aligned)
| >>> _ = pl.add_actor(axes_aligned)
| >>> # Add original mesh with axes
| >>> _ = pl.add_mesh(mesh, style='wireframe', color='black', line_width=3)
| >>> _ = pl.add_actor(axes_local)
| >>> pl.show()
|
| bounding_box(self: '_DataSetType', box_style: "Literal['frame', 'outline', 'face']" = 'face', *, oriented: 'bool' = False, frame_width: 'float' = 0.1, return_meta: 'bool' = False, as_composite: 'bool' = True)
| Return a bounding box for this dataset.
|
| By default, the box is an axis-aligned bounding box (AABB) returned as a
| :class:`~pyvista.MultiBlock` with six :class:`PolyData` comprising the faces of
| the box. The blocks are named and ordered as ``('+X','-X','+Y','-Y','+Z','-Z')``.
|
| The box can optionally be styled as an outline or frame. It may also be
| oriented to generate an oriented bounding box (OBB).
|
| .. versionadded:: 0.45
|
| Parameters
| ----------
| box_style : 'frame' | 'outline' | 'face', default: 'face'
| Choose the style of the box. If ``'face'`` (default), each face of the box
| is a single quad cell. If ``'outline'``, the edges of each face are returned
| as line cells. If ``'frame'``, the center portion of each face is removed to
| create a picture-frame style border with each face having four quads (one
| for each side of the frame). Use ``frame_width`` to control the size of the
| frame.
|
| oriented : bool, default: False
| Orient the box using this dataset's :func:`~pyvista.principal_axes`. This
| will generate a box that best fits this dataset's points. See
| :meth:`oriented_bounding_box` for more details.
|
| frame_width : float, optional
| Set the width of the frame. Only has an effect if ``box_style`` is
| ``'frame'``. Values must be between ``0.0`` (minimal frame) and ``1.0``
| (large frame). The frame is scaled to ensure it has a constant width.
|
| return_meta : bool, default: False
| If ``True``, also returns the corner point and the three axes vectors
| defining the orientation of the box.
|
| as_composite : bool, default: True
| Return the box as a :class:`pyvista.MultiBlock` with six blocks: one for
| each face. Set this ``False`` to merge the output and return
| :class:`~pyvista.PolyData` with six cells instead. The faces in both
| outputs are separate, i.e. there are duplicate points at the corners.
|
| See Also
| --------
| outline
| Lightweight version of this filter with fewer options.
|
| oriented_bounding_box
| Similar filter with ``oriented=True`` by default and more options.
|
| pyvista.Plotter.add_bounding_box
| Add a bounding box to a scene.
|
| pyvista.CubeFacesSource
| Generate the faces of a cube. Used internally by this filter.
|
| Returns
| -------
| pyvista.MultiBlock or pyvista.PolyData
| MultiBlock with six named cube faces when ``as_composite=True`` and
| PolyData otherwise.
|
| numpy.ndarray
| The box's corner point corresponding to the origin of its axes if
| ``return_meta=True``.
|
| numpy.ndarray
| The box's orthonormal axes vectors if ``return_meta=True``.
|
| Examples
| --------
| Create a bounding box for a dataset.
|
| >>> import pyvista as pv
| >>> from pyvista import examples
| >>> mesh = examples.download_oblique_cone()
| >>> box = mesh.bounding_box()
|
| Plot the mesh and its bounding box.
|
| >>> pl = pv.Plotter()
| >>> _ = pl.add_mesh(mesh, color='red')
| >>> _ = pl.add_mesh(box, opacity=0.5)
| >>> pl.show()
|
| Create a frame instead.
|
| >>> frame = mesh.bounding_box('frame')
|
| >>> pl = pv.Plotter()
| >>> _ = pl.add_mesh(mesh, color='red')
| >>> _ = pl.add_mesh(frame, show_edges=True)
| >>> pl.show()
|
| Create an oriented bounding box (OBB) and compare it to the non-oriented one.
| Use the outline style for both.
|
| >>> box = mesh.bounding_box('outline')
| >>> obb = mesh.bounding_box('outline', oriented=True)
|
| >>> pl = pv.Plotter()
| >>> _ = pl.add_mesh(mesh)
| >>> _ = pl.add_mesh(box, color='red', line_width=5)
| >>> _ = pl.add_mesh(obb, color='blue', line_width=5)
| >>> pl.show()
|
| Return the metadata for the box.
|
| >>> box, point, axes = mesh.bounding_box('outline', return_meta=True)
|
| Use the metadata to plot the box's axes using :class:`~pyvista.AxesAssembly`.
| Create the assembly and position it at the box's corner. Scale it to a fraction
| of the box's length.
|
| >>> scale = box.length / 4
| >>> axes_assembly = pv.AxesAssembly(position=point, scale=scale)
|
| Plot the box and the axes.
|
| >>> pl = pv.Plotter()
| >>> _ = pl.add_mesh(mesh)
| >>> _ = pl.add_mesh(box, color='black', line_width=5)
| >>> _ = pl.add_actor(axes_assembly)
| >>> _ = pl.view_yz()
| >>> pl.show()
|
| clip_scalar(self: '_DataSetType', scalars: 'str | None' = None, invert: 'bool' = True, value: 'float' = 0.0, inplace: 'bool' = False, progress_bar: 'bool' = False, both: 'bool' = False)
| Clip a dataset by a scalar.
|
| Parameters
| ----------
| scalars : str, optional
| Name of scalars to clip on. Defaults to currently active scalars.
|
| invert : bool, default: True
| Flag on whether to flip/invert the clip. When ``True``,
| only the mesh below ``value`` will be kept. When
| ``False``, only values above ``value`` will be kept.
|
| value : float, default: 0.0
| Set the clipping value.
|
| inplace : bool, default: False
| Update mesh in-place.
|
| progress_bar : bool, default: False
| Display a progress bar to indicate progress.
|
| both : bool, default: False
| If ``True``, also returns the complementary clipped mesh.
|
| Returns
| -------
| pyvista.PolyData or tuple
| Clipped dataset if ``both=False``. If ``both=True`` then
| returns a tuple of both clipped datasets.
|
| Examples
| --------
| Remove the part of the mesh with "sample_point_scalars" above 100.
|
| >>> import pyvista as pv
| >>> from pyvista import examples
| >>> dataset = examples.load_hexbeam()
| >>> clipped = dataset.clip_scalar(scalars='sample_point_scalars', value=100)
| >>> clipped.plot()
|
| Get clipped meshes corresponding to the portions of the mesh above and below 100.
|
| >>> import pyvista as pv
| >>> from pyvista import examples
| >>> dataset = examples.load_hexbeam()
| >>> _below, _above = dataset.clip_scalar(
| ... scalars='sample_point_scalars', value=100, both=True
| ... )
|
| Remove the part of the mesh with "sample_point_scalars" below 100.
|
| >>> import pyvista as pv
| >>> from pyvista import examples
| >>> dataset = examples.load_hexbeam()
| >>> clipped = dataset.clip_scalar(
| ... scalars='sample_point_scalars', value=100, invert=False
| ... )
| >>> clipped.plot()
|
| clip_surface(self: '_DataSetType', surface: 'DataSet | _vtk.vtkDataSet', invert: 'bool' = True, value: 'float' = 0.0, compute_distance: 'bool' = False, progress_bar: 'bool' = False, crinkle: 'bool' = False)
| Clip any mesh type using a :class:`pyvista.PolyData` surface mesh.
|
| This will return a :class:`pyvista.UnstructuredGrid` of the clipped
| mesh. Geometry of the input dataset will be preserved where possible.
| Geometries near the clip intersection will be triangulated/tessellated.
|
| Parameters
| ----------
| surface : pyvista.PolyData
| The ``PolyData`` surface mesh to use as a clipping
| function. If this input mesh is not a :class:`pyvista.PolyData`,
| the external surface will be extracted.
|
| invert : bool, default: True
| Flag on whether to flip/invert the clip.
|
| value : float, default: 0.0
| Set the clipping value of the implicit function (if
| clipping with implicit function) or scalar value (if
| clipping with scalars).
|
| compute_distance : bool, default: False
| Compute the implicit distance from the mesh onto the input
| dataset. A new array called ``'implicit_distance'`` will
| be added to the output clipped mesh.
|
| progress_bar : bool, default: False
| Display a progress bar to indicate progress.
|
| crinkle : bool, default: False
| Crinkle the clip by extracting the entire cells along the
| clip. This adds the ``"cell_ids"`` array to the ``cell_data``
| attribute that tracks the original cell IDs of the original
| dataset.
|
| Returns
| -------
| pyvista.PolyData
| Clipped surface.
|
| Examples
| --------
| Clip a cube with a sphere.
|
| >>> import pyvista as pv
| >>> sphere = pv.Sphere(center=(-0.4, -0.4, -0.4))
| >>> cube = pv.Cube().triangulate().subdivide(3)
| >>> clipped = cube.clip_surface(sphere)
| >>> clipped.plot(show_edges=True, cpos='xy', line_width=3)
|
| See :ref:`clip_with_surface_example` for more examples using
| this filter.
|
| color_labels(self: 'DataSet', colors: 'str | ColorLike | Sequence[ColorLike] | dict[float, ColorLike]' = 'glasbey_category10', *, coloring_mode: "Literal['index', 'cycle'] | None" = None, color_type: "Literal['int_rgb', 'float_rgb', 'int_rgba', 'float_rgba']" = 'int_rgb', negative_indexing: 'bool' = False, scalars: 'str | None' = None, preference: "Literal['point', 'cell']" = 'cell', output_scalars: 'str | None' = None, return_dict: 'bool' = False, inplace: 'bool' = False)
| Add RGB(A) scalars to labeled data.
|
| This filter adds a color array to map label values to specific colors.
| The mapping can be specified explicitly with a dictionary or implicitly
| with a colormap or sequence of colors. The implicit mapping is controlled
| with two coloring modes:
|
| - ``'index'`` : The input scalar values (label ids) are used as index values for
| indexing the specified ``colors``. This creates a direct relationship
| between labels and colors such that a given label will always have the same
| color, regardless of the number of labels present in the dataset.
|
| This option is used by default for unsigned 8-bit integer inputs, i.e.
| scalars with whole numbers and a maximum range of ``[0, 255]``.
|
| - ``'cycle'`` : The specified ``colors`` are cycled through sequentially,
| and each unique value in the input scalars is assigned a color in increasing
| order. Unlike with ``'index'`` mode, the colors are not directly mapped to
| the labels, but instead depends on the number of labels at the input.
|
| This option is used by default for floating-point inputs or for inputs
| with values out of the range ``[0, 255]``.
|
| By default, a new ``'int_rgb'`` array is added with the same name as the
| specified ``scalars`` but with ``_rgb`` appended.
|
| .. note::
| The package ``colorcet`` is required to use the default colors from the
| ``'glasbey_category10'`` colormap. For a similar, but very limited,
| alternative that does not require ``colorcet``, set ``colors='tab10'``
| and consider setting the coloring mode explicitly.
|
| .. versionadded:: 0.45
|
| See Also
| --------
| pyvista.DataSetFilters.connectivity
| Label data based on its connectivity.
|
| pyvista.ImageDataFilters.contour_labels
| Generate contours from labeled images. The contours may be colored with this filter.
|
| pack_labels
| Make labeled data contiguous. May be used as a pre-processing step before
| coloring.
|
| :ref:`anatomical_groups_example`
| Additional examples using this filter.
|
| Parameters
| ----------
| colors : str | ColorLike | Sequence[ColorLike] | dict[float, ColorLike],
| Color(s) to use. Specify a dictionary to explicitly control the mapping
| from label values to colors. Alternatively, specify colors only using a
| colormap or a sequence of colors and use ``coloring_mode`` to implicitly
| control the mapping. A single color is also supported to color the entire
| mesh with one color.
|
| By default,the ``'glasbey_category10'`` categorical colormap is used
| where the first 10 colors are the same default colors used by ``matplotlib``.
| See `colorcet categorical colormaps <https://colorcet.holoviz.org/user_guide/Categorical.html#>`_
| for more information.
|
| .. note::
| When a dictionary is specified, any scalar values for which a key is
| not provided is assigned default RGB(A) values of ``nan`` for float colors
| or ``0`` for integer colors (see ``color_type``). To ensure the color
| array has no default values, be sure to provide a mapping for any and
| all possible input label values.
|
| coloring_mode : 'index' | 'cycle', optional
| Control how colors are mapped to label values. Has no effect if ``colors``
| is a dictionary. Specify one of:
|
| - ``'index'``: The input scalar values (label ids) are used as index
| values for indexing the specified ``colors``.
| - ``'cycle'``: The specified ``colors`` are cycled through sequentially,
| and each unique value in the input scalars is assigned a color in increasing
| order. Colors are repeated if there are fewer colors than unique values
| in the input ``scalars``.
|
| By default, ``'index'`` mode is used if the values can be used to index
| the input ``colors``, and ``'cycle'`` mode is used otherwise.
|
| color_type : 'int_rgb' | 'float_rgb' | 'int_rgba' | 'float_rgba', default: 'int_rgb'
| Type of the color array to store. By default, the colors are stored as
| RGB integers to reduce memory usage.
|
| .. note::
| The color type affects the default value for unspecified colors when
| a dictionary is used. See ``colors`` for details.
|
| negative_indexing : bool, default: False
| Allow indexing ``colors`` with negative values. Only valid when
| ``coloring_mode`` is ``'index'``. This option is useful for coloring data
| with two independent categories since positive values will be colored
| differently than negative values.
|
| scalars : str, optional
| Name of scalars with labels. Defaults to currently active scalars.
|
| preference : str, default: "cell"
| When ``scalars`` is specified, this is the preferred array
| type to search for in the dataset. Must be either
| ``'point'`` or ``'cell'``.
|
| output_scalars : str, optional
| Name of the color scalars array. By default, the output array
| is the same as ``scalars`` with ``_rgb`` or ``_rgba`` appended
| depending on ``color_type``.
|
| return_dict : bool, default: False
| Return a dictionary with a mapping from label values to the
| colors applied by the filter. The colors have the same type
| specified by ``color_type``.
|
| .. versionadded:: 0.46
|
| inplace : bool, default: False
| If ``True``, the mesh is updated in-place.
|
| Returns
| -------
| pyvista.DataSet
| Dataset with RGB(A) scalars. Output type matches input type.
|
| Examples
| --------
| Load labeled data and crop it with :meth:`~pyvista.ImageDataFilters.extract_subset`
| to simplify the data.
|
| >>> import pyvista as pv
| >>> from pyvista import examples
| >>> import numpy as np
| >>> image_labels = examples.load_channels()
| >>> image_labels = image_labels.extract_subset(voi=(75, 109, 75, 109, 85, 100))
|
| Plot the dataset with default coloring using a categorical color map. The
| plotter by default uniformly samples from all 256 colors in the color map based
| on the data's range.
|
| >>> image_labels.plot(cmap='glasbey_category10')
|
| Show label ids of the dataset.
|
| >>> label_ids = np.unique(image_labels.active_scalars)
| >>> label_ids
| pyvista_ndarray([0, 1, 2, 3, 4])
|
| Color the labels with the filter. Note that the
| ``'glasbey_category10'`` color map is used by default.
|
| >>> colored_labels, color_dict = image_labels.color_labels(return_dict=True)
|
| Plot the labels. We define a helper function to include a legend with the plot.
|
| >>> def labels_plotter(mesh, color_dict):
| ... pl = pv.Plotter()
| ... pl.add_mesh(mesh)
| ... pl.add_legend(color_dict)
| ... return pl
|
| >>> labels_plotter(colored_labels, color_dict).show()
|
| Since the labels are unsigned integers, the ``'index'`` coloring mode is used
| by default. Unlike the uniform sampling used by the plotter in the previous
| plot, the colormap is instead indexed using the label values. This ensures
| that labels have a consistent coloring regardless of the input. For example,
| we can crop the dataset further.
|
| >>> subset_labels = image_labels.extract_subset(voi=(15, 34, 28, 34, 12, 15))
|
| And show that only three labels remain.
|
| >>> label_ids = np.unique(subset_labels.active_scalars)
| >>> label_ids
| pyvista_ndarray([1, 2, 3])
|
| Despite the changes to the dataset, the regions have the same coloring
| as before.
|
| >>> colored_labels, color_dict = subset_labels.color_labels(return_dict=True)
| >>> labels_plotter(colored_labels, color_dict).show()
|
| Use the ``'cycle'`` coloring mode instead to map label values to colors
| sequentially.
|
| >>> colored_labels, color_dict = subset_labels.color_labels(
| ... coloring_mode='cycle', return_dict=True
| ... )
| >>> labels_plotter(colored_labels, color_dict).show()
|
| Map the colors explicitly using a dictionary.
|
| >>> color_dict = {0: 'black', 1: 'red', 2: 'lime', 3: 'blue', 4: 'gold'}
| >>> colored_labels = image_labels.color_labels(color_dict)
| >>> labels_plotter(colored_labels, color_dict).show()
|
| Omit the background value from the mapping and specify float colors. When
| floats are specified, values without a mapping are assigned ``nan`` values
| and are not plotted by default.
|
| >>> color_dict.pop(0)
| 'black'
| >>> colored_labels = image_labels.color_labels(
| ... color_dict, color_type='float_rgba'
| ... )
| >>> labels_plotter(colored_labels, color_dict).show()
|
| Modify the scalars and make two of the labels negative.
|
| >>> scalars = image_labels.active_scalars
| >>> scalars[scalars > 2] *= -1
| >>> np.unique(scalars)
| pyvista_ndarray([-4, -3, 0, 1, 2])
|
| Color the mesh and enable ``negative_indexing``. With this option enabled,
| the ``'index'`` coloring mode is used by default, and therefore the positive
| values ``0``, ``1``, and ``2`` are colored with the first, second, and third
| color in the colormap, respectively. Negative values ``-3`` and ``-4`` are
| colored with the third-last and fourth-last color in the colormap, respectively.
|
| >>> colored_labels, color_dict = image_labels.color_labels(
| ... negative_indexing=True, return_dict=True
| ... )
| >>> labels_plotter(colored_labels, color_dict).show()
|
| If ``negative_indexing`` is disabled, the coloring defaults to the
| ``'cycle'`` coloring mode instead.
|
| >>> colored_labels, color_dict = image_labels.color_labels(
| ... negative_indexing=False, return_dict=True
| ... )
| >>> labels_plotter(colored_labels, color_dict).show()
|
| Load the :func:`~pyvista.examples.downloads.download_foot_bones` dataset.
|
| >>> dataset = examples.download_foot_bones()
|
| Label the bones using :meth:`~pyvista.DataSetFilters.connectivity` and show
| the label values.
|
| >>> labeled_data = dataset.connectivity()
| >>> np.unique(labeled_data.active_scalars)
| pyvista_ndarray([ 0, 1, 2, 3, 4, 5, 6, 7, 8, 9, 10, 11, 12, 13,
| 14, 15, 16, 17, 18, 19, 20, 21, 22, 23, 24, 25])
|
| Color the dataset with default arguments. Despite having 26 separately colored
| regions, the colors from the default glasbey-style colormap are all relatively
| distinct.
|
| >>> colored_labels = labeled_data.color_labels()
| >>> colored_labels.plot()
|
| Color the mesh with fewer colors than there are label values. In this case
| the ``'cycle'`` mode is used by default and the colors are reused.
|
| >>> colored_labels = labeled_data.color_labels(['red', 'lime', 'blue'])
| >>> colored_labels.plot()
|
| Color all labels with a single color.
|
| >>> colored_labels = labeled_data.color_labels('red')
| >>> colored_labels.plot()
|
| compute_boundary_mesh_quality(self: '_DataSetType', *, progress_bar: 'bool' = False)
| Compute metrics on the boundary faces of a mesh.
|
| The metrics that can be computed on the boundary faces of the mesh and are:
|
| - Distance from cell center to face center
| - Distance from cell center to face plane
| - Angle of faces plane normal and cell center to face center vector
|
| Parameters
| ----------
| progress_bar : bool, default: False
| Display a progress bar to indicate progress.
|
| Returns
| -------
| pyvista.DataSet
| Dataset with the computed metrics on the boundary faces of a mesh.
| ``cell_data`` as the ``"CellQuality"`` array.
|
| Examples
| --------
| >>> import pyvista as pv
| >>> from pyvista import examples
| >>> mesh = examples.download_can_crushed_vtu()
| >>> cqual = mesh.compute_boundary_mesh_quality()
| >>> plotter = pv.Plotter(shape=(2, 2))
| >>> _ = plotter.add_mesh(mesh, show_edges=True)
| >>> plotter.subplot(1, 0)
| >>> _ = plotter.add_mesh(cqual, scalars='DistanceFromCellCenterToFaceCenter')
| >>> plotter.subplot(0, 1)
| >>> _ = plotter.add_mesh(cqual, scalars='DistanceFromCellCenterToFacePlane')
| >>> plotter.subplot(1, 1)
| >>> _ = plotter.add_mesh(
| ... cqual,
| ... scalars='AngleFaceNormalAndCellCenterToFaceCenterVector',
| ... )
| >>> plotter.show()
|
| compute_cell_quality(self: '_DataSetType', quality_measure: 'str' = 'scaled_jacobian', null_value: 'float' = -1.0, progress_bar: 'bool' = False)
| Compute a function of (geometric) quality for each cell of a mesh.
|
| The per-cell quality is added to the mesh's cell data, in an
| array named ``"CellQuality"``. Cell types not supported by this
| filter or undefined quality of supported cell types will have an
| entry of -1.
|
| Defaults to computing the scaled Jacobian.
|
| Options for cell quality measure:
|
| - ``'area'``
| - ``'aspect_beta'``
| - ``'aspect_frobenius'``
| - ``'aspect_gamma'``
| - ``'aspect_ratio'``
| - ``'collapse_ratio'``
| - ``'condition'``
| - ``'diagonal'``
| - ``'dimension'``
| - ``'distortion'``
| - ``'jacobian'``
| - ``'max_angle'``
| - ``'max_aspect_frobenius'``
| - ``'max_edge_ratio'``
| - ``'med_aspect_frobenius'``
| - ``'min_angle'``
| - ``'oddy'``
| - ``'radius_ratio'``
| - ``'relative_size_squared'``
| - ``'scaled_jacobian'``
| - ``'shape'``
| - ``'shape_and_size'``
| - ``'shear'``
| - ``'shear_and_size'``
| - ``'skew'``
| - ``'stretch'``
| - ``'taper'``
| - ``'volume'``
| - ``'warpage'``
|
| .. note::
|
| Refer to the `Verdict Library Reference Manual <https://public.kitware.com/Wiki/images/6/6b/VerdictManual-revA.pdf>`_
| for low-level technical information about how each metric is computed,
| which :class:`~pyvista.CellType` it applies to as well as the metric's
| full, normal, and acceptable range of values.
|
| .. deprecated:: 0.45
|
| Use :meth:`~pyvista.DataObjectFilters.cell_quality` instead. Note that
| this new filter does not include an array named ``'CellQuality'``.
|
| Parameters
| ----------
| quality_measure : str, default: 'scaled_jacobian'
| The cell quality measure to use.
|
| null_value : float, default: -1.0
| Float value for undefined quality. Undefined quality are qualities
| that could be addressed by this filter but is not well defined for
| the particular geometry of cell in question, e.g. a volume query
| for a triangle. Undefined quality will always be undefined.
| The default value is -1.
|
| progress_bar : bool, default: False
| Display a progress bar to indicate progress.
|
| Returns
| -------
| pyvista.DataSet
| Dataset with the computed mesh quality in the
| ``cell_data`` as the ``"CellQuality"`` array.
|
| Examples
| --------
| Compute and plot the minimum angle of a sample sphere mesh.
|
| >>> import pyvista as pv
| >>> sphere = pv.Sphere(theta_resolution=20, phi_resolution=20)
| >>> cqual = sphere.compute_cell_quality('min_angle') # doctest:+SKIP
| >>> cqual.plot(show_edges=True) # doctest:+SKIP
|
| See the :ref:`mesh_quality_example` for more examples using this filter.
|
| compute_derivative(self: '_DataSetType', scalars: 'str | None' = None, gradient: 'bool | str' = True, divergence: 'bool | str' = False, vorticity: 'bool | str' = False, qcriterion: 'bool | str' = False, faster: 'bool' = False, preference: "Literal['point', 'cell']" = 'point', progress_bar: 'bool' = False)
| Compute derivative-based quantities of point/cell scalar field.
|
| Utilize :vtk:`vtkGradientFilter` to compute derivative-based quantities,
| such as gradient, divergence, vorticity, and Q-criterion, of the
| selected point or cell scalar field.
|
| Parameters
| ----------
| scalars : str, optional
| String name of the scalars array to use when computing the
| derivative quantities. Defaults to the active scalars in
| the dataset.
|
| gradient : bool | str, default: True
| Calculate gradient. If a string is passed, the string will be used
| for the resulting array name. Otherwise, array name will be
| ``'gradient'``. Default ``True``.
|
| divergence : bool | str, optional
| Calculate divergence. If a string is passed, the string will be
| used for the resulting array name. Otherwise, default array name
| will be ``'divergence'``.
|
| vorticity : bool | str, optional
| Calculate vorticity. If a string is passed, the string will be used
| for the resulting array name. Otherwise, default array name will be
| ``'vorticity'``.
|
| qcriterion : bool | str, optional
| Calculate qcriterion. If a string is passed, the string will be
| used for the resulting array name. Otherwise, default array name
| will be ``'qcriterion'``.
|
| faster : bool, default: False
| Use faster algorithm for computing derivative quantities. Result is
| less accurate and performs fewer derivative calculations,
| increasing computation speed. The error will feature smoothing of
| the output and possibly errors at boundaries. Option has no effect
| if DataSet is not :class:`pyvista.UnstructuredGrid`.
|
| preference : str, default: "point"
| Data type preference. Either ``'point'`` or ``'cell'``.
|
| progress_bar : bool, default: False
| Display a progress bar to indicate progress.
|
| Returns
| -------
| pyvista.DataSet
| Dataset with calculated derivative.
|
| Examples
| --------
| First, plot the random hills dataset with the active elevation
| scalars. These scalars will be used for the derivative
| calculations.
|
| >>> from pyvista import examples
| >>> hills = examples.load_random_hills()
| >>> hills.plot(smooth_shading=True)
|
| Compute and plot the gradient of the active scalars.
|
| >>> from pyvista import examples
| >>> hills = examples.load_random_hills()
| >>> deriv = hills.compute_derivative()
| >>> deriv.plot(scalars='gradient')
|
| See the :ref:`gradients_example` for more examples using this filter.
|
| compute_implicit_distance(self: '_DataSetType', surface: 'DataSet | _vtk.vtkDataSet', inplace: 'bool' = False)
| Compute the implicit distance from the points to a surface.
|
| This filter will compute the implicit distance from all of the
| nodes of this mesh to a given surface. This distance will be
| added as a point array called ``'implicit_distance'``.
|
| Nodes of this mesh which are interior to the input surface
| geometry have a negative distance, and nodes on the exterior
| have a positive distance. Nodes which intersect the input
| surface has a distance of zero.
|
| Parameters
| ----------
| surface : pyvista.DataSet
| The surface used to compute the distance.
|
| inplace : bool, default: False
| If ``True``, a new scalar array will be added to the
| ``point_data`` of this mesh and the modified mesh will
| be returned. Otherwise a copy of this mesh is returned
| with that scalar field added.
|
| Returns
| -------
| pyvista.DataSet
| Dataset containing the ``'implicit_distance'`` array in
| ``point_data``.
|
| Examples
| --------
| Compute the distance between all the points on a sphere and a
| plane.
|
| >>> import pyvista as pv
| >>> sphere = pv.Sphere(radius=0.35)
| >>> plane = pv.Plane()
| >>> _ = sphere.compute_implicit_distance(plane, inplace=True)
| >>> dist = sphere['implicit_distance']
| >>> type(dist)
| <class 'pyvista.core.pyvista_ndarray.pyvista_ndarray'>
|
| Plot these distances as a heatmap. Note how distances above the
| plane are positive, and distances below the plane are negative.
|
| >>> pl = pv.Plotter()
| >>> _ = pl.add_mesh(sphere, scalars='implicit_distance', cmap='bwr')
| >>> _ = pl.add_mesh(plane, color='w', style='wireframe')
| >>> pl.show()
|
| We can also compute the distance from all the points on the
| plane to the sphere.
|
| >>> _ = plane.compute_implicit_distance(sphere, inplace=True)
|
| Again, we can plot these distances as a heatmap. Note how
| distances inside the sphere are negative and distances outside
| the sphere are positive.
|
| >>> pl = pv.Plotter()
| >>> _ = pl.add_mesh(
| ... plane,
| ... scalars='implicit_distance',
| ... cmap='bwr',
| ... clim=[-0.35, 0.35],
| ... )
| >>> _ = pl.add_mesh(sphere, color='w', style='wireframe')
| >>> pl.show()
|
| See :ref:`clip_with_surface_example` and
| :ref:`voxelize_example` for more examples using
| this filter.
|
| connectivity(self: '_DataSetType', extraction_mode: "Literal['all', 'largest', 'specified', 'cell_seed', 'point_seed', 'closest']" = 'all', variable_input: 'float | VectorLike[float] | None' = None, scalar_range: 'VectorLike[float] | None' = None, scalars: 'str | None' = None, label_regions: 'bool' = True, region_ids: 'VectorLike[int] | None' = None, point_ids: 'VectorLike[int] | None' = None, cell_ids: 'VectorLike[int] | None' = None, closest_point: 'VectorLike[float] | None' = None, inplace: 'bool' = False, progress_bar: 'bool' = False, **kwargs)
| Find and label connected regions.
|
| This filter extracts cell regions based on a specified connectivity
| criterion. The extraction criterion can be controlled with
| ``extraction_mode`` to extract the largest region or the closest
| region to a seed point, for example.
|
| In general, cells are considered to be connected if they
| share a point. However, if a ``scalar_range`` is provided, cells
| must also have at least one point with scalar values in the
| specified range to be considered connected.
|
| See :ref:`connectivity_example` and :ref:`volumetric_analysis_example` for
| more examples using this filter.
|
| .. versionadded:: 0.43.0
|
| * New extraction modes: ``'specified'``, ``'cell_seed'``, ``'point_seed'``,
| and ``'closest'``.
| * Extracted regions are now sorted in descending order by
| cell count.
| * Region connectivity can be controlled using ``scalar_range``.
|
| .. deprecated:: 0.43.0
| Parameter ``largest`` is deprecated. Use ``'largest'`` or
| ``extraction_mode='largest'`` instead.
|
| Parameters
| ----------
| extraction_mode : str, default: "all"
| * ``'all'``: Extract all connected regions.
| * ``'largest'`` : Extract the largest connected region (by cell
| count).
| * ``'specified'``: Extract specific region IDs. Use ``region_ids``
| to specify the region IDs to extract.
| * ``'cell_seed'``: Extract all regions sharing the specified cell
| ids. Use ``cell_ids`` to specify the cell ids.
| * ``'point_seed'`` : Extract all regions sharing the specified
| point ids. Use ``point_ids`` to specify the point ids.
| * ``'closest'`` : Extract the region closest to the specified
| point. Use ``closest_point`` to specify the point.
|
| variable_input : float | sequence[float], optional
| The convenience parameter used for specifying any required input
| values for some values of ``extraction_mode``. Setting
| ``variable_input`` is equivalent to setting:
|
| * ``'region_ids'`` if mode is ``'specified'``.
| * ``'cell_ids'`` if mode is ``'cell_seed'``.
| * ``'point_ids'`` if mode is ``'point_seed'``.
| * ``'closest_point'`` if mode is ``'closest'``.
|
| It has no effect if the mode is ``'all'`` or ``'largest'``.
|
| scalar_range : sequence[float], optional
| Scalar range in the form ``[min, max]``. If set, the connectivity is
| restricted to cells with at least one point with scalar values in
| the specified range.
|
| scalars : str, optional
| Name of scalars to use if ``scalar_range`` is specified. Defaults
| to currently active scalars.
|
| .. note::
| This filter requires point scalars to determine region
| connectivity. If cell scalars are provided, they are first
| converted to point scalars with
| :func:`~pyvista.DataObjectFilters.cell_data_to_point_data`
| before applying the filter. The converted point scalars are
| removed from the output after applying the filter.
|
| label_regions : bool, default: True
| If ``True``, ``'RegionId'`` point and cell scalar arrays are stored.
| Each region is assigned a unique ID. IDs are zero-indexed and are
| assigned by region cell count in descending order (i.e. the largest
| region has ID ``0``).
|
| region_ids : sequence[int], optional
| Region ids to extract. Only used if ``extraction_mode`` is
| ``specified``.
|
| point_ids : sequence[int], optional
| Point ids to use as seeds. Only used if ``extraction_mode`` is
| ``point_seed``.
|
| cell_ids : sequence[int], optional
| Cell ids to use as seeds. Only used if ``extraction_mode`` is
| ``cell_seed``.
|
| closest_point : sequence[int], optional
| Point coordinates in ``(x, y, z)``. Only used if
| ``extraction_mode`` is ``closest``.
|
| inplace : bool, default: False
| If ``True`` the mesh is updated in-place, otherwise a copy
| is returned. A copy is always returned if the input type is
| not ``pyvista.PolyData`` or ``pyvista.UnstructuredGrid``.
|
| progress_bar : bool, default: False
| Display a progress bar.
|
| **kwargs : dict, optional
| Used for handling deprecated parameters.
|
| Returns
| -------
| pyvista.DataSet
| Dataset with labeled connected regions. Return type is
| ``pyvista.PolyData`` if input type is ``pyvista.PolyData`` and
| ``pyvista.UnstructuredGrid`` otherwise.
|
| See Also
| --------
| extract_largest, split_bodies, threshold, extract_values
|
| Examples
| --------
| Create a single mesh with three disconnected regions where each
| region has a different cell count.
|
| >>> import pyvista as pv
| >>> large = pv.Sphere(
| ... center=(-4, 0, 0), phi_resolution=40, theta_resolution=40
| ... )
| >>> medium = pv.Sphere(
| ... center=(-2, 0, 0), phi_resolution=15, theta_resolution=15
| ... )
| >>> small = pv.Sphere(center=(0, 0, 0), phi_resolution=7, theta_resolution=7)
| >>> mesh = large + medium + small
|
| Plot their connectivity.
|
| >>> conn = mesh.connectivity('all')
| >>> conn.plot(cmap=['red', 'green', 'blue'], show_edges=True)
|
| Restrict connectivity to a scalar range.
|
| >>> mesh['y_coordinates'] = mesh.points[:, 1]
| >>> conn = mesh.connectivity('all', scalar_range=[-1, 0])
| >>> conn.plot(cmap=['red', 'green', 'blue'], show_edges=True)
|
| Extract the region closest to the origin.
|
| >>> conn = mesh.connectivity('closest', (0, 0, 0))
| >>> conn.plot(color='blue', show_edges=True)
|
| Extract a region using a cell ID ``3100`` as a seed.
|
| >>> conn = mesh.connectivity('cell_seed', 3100)
| >>> conn.plot(color='green', show_edges=True)
|
| Extract the largest region.
|
| >>> conn = mesh.connectivity('largest')
| >>> conn.plot(color='red', show_edges=True)
|
| Extract the largest and smallest regions by specifying their
| region IDs. Note that the region IDs of the output differ from
| the specified IDs since the input has three regions but the output
| only has two.
|
| >>> large_id = 0 # largest always has ID '0'
| >>> small_id = 2 # smallest has ID 'N-1' with N=3 regions
| >>> conn = mesh.connectivity('specified', (small_id, large_id))
| >>> conn.plot(cmap=['red', 'blue'], show_edges=True)
|
| contour(self: '_DataSetType', isosurfaces: 'int | Sequence[float]' = 10, scalars: 'str | NumpyArray[float] | None' = None, compute_normals: 'bool' = False, compute_gradients: 'bool' = False, compute_scalars: 'bool' = True, rng: 'VectorLike[float] | None' = None, preference: "Literal['point', 'cell']" = 'point', method: "Literal['contour', 'marching_cubes', 'flying_edges']" = 'contour', progress_bar: 'bool' = False)
| Contour an input self by an array.
|
| ``isosurfaces`` can be an integer specifying the number of
| isosurfaces in the data range or a sequence of values for
| explicitly setting the isosurfaces.
|
| Parameters
| ----------
| isosurfaces : int | sequence[float], optional
| Number of isosurfaces to compute across valid data range or a
| sequence of float values to explicitly use as the isosurfaces.
|
| scalars : str | array_like[float], optional
| Name or array of scalars to threshold on. If this is an array, the
| output of this filter will save them as ``"Contour Data"``.
| Defaults to currently active scalars.
|
| compute_normals : bool, default: False
| Compute normals for the dataset.
|
| compute_gradients : bool, default: False
| Compute gradients for the dataset.
|
| compute_scalars : bool, default: True
| Preserves the scalar values that are being contoured.
|
| rng : sequence[float], optional
| If an integer number of isosurfaces is specified, this is
| the range over which to generate contours. Default is the
| scalars array's full data range.
|
| preference : str, default: "point"
| When ``scalars`` is specified, this is the preferred array
| type to search for in the dataset. Must be either
| ``'point'`` or ``'cell'``.
|
| method : str, default: "contour"
| Specify to choose which vtk filter is used to create the contour.
| Must be one of ``'contour'``, ``'marching_cubes'`` and
| ``'flying_edges'``.
|
| progress_bar : bool, default: False
| Display a progress bar to indicate progress.
|
| Returns
| -------
| pyvista.PolyData
| Contoured surface.
|
| Examples
| --------
| Generate contours for the random hills dataset.
|
| >>> from pyvista import examples
| >>> hills = examples.load_random_hills()
| >>> contours = hills.contour()
| >>> contours.plot(line_width=5)
|
| Generate the surface of a mobius strip using flying edges.
|
| >>> import pyvista as pv
| >>> a = 0.4
| >>> b = 0.1
| >>> def f(x, y, z):
| ... xx = x * x
| ... yy = y * y
| ... zz = z * z
| ... xyz = x * y * z
| ... xx_yy = xx + yy
| ... a_xx = a * xx
| ... b_yy = b * yy
| ... return (
| ... (xx_yy + 1) * (a_xx + b_yy)
| ... + zz * (b * xx + a * yy)
| ... - 2 * (a - b) * xyz
| ... - a * b * xx_yy
| ... ) ** 2 - 4 * (xx + yy) * (a_xx + b_yy - xyz * (a - b)) ** 2
| >>> n = 100
| >>> x_min, y_min, z_min = -1.35, -1.7, -0.65
| >>> grid = pv.ImageData(
| ... dimensions=(n, n, n),
| ... spacing=(
| ... abs(x_min) / n * 2,
| ... abs(y_min) / n * 2,
| ... abs(z_min) / n * 2,
| ... ),
| ... origin=(x_min, y_min, z_min),
| ... )
| >>> x, y, z = grid.points.T
| >>> values = f(x, y, z)
| >>> out = grid.contour(
| ... 1,
| ... scalars=values,
| ... rng=[0, 0],
| ... method='flying_edges',
| ... )
| >>> out.plot(color='lightblue', smooth_shading=True)
|
| See :ref:`using_filters_example` or
| :ref:`marching_cubes_example` for more examples using this
| filter.
|
| decimate_boundary(self: '_DataSetType', target_reduction: 'float' = 0.5, progress_bar: 'bool' = False)
| Return a decimated version of a triangulation of the boundary.
|
| Only the outer surface of the input dataset will be considered.
|
| Parameters
| ----------
| target_reduction : float, default: 0.5
| Fraction of the original mesh to remove.
| TargetReduction is set to ``0.9``, this filter will try to reduce
| the data set to 10% of its original size and will remove 90%
| of the input triangles.
|
| progress_bar : bool, default: False
| Display a progress bar to indicate progress.
|
| Returns
| -------
| pyvista.PolyData
| Decimated boundary.
|
| Examples
| --------
| See the :ref:`linked_views_example` example.
|
| delaunay_3d(self: '_DataSetType', alpha: 'float' = 0.0, tol: 'float' = 0.001, offset: 'float' = 2.5, progress_bar: 'bool' = False)
| Construct a 3D Delaunay triangulation of the mesh.
|
| This filter can be used to generate a 3D tetrahedral mesh from
| a surface or scattered points. If you want to create a
| surface from a point cloud, see
| :func:`pyvista.PolyDataFilters.reconstruct_surface`.
|
| Parameters
| ----------
| alpha : float, default: 0.0
| Distance value to control output of this filter. For a
| non-zero alpha value, only vertices, edges, faces, or
| tetrahedra contained within the circumsphere (of radius
| alpha) will be output. Otherwise, only tetrahedra will be
| output.
|
| tol : float, default: 0.001
| Tolerance to control discarding of closely spaced points.
| This tolerance is specified as a fraction of the diagonal
| length of the bounding box of the points.
|
| offset : float, default: 2.5
| Multiplier to control the size of the initial, bounding
| Delaunay triangulation.
|
| progress_bar : bool, default: False
| Display a progress bar to indicate progress.
|
| Returns
| -------
| pyvista.UnstructuredGrid
| UnstructuredGrid containing the Delaunay triangulation.
|
| Examples
| --------
| Generate a 3D Delaunay triangulation of a surface mesh of a
| sphere and plot the interior edges generated.
|
| >>> import pyvista as pv
| >>> sphere = pv.Sphere(theta_resolution=5, phi_resolution=5)
| >>> grid = sphere.delaunay_3d()
| >>> edges = grid.extract_all_edges()
| >>> edges.plot(line_width=5, color='k')
|
| explode(self: '_DataSetType', factor: 'float' = 0.1)
| Push each individual cell away from the center of the dataset.
|
| Parameters
| ----------
| factor : float, default: 0.1
| How much each cell will move from the center of the dataset
| relative to its distance from it. Increase this number to push the
| cells farther away.
|
| Returns
| -------
| pyvista.UnstructuredGrid
| UnstructuredGrid containing the exploded cells.
|
| Notes
| -----
| This is similar to :func:`shrink <pyvista.DataSetFilters.shrink>`
| except that it does not change the size of the cells.
|
| Examples
| --------
| >>> import numpy as np
| >>> import pyvista as pv
| >>> xrng = np.linspace(0, 1, 3)
| >>> yrng = np.linspace(0, 2, 4)
| >>> zrng = np.linspace(0, 3, 5)
| >>> grid = pv.RectilinearGrid(xrng, yrng, zrng)
| >>> exploded = grid.explode()
| >>> exploded.plot(show_edges=True)
|
| extract_cells(self: '_DataSetType', ind: 'int | VectorLike[int]', invert: 'bool' = False, progress_bar: 'bool' = False)
| Return a subset of the grid.
|
| Parameters
| ----------
| ind : sequence[int]
| Numpy array of cell indices to be extracted.
|
| invert : bool, default: False
| Invert the selection.
|
| progress_bar : bool, default: False
| Display a progress bar to indicate progress.
|
| See Also
| --------
| extract_points, extract_values
|
| Returns
| -------
| pyvista.UnstructuredGrid
| Subselected grid.
|
| Examples
| --------
| >>> import pyvista as pv
| >>> from pyvista import examples
| >>> grid = pv.read(examples.hexbeamfile)
| >>> subset = grid.extract_cells(range(20))
| >>> subset.n_cells
| 20
| >>> pl = pv.Plotter()
| >>> actor = pl.add_mesh(grid, style='wireframe', line_width=5, color='black')
| >>> actor = pl.add_mesh(subset, color='grey')
| >>> pl.show()
|
| extract_cells_by_type(self: '_DataSetType', cell_types: 'int | VectorLike[int]', progress_bar: 'bool' = False)
| Extract cells of a specified type.
|
| Given an input dataset and a list of cell types, produce an output
| dataset containing only cells of the specified type(s). Note that if
| the input dataset is homogeneous (e.g., all cells are of the same type)
| and the cell type is one of the cells specified, then the input dataset
| is shallow copied to the output.
|
| The type of output dataset is always the same as the input type. Since
| structured types of data (i.e., :class:`pyvista.ImageData`,
| :class:`pyvista.StructuredGrid`, :class:`pyvista.RectilinearGrid`)
| are all composed of a cell of the same
| type, the output is either empty, or a shallow copy of the input.
| Unstructured data (:class:`pyvista.UnstructuredGrid`,
| :class:`pyvista.PolyData`) input may produce a subset of the input data
| (depending on the selected cell types).
|
| Parameters
| ----------
| cell_types : int | VectorLike[int]
| The cell types to extract. Must be a single or list of integer cell
| types. See :class:`pyvista.CellType`.
|
| progress_bar : bool, default: False
| Display a progress bar to indicate progress.
|
| Returns
| -------
| pyvista.DataSet
| Dataset with the extracted cells. Type is the same as the input.
|
| Notes
| -----
| Unlike :func:`pyvista.DataSetFilters.extract_cells` which always
| produces a :class:`pyvista.UnstructuredGrid` output, this filter
| produces the same output type as input type.
|
| Examples
| --------
| Create an unstructured grid with both hexahedral and tetrahedral
| cells and then extract each individual cell type.
|
| >>> import pyvista as pv
| >>> from pyvista import examples
| >>> beam = examples.load_hexbeam()
| >>> beam = beam.translate([1, 0, 0])
| >>> ugrid = beam + examples.load_tetbeam()
| >>> hex_cells = ugrid.extract_cells_by_type(pv.CellType.HEXAHEDRON)
| >>> tet_cells = ugrid.extract_cells_by_type(pv.CellType.TETRA)
| >>> pl = pv.Plotter(shape=(1, 2))
| >>> _ = pl.add_text('Extracted Hexahedron cells')
| >>> _ = pl.add_mesh(hex_cells, show_edges=True)
| >>> pl.subplot(0, 1)
| >>> _ = pl.add_text('Extracted Tetrahedron cells')
| >>> _ = pl.add_mesh(tet_cells, show_edges=True)
| >>> pl.show()
|
| extract_feature_edges(self: '_DataSetType', feature_angle: 'float' = 30.0, boundary_edges: 'bool' = True, non_manifold_edges: 'bool' = True, feature_edges: 'bool' = True, manifold_edges: 'bool' = True, clear_data: 'bool' = False, progress_bar: 'bool' = False)
| Extract edges from the surface of the mesh.
|
| If the given mesh is not PolyData, the external surface of the given
| mesh is extracted and used.
|
| From vtk documentation, the edges are one of the following:
|
| 1) Boundary (used by one polygon) or a line cell.
| 2) Non-manifold (used by three or more polygons).
| 3) Feature edges (edges used by two triangles and whose
| dihedral angle > feature_angle).
| 4) Manifold edges (edges used by exactly two polygons).
|
| Parameters
| ----------
| feature_angle : float, default: 30.0
| Feature angle (in degrees) used to detect sharp edges on
| the mesh. Used only when ``feature_edges=True``.
|
| boundary_edges : bool, default: True
| Extract the boundary edges.
|
| non_manifold_edges : bool, default: True
| Extract non-manifold edges.
|
| feature_edges : bool, default: True
| Extract edges exceeding ``feature_angle``.
|
| manifold_edges : bool, default: True
| Extract manifold edges.
|
| clear_data : bool, default: False
| Clear any point, cell, or field data. This is useful
| if wanting to strictly extract the edges.
|
| progress_bar : bool, default: False
| Display a progress bar to indicate progress.
|
| Returns
| -------
| pyvista.PolyData
| Extracted edges.
|
| Examples
| --------
| Extract the edges from an unstructured grid.
|
| >>> import pyvista as pv
| >>> from pyvista import examples
| >>> hex_beam = pv.read(examples.hexbeamfile)
| >>> feat_edges = hex_beam.extract_feature_edges()
| >>> feat_edges.clear_data() # clear array data for plotting
| >>> feat_edges.plot(line_width=10)
|
| See the :ref:`extract_edges_example` for more examples using this filter.
|
| extract_geometry(self: '_DataSetType', extent: 'VectorLike[float] | None' = None, progress_bar: 'bool' = False) -> 'PolyData'
| Extract the outer surface of a volume or structured grid dataset.
|
| This will extract all 0D, 1D, and 2D cells producing the
| boundary faces of the dataset.
|
| .. note::
| This tends to be less efficient than :func:`extract_surface`.
|
| Parameters
| ----------
| extent : VectorLike[float], optional
| Specify a ``(x_min, x_max, y_min, y_max, z_min, z_max)`` bounding box to
| clip data.
|
| progress_bar : bool, default: False
| Display a progress bar to indicate progress.
|
| Returns
| -------
| pyvista.PolyData
| Surface of the dataset.
|
| Examples
| --------
| Extract the surface of a sample unstructured grid.
|
| >>> import pyvista as pv
| >>> from pyvista import examples
| >>> hex_beam = pv.read(examples.hexbeamfile)
| >>> hex_beam.extract_geometry()
| PolyData (...)
| N Cells: 88
| N Points: 90
| N Strips: 0
| X Bounds: 0.000e+00, 1.000e+00
| Y Bounds: 0.000e+00, 1.000e+00
| Z Bounds: 0.000e+00, 5.000e+00
| N Arrays: 3
|
| See :ref:`surface_smoothing_example` for more examples using this filter.
|
| extract_largest(self: '_DataSetType', inplace: 'bool' = False, progress_bar: 'bool' = False)
| Extract largest connected set in mesh.
|
| Can be used to reduce residues obtained when generating an
| isosurface. Works only if residues are not connected (share
| at least one point with) the main component of the image.
|
| Parameters
| ----------
| inplace : bool, default: False
| Updates mesh in-place.
|
| progress_bar : bool, default: False
| Display a progress bar to indicate progress.
|
| Returns
| -------
| pyvista.DataSet
| Largest connected set in the dataset. Return type matches input.
|
| Examples
| --------
| Join two meshes together, extract the largest, and plot it.
|
| >>> import pyvista as pv
| >>> mesh = pv.Sphere() + pv.Cube()
| >>> largest = mesh.extract_largest()
| >>> largest.plot()
|
| See :ref:`connectivity_example` and :ref:`volumetric_analysis_example` for
| more examples using this filter.
|
| .. seealso::
| :func:`pyvista.DataSetFilters.connectivity`
|
| extract_points(self: '_DataSetType', ind: 'int | VectorLike[int] | VectorLike[bool]', adjacent_cells: 'bool' = True, include_cells: 'bool' = True, progress_bar: 'bool' = False)
| Return a subset of the grid (with cells) that contains any of the given point indices.
|
| Parameters
| ----------
| ind : sequence[int]
| Sequence of point indices to be extracted.
|
| adjacent_cells : bool, default: True
| If ``True``, extract the cells that contain at least one of
| the extracted points. If ``False``, extract the cells that
| contain exclusively points from the extracted points list.
| Has no effect if ``include_cells`` is ``False``.
|
| include_cells : bool, default: True
| Specifies if the cells shall be returned or not.
|
| progress_bar : bool, default: False
| Display a progress bar to indicate progress.
|
| See Also
| --------
| extract_cells, extract_values
|
| Returns
| -------
| pyvista.UnstructuredGrid
| Subselected grid.
|
| Examples
| --------
| Extract all the points of a sphere with a Z coordinate greater than 0
|
| >>> import pyvista as pv
| >>> sphere = pv.Sphere()
| >>> extracted = sphere.extract_points(
| ... sphere.points[:, 2] > 0, include_cells=False
| ... )
| >>> extracted.clear_data() # clear for plotting
| >>> extracted.plot()
|
| extract_surface(self: '_DataSetType', pass_pointid: 'bool' = True, pass_cellid: 'bool' = True, nonlinear_subdivision: 'int' = 1, progress_bar: 'bool' = False)
| Extract surface mesh of the grid.
|
| Parameters
| ----------
| pass_pointid : bool, default: True
| Adds a point array ``"vtkOriginalPointIds"`` that
| identifies which original points these surface points
| correspond to.
|
| pass_cellid : bool, default: True
| Adds a cell array ``"vtkOriginalCellIds"`` that
| identifies which original cells these surface cells
| correspond to.
|
| nonlinear_subdivision : int, default: 1
| If the input is an unstructured grid with nonlinear faces,
| this parameter determines how many times the face is
| subdivided into linear faces.
|
| If 0, the output is the equivalent of its linear
| counterpart (and the midpoints determining the nonlinear
| interpolation are discarded). If 1 (the default), the
| nonlinear face is triangulated based on the midpoints. If
| greater than 1, the triangulated pieces are recursively
| subdivided to reach the desired subdivision. Setting the
| value to greater than 1 may cause some point data to not
| be passed even if no nonlinear faces exist. This option
| has no effect if the input is not an unstructured grid.
|
| progress_bar : bool, default: False
| Display a progress bar to indicate progress.
|
| Returns
| -------
| pyvista.PolyData
| Surface mesh of the grid.
|
| Warnings
| --------
| Both ``"vtkOriginalPointIds"`` and ``"vtkOriginalCellIds"`` may be
| affected by other VTK operations. See `issue 1164
| <https://github.com/pyvista/pyvista/issues/1164>`_ for
| recommendations on tracking indices across operations.
|
| Examples
| --------
| Extract the surface of an UnstructuredGrid.
|
| >>> import pyvista as pv
| >>> from pyvista import examples
| >>> grid = examples.load_hexbeam()
| >>> surf = grid.extract_surface()
| >>> type(surf)
| <class 'pyvista.core.pointset.PolyData'>
| >>> surf['vtkOriginalPointIds']
| pyvista_ndarray([ 0, 2, 36, 27, 7, 8, 81, 1, 18, 4, 54, 3, 6, 45,
| 72, 5, 63, 9, 35, 44, 11, 16, 89, 17, 10, 26, 62, 13,
| 12, 53, 80, 15, 14, 71, 19, 37, 55, 20, 38, 56, 21, 39,
| 57, 22, 40, 58, 23, 41, 59, 24, 42, 60, 25, 43, 61, 28,
| 82, 29, 83, 30, 84, 31, 85, 32, 86, 33, 87, 34, 88, 46,
| 73, 47, 74, 48, 75, 49, 76, 50, 77, 51, 78, 52, 79, 64,
| 65, 66, 67, 68, 69, 70])
| >>> surf['vtkOriginalCellIds']
| pyvista_ndarray([ 0, 0, 0, 1, 1, 1, 3, 3, 3, 2, 2, 2, 36, 36,
| 36, 37, 37, 37, 39, 39, 39, 38, 38, 38, 5, 5, 9, 9,
| 13, 13, 17, 17, 21, 21, 25, 25, 29, 29, 33, 33, 4, 4,
| 8, 8, 12, 12, 16, 16, 20, 20, 24, 24, 28, 28, 32, 32,
| 7, 7, 11, 11, 15, 15, 19, 19, 23, 23, 27, 27, 31, 31,
| 35, 35, 6, 6, 10, 10, 14, 14, 18, 18, 22, 22, 26, 26,
| 30, 30, 34, 34])
|
| Note that in the "vtkOriginalCellIds" array, the same original cells
| appears multiple times since this array represents the original cell of
| each surface cell extracted.
|
| See the :ref:`extract_surface_example` for more examples using this filter.
|
| extract_values(self: '_DataSetType', values: 'float | VectorLike[float] | MatrixLike[float] | dict[str, float] | dict[float, str] | None' = None, *, ranges: 'VectorLike[float] | MatrixLike[float] | dict[str, VectorLike[float]] | dict[tuple[float, float], str] | None' = None, scalars: 'str | None' = None, preference: "Literal['point', 'cell']" = 'point', component_mode: "Literal['any', 'all', 'multi'] | int" = 'all', invert: 'bool' = False, adjacent_cells: 'bool' = True, include_cells: 'bool | None' = None, split: 'bool' = False, pass_point_ids: 'bool' = True, pass_cell_ids: 'bool' = True, progress_bar: 'bool' = False)
| Return a subset of the mesh based on the value(s) of point or cell data.
|
| Points and cells may be extracted with a single value, multiple values, a range
| of values, or any mix of values and ranges. This enables threshold-like
| filtering of data in a discontinuous manner to extract a single label or groups
| of labels from categorical data, or to extract multiple regions from continuous
| data. Extracted values may optionally be split into separate meshes.
|
| This filter operates on point data and cell data distinctly:
|
| **Point data**
|
| All cells with at least one point with the specified value(s) are returned.
| Optionally, set ``adjacent_cells`` to ``False`` to only extract points from
| cells where all points in the cell strictly have the specified value(s).
| In these cases, a point is only included in the output if that point is part
| of an extracted cell.
|
| Alternatively, set ``include_cells`` to ``False`` to exclude cells from
| the operation completely and extract all points with a specified value.
|
| **Cell Data**
|
| Only the cells (and their points) with the specified values(s) are included
| in the output.
|
| Internally, :meth:`~pyvista.DataSetFilters.extract_points` is called to extract
| points for point data, and :meth:`~pyvista.DataSetFilters.extract_cells` is
| called to extract cells for cell data.
|
| By default, two arrays are included with the output: ``'vtkOriginalPointIds'``
| and ``'vtkOriginalCellIds'``. These arrays can be used to link the filtered
| points or cells directly to the input.
|
| .. versionadded:: 0.44
|
| Parameters
| ----------
| values : float | ArrayLike[float] | dict, optional
| Value(s) to extract. Can be a number, an iterable of numbers, or a dictionary
| with numeric entries. For ``dict`` inputs, either its keys or values may be
| numeric, and the other field must be strings. The numeric field is used as
| the input for this parameter, and if ``split`` is ``True``, the string field
| is used to set the block names of the returned :class:`~pyvista.MultiBlock`.
|
| .. note::
| When extracting multi-component values with ``component_mode=multi``,
| each value is specified as a multi-component scalar. In this case,
| ``values`` can be a single vector or an array of row vectors.
|
| ranges : ArrayLike[float] | dict, optional
| Range(s) of values to extract. Can be a single range (i.e. a sequence of
| two numbers in the form ``[lower, upper]``), a sequence of ranges, or a
| dictionary with range entries. Any combination of ``values`` and ``ranges``
| may be specified together. The endpoints of the ranges are included in the
| extraction. Ranges cannot be set when ``component_mode=multi``.
|
| For ``dict`` inputs, either its keys or values may be numeric, and the other
| field must be strings. The numeric field is used as the input for this
| parameter, and if ``split`` is ``True``, the string field is used to set the
| block names of the returned :class:`~pyvista.MultiBlock`.
|
| .. note::
| Use ``+/-`` infinity to specify an unlimited bound, e.g.:
|
| - ``[0, float('inf')]`` to extract values greater than or equal to zero.
| - ``[float('-inf'), 0]`` to extract values less than or equal to zero.
|
| scalars : str, optional
| Name of scalars to extract with. Defaults to currently active scalars.
|
| preference : str, default: 'point'
| When ``scalars`` is specified, this is the preferred array type to search
| for in the dataset. Must be either ``'point'`` or ``'cell'``.
|
| component_mode : int | 'any' | 'all' | 'multi', default: 'all'
| Specify the component(s) to use when ``scalars`` is a multi-component array.
| Has no effect when the scalars have a single component. Must be one of:
|
| - number: specify the component number as a 0-indexed integer. The selected
| component must have the specified value(s).
| - ``'any'``: any single component can have the specified value(s).
| - ``'all'``: all individual components must have the specified values(s).
| - ``'multi'``: the entire multi-component item must have the specified value.
|
| invert : bool, default: False
| Invert the extraction values. If ``True`` extract the points (with cells)
| which do *not* have the specified values.
|
| adjacent_cells : bool, default: True
| If ``True``, include cells (and their points) that contain at least one of
| the extracted points. If ``False``, only include cells that contain
| exclusively points from the extracted points list. Has no effect if
| ``include_cells`` is ``False``. Has no effect when extracting values from
| cell data.
|
| include_cells : bool, default: None
| Specify if cells shall be used for extraction or not. If ``False``, points
| with the specified values are extracted regardless of their cell
| connectivity, and all cells at the output will be vertex cells (one for each
| point.) Has no effect when extracting values from cell data.
|
| By default, this value is ``True`` if the input has at least one cell and
| ``False`` otherwise.
|
| split : bool, default: False
| If ``True``, each value in ``values`` and each range in ``range`` is
| extracted independently and returned as a :class:`~pyvista.MultiBlock`.
| The number of blocks returned equals the number of input values and ranges.
| The blocks may be named if a dictionary is used as input. See ``values``
| and ``ranges`` for details.
|
| .. note::
| Output blocks may contain empty meshes if no values meet the extraction
| criteria. This can impact plotting since empty meshes cannot be plotted
| by default. Use :meth:`pyvista.MultiBlock.clean` on the output to remove
| empty meshes, or set ``pv.global_theme.allow_empty_mesh = True`` to
| enable plotting empty meshes.
|
| pass_point_ids : bool, default: True
| Add a point array ``'vtkOriginalPointIds'`` that identifies the original
| points the extracted points correspond to.
|
| pass_cell_ids : bool, default: True
| Add a cell array ``'vtkOriginalCellIds'`` that identifies the original cells
| the extracted cells correspond to.
|
| progress_bar : bool, default: False
| Display a progress bar to indicate progress.
|
| See Also
| --------
| split_values
| Wrapper around this filter to split values and return a :class:`~pyvista.MultiBlock`.
| :meth:`~pyvista.ImageDataFilters.select_values`
| Similar filter specialized for :class:`~pyvista.ImageData`.
| extract_points
| Extract a subset of a mesh's points.
| extract_cells
| Extract a subset of a mesh's cells.
| threshold
| Similar filter for thresholding a mesh by value.
| partition
| Split a mesh into a number of sub-parts.
|
| Returns
| -------
| pyvista.UnstructuredGrid or pyvista.MultiBlock
| An extracted mesh or a composite of extracted meshes, depending on ``split``.
|
| Examples
| --------
| Extract a single value from a grid's point data.
|
| >>> import numpy as np
| >>> import pyvista as pv
| >>> from pyvista import examples
| >>> mesh = examples.load_uniform()
| >>> extracted = mesh.extract_values(0)
|
| Plot extracted values. Since adjacent cells are included by default, points with
| values other than ``0`` are included in the output.
|
| >>> extracted.get_data_range()
| (np.float64(0.0), np.float64(81.0))
| >>> extracted.plot()
|
| Set ``include_cells=False`` to only extract points. The output scalars now
| strictly contain zeros.
|
| >>> extracted = mesh.extract_values(0, include_cells=False)
| >>> extracted.get_data_range()
| (np.float64(0.0), np.float64(0.0))
| >>> extracted.plot(render_points_as_spheres=True, point_size=100)
|
| Use ``ranges`` to extract values from a grid's point data in range.
|
| Here, we use ``+/-`` infinity to extract all values of ``100`` or less.
|
| >>> extracted = mesh.extract_values(ranges=[-np.inf, 100])
| >>> extracted.plot()
|
| Extract every third cell value from cell data.
|
| >>> mesh = examples.load_hexbeam()
| >>> lower, upper = mesh.get_data_range()
| >>> step = 3
| >>> extracted = mesh.extract_values(
| ... range(lower, upper, step) # values 0, 3, 6, ...
| ... )
|
| Plot result and show an outline of the input for context.
|
| >>> pl = pv.Plotter()
| >>> _ = pl.add_mesh(extracted)
| >>> _ = pl.add_mesh(mesh.extract_all_edges())
| >>> pl.show()
|
| Any combination of values and ranges may be specified.
|
| E.g. extract a single value and two ranges, and split the result into separate
| blocks of a MultiBlock.
|
| >>> extracted = mesh.extract_values(
| ... values=18, ranges=[[0, 8], [29, 40]], split=True
| ... )
| >>> extracted
| MultiBlock (...)
| N Blocks: 3
| X Bounds: 0.000e+00, 1.000e+00
| Y Bounds: 0.000e+00, 1.000e+00
| Z Bounds: 0.000e+00, 5.000e+00
| >>> extracted.plot(multi_colors=True)
|
| Extract values from multi-component scalars.
|
| First, create a point cloud with a 3-component RGB color array.
|
| >>> rng = np.random.default_rng(seed=1)
| >>> points = rng.random((30, 3))
| >>> colors = rng.random((30, 3))
| >>> point_cloud = pv.PointSet(points)
| >>> point_cloud['colors'] = colors
| >>> plot_kwargs = dict(render_points_as_spheres=True, point_size=50, rgb=True)
| >>> point_cloud.plot(**plot_kwargs)
|
| Extract values from a single component.
|
| E.g. extract points with a strong red component (i.e. > 0.8).
|
| >>> extracted = point_cloud.extract_values(ranges=[0.8, 1.0], component_mode=0)
| >>> extracted.plot(**plot_kwargs)
|
| Extract values from all components.
|
| E.g. extract points where all RGB components are dark (i.e. < 0.5).
|
| >>> extracted = point_cloud.extract_values(
| ... ranges=[0.0, 0.5], component_mode='all'
| ... )
| >>> extracted.plot(**plot_kwargs)
|
| Extract specific multi-component values.
|
| E.g. round the scalars to create binary RGB components, and extract only green
| and blue components.
|
| >>> point_cloud['colors'] = np.round(point_cloud['colors'])
| >>> green = [0, 1, 0]
| >>> blue = [0, 0, 1]
| >>>
| >>> extracted = point_cloud.extract_values(
| ... values=[blue, green],
| ... component_mode='multi',
| ... )
| >>> extracted.plot(**plot_kwargs)
|
| Use the original IDs returned by the extraction to modify the original point
| cloud.
|
| For example, change the color of the blue and green points to yellow.
|
| >>> point_ids = extracted['vtkOriginalPointIds']
| >>> yellow = [1, 1, 0]
| >>> point_cloud['colors'][point_ids] = yellow
| >>> point_cloud.plot(**plot_kwargs)
|
| gaussian_splatting(self: '_DataSetType', *, radius: 'float' = 0.1, dimensions: 'VectorLike[int]' = (50, 50, 50), progress_bar: 'bool' = False)
| Splat points into a volume using a Gaussian distribution.
|
| This filter uses :vtk:`vtkGaussianSplatter` to splat points into a volume
| dataset. Each point is surrounded with a Gaussian distribution function
| weighted by input scalar data. The distribution function is volumetrically
| sampled to create a structured dataset.
|
| .. versionadded:: 0.46
|
| Parameters
| ----------
| radius : float, default: 0.1
| This value is expressed as a percentage of the length of the longest side of
| the sampling volume. This determines the "width" of the splatter in
| terms of the distribution. Smaller numbers greatly reduce execution time.
|
| dimensions : VectorLike[int], default: (50, 50, 50)
| Sampling dimensions of the structured point set. Higher values produce better
| results but are much slower. This is the :attr:`~pyvista.ImageData.dimensions`
| of the returned :class:`~pyvista.ImageData`.
|
| progress_bar : bool, default: False
| Display a progress bar to indicate progress.
|
| Returns
| -------
| pyvista.ImageData
| Image data with scalar values representing the splatting
| of the points.
|
| See Also
| --------
| voxelize_binary_mask
| Alternative method for generating :class:`~pyvista.ImageData` from a dataset.
|
| Examples
| --------
| Create an image data volume from a point cloud using gaussian splatter.
|
| >>> import pyvista as pv
|
| Load the Stanford Bunny mesh.
|
| >>> bunny = pv.examples.download_bunny()
|
| Apply Gaussian splatter to generate a volumetric representation.
|
| >>> volume = bunny.gaussian_splatting(radius=0.01)
|
| Threshold the volume to filter out low-density regions.
|
| >>> threshed = volume.threshold(0.05)
|
| Visualize the thresholded volume with semi-transparency and no scalar bar.
|
| >>> threshed.plot(opacity=0.5, show_scalar_bar=False)
|
| glyph(self: '_DataSetType', orient: 'bool | str' = True, scale: 'bool | str' = True, factor: 'float' = 1.0, geom: '_vtk.vtkDataSet | DataSet | Sequence[_vtk.vtkDataSet | DataSet] | None' = None, indices: 'VectorLike[int] | None' = None, tolerance: 'float | None' = None, absolute: 'bool' = False, clamping: 'bool' = False, rng: 'VectorLike[float] | None' = None, color_mode: "Literal['scale', 'scalar', 'vector']" = 'scale', progress_bar: 'bool' = False)
| Copy a geometric representation (called a glyph) to the input dataset.
|
| The glyph may be oriented along the input vectors, and it may
| be scaled according to scalar data or vector
| magnitude. Passing a table of glyphs to choose from based on
| scalars or vector magnitudes is also supported. The arrays
| used for ``orient`` and ``scale`` must be either both point data
| or both cell data.
|
| Parameters
| ----------
| orient : bool | str, default: True
| If ``True``, use the active vectors array to orient the glyphs.
| If string, the vector array to use to orient the glyphs.
| If ``False``, the glyphs will not be orientated.
|
| scale : bool | str | sequence[float], default: True
| If ``True``, use the active scalars to scale the glyphs.
| If string, the scalar array to use to scale the glyphs.
| If ``False``, the glyphs will not be scaled.
|
| factor : float, default: 1.0
| Scale factor applied to scaling array.
|
| geom : :vtk:`vtkDataSet` | tuple[:vtk:`vtkDataSet`], optional
| The geometry to use for the glyph. If missing, an arrow glyph
| is used. If a sequence, the datasets inside define a table of
| geometries to choose from based on scalars or vectors. In this
| case a sequence of numbers of the same length must be passed as
| ``indices``. The values of the range (see ``rng``) affect lookup
| in the table.
|
| .. note::
|
| The reference direction is relative to ``(1, 0, 0)`` on the
| provided geometry. That is, the provided geometry will be rotated
| from ``(1, 0, 0)`` to the direction of the ``orient`` vector at
| each point.
|
| indices : sequence[float], optional
| Specifies the index of each glyph in the table for lookup in case
| ``geom`` is a sequence. If given, must be the same length as
| ``geom``. If missing, a default value of ``range(len(geom))`` is
| used. Indices are interpreted in terms of the scalar range
| (see ``rng``). Ignored if ``geom`` has length 1.
|
| tolerance : float, optional
| Specify tolerance in terms of fraction of bounding box length.
| Float value is between 0 and 1. Default is None. If ``absolute``
| is ``True`` then the tolerance can be an absolute distance.
| If ``None``, points merging as a preprocessing step is disabled.
|
| absolute : bool, default: False
| Control if ``tolerance`` is an absolute distance or a fraction.
|
| clamping : bool, default: False
| Turn on/off clamping of "scalar" values to range.
|
| rng : sequence[float], optional
| Set the range of values to be considered by the filter
| when scalars values are provided.
|
| color_mode : str, optional, default: ``'scale'``
| If ``'scale'`` , color the glyphs by scale.
| If ``'scalar'`` , color the glyphs by scalar.
| If ``'vector'`` , color the glyphs by vector.
|
| .. versionadded:: 0.44
|
| progress_bar : bool, default: False
| Display a progress bar to indicate progress.
|
| Returns
| -------
| pyvista.PolyData
| Glyphs at either the cell centers or points.
|
| Examples
| --------
| Create arrow glyphs oriented by vectors and scaled by scalars.
| Factor parameter is used to reduce the size of the arrows.
|
| >>> import pyvista as pv
| >>> from pyvista import examples
| >>> mesh = examples.load_random_hills()
| >>> arrows = mesh.glyph(scale='Normals', orient='Normals', tolerance=0.05)
| >>> pl = pv.Plotter()
| >>> actor = pl.add_mesh(arrows, color='black')
| >>> actor = pl.add_mesh(
| ... mesh,
| ... scalars='Elevation',
| ... cmap='terrain',
| ... show_scalar_bar=False,
| ... )
| >>> pl.show()
|
| See :ref:`glyph_example`, :ref:`movie_glyphs_example`, and
| :ref:`glyph_table_example` for more examples using this filter.
|
| integrate_data(self: '_DataSetType', progress_bar: 'bool' = False)
| Integrate point and cell data.
|
| Area or volume is also provided in point data.
|
| This filter uses the VTK :vtk:`vtkIntegrateAttributes`
| and requires VTK v9.1.0 or newer.
|
| Parameters
| ----------
| progress_bar : bool, default: False
| Display a progress bar to indicate progress.
|
| Returns
| -------
| pyvista.UnstructuredGrid
| Mesh with 1 point and 1 vertex cell with integrated data in point
| and cell data.
|
| Examples
| --------
| Integrate data on a sphere mesh.
|
| >>> import pyvista as pv
| >>> import numpy as np
| >>> sphere = pv.Sphere(theta_resolution=100, phi_resolution=100)
| >>> sphere.point_data['data'] = 2 * np.ones(sphere.n_points)
| >>> integrated = sphere.integrate_data()
|
| There is only 1 point and cell, so access the only value.
|
| >>> integrated['Area'][0]
| np.float64(3.14)
| >>> integrated['data'][0]
| np.float64(6.28)
|
| See the :ref:`integrate_data_example` for more examples using this filter.
|
| interpolate(self: '_DataSetType', target: 'DataSet | _vtk.vtkDataSet', sharpness: 'float' = 2.0, radius: 'float' = 1.0, strategy: "Literal['null_value', 'mask_points', 'closest_point']" = 'null_value', null_value: 'float' = 0.0, n_points: 'int | None' = None, pass_cell_data: 'bool' = True, pass_point_data: 'bool' = True, progress_bar: 'bool' = False)
| Interpolate values onto this mesh from a given dataset.
|
| The ``target`` dataset is typically a point cloud. Only point data from
| the ``target`` mesh will be interpolated onto points of this mesh. Whether
| preexisting point and cell data of this mesh are preserved in the
| output can be customized with the ``pass_point_data`` and
| ``pass_cell_data`` parameters.
|
| This uses a Gaussian interpolation kernel. Use the ``sharpness`` and
| ``radius`` parameters to adjust this kernel. You can also switch this
| kernel to use an N closest points approach.
|
| If the cell topology is more useful for interpolating, e.g. from a
| discretized FEM or CFD simulation, use
| :func:`pyvista.DataObjectFilters.sample` instead.
|
| Parameters
| ----------
| target : pyvista.DataSet
| The vtk data object to sample from. Point and cell arrays from
| this object are interpolated onto this mesh.
|
| sharpness : float, default: 2.0
| Set the sharpness (i.e., falloff) of the Gaussian kernel. As the
| sharpness increases the effects of distant points are reduced.
|
| radius : float, optional
| Specify the radius within which the basis points must lie.
|
| strategy : str, default: "null_value"
| Specify a strategy to use when encountering a "null" point during
| the interpolation process. Null points occur when the local
| neighborhood (of nearby points to interpolate from) is empty. If
| the strategy is set to ``'mask_points'``, then an output array is
| created that marks points as being valid (=1) or null (invalid =0)
| (and the NullValue is set as well). If the strategy is set to
| ``'null_value'``, then the output data value(s) are set to the
| ``null_value`` (specified in the output point data). Finally, the
| strategy ``'closest_point'`` is to simply use the closest point to
| perform the interpolation.
|
| null_value : float, default: 0.0
| Specify the null point value. When a null point is encountered
| then all components of each null tuple are set to this value.
|
| n_points : int, optional
| If given, specifies the number of the closest points used to form
| the interpolation basis. This will invalidate the radius argument
| in favor of an N closest points approach. This typically has poorer
| results.
|
| pass_cell_data : bool, default: True
| Preserve input mesh's original cell data arrays.
|
| pass_point_data : bool, default: True
| Preserve input mesh's original point data arrays.
|
| progress_bar : bool, default: False
| Display a progress bar to indicate progress.
|
| Returns
| -------
| pyvista.DataSet
| Interpolated dataset. Return type matches input.
|
| See Also
| --------
| pyvista.DataObjectFilters.sample
| Resample array data from one mesh onto another.
|
| :meth:`pyvista.ImageDataFilters.resample`
| Resample image data to modify its dimensions and spacing.
|
| Examples
| --------
| Interpolate the values of 5 points onto a sample plane.
|
| >>> import pyvista as pv
| >>> import numpy as np
| >>> rng = np.random.default_rng(7)
| >>> point_cloud = rng.random((5, 3))
| >>> point_cloud[:, 2] = 0
| >>> point_cloud -= point_cloud.mean(0)
| >>> pdata = pv.PolyData(point_cloud)
| >>> pdata['values'] = rng.random(5)
| >>> plane = pv.Plane()
| >>> plane.clear_data()
| >>> plane = plane.interpolate(pdata, sharpness=3)
| >>> pl = pv.Plotter()
| >>> _ = pl.add_mesh(pdata, render_points_as_spheres=True, point_size=50)
| >>> _ = pl.add_mesh(plane, style='wireframe', line_width=5)
| >>> pl.show()
|
| See :ref:`interpolate_example`, :ref:`interpolate_sample_example`,
| and :ref:`resampling_example` for more examples using this filter.
|
| merge(self: '_DataSetType', grid: 'DataSet | _vtk.vtkDataSet | MultiBlock | Sequence[DataSet | _vtk.vtkDataSet] | None' = None, merge_points: 'bool' = True, tolerance: 'float' = 0.0, inplace: 'bool' = False, main_has_priority: 'bool | None' = None, progress_bar: 'bool' = False)
| Join one or many other grids to this grid.
|
| Can be used to merge points of adjacent cells when no grids
| are input.
|
| .. note::
| The ``+`` operator between two meshes uses this filter with
| the default parameters. When the target mesh is already a
| :class:`pyvista.UnstructuredGrid`, in-place merging via
| ``+=`` is similarly possible.
|
|
| .. warning::
|
| The merge order of this filter depends on the installed version
| of VTK. For example, if merging meshes ``a``, ``b``, and ``c``,
| the merged order is ``bca`` for VTK<9.5 and ``abc`` for VTK>=9.5.
| This may be a breaking change for some applications. If only
| merging two meshes, it may be possible to maintain `some` backwards
| compatibility by swapping the input order of the two meshes,
| though this may also affect the merged arrays and is therefore
| not fully backwards-compatible.
|
| Parameters
| ----------
| grid : :vtk:`vtkUnstructuredGrid` | list[:vtk:`vtkUnstructuredGrid`], optional
| Grids to merge to this grid.
|
| merge_points : bool, default: True
| Points in exactly the same location will be merged between
| the two meshes. Warning: this can leave degenerate point data.
|
| tolerance : float, default: 0.0
| The absolute tolerance to use to find coincident points when
| ``merge_points=True``.
|
| inplace : bool, default: False
| Updates grid inplace when True if the input type is an
| :class:`pyvista.UnstructuredGrid`.
|
| main_has_priority : bool, default: True
| When this parameter is true and merge_points is true,
| the arrays of the merging grids will be overwritten
| by the original main mesh.
|
| .. deprecated:: 0.46
|
| This keyword will be removed in a future version. The main mesh
| always has priority with VTK 9.5.0 or later.
|
| progress_bar : bool, default: False
| Display a progress bar to indicate progress.
|
| Returns
| -------
| pyvista.UnstructuredGrid
| Merged grid.
|
| Notes
| -----
| When two or more grids are joined, the type and name of each
| array must match or the arrays will be ignored and not
| included in the final merged mesh.
|
| Examples
| --------
| Merge three separate spheres into a single mesh.
|
| >>> import pyvista as pv
| >>> sphere_a = pv.Sphere(center=(1, 0, 0))
| >>> sphere_b = pv.Sphere(center=(0, 1, 0))
| >>> sphere_c = pv.Sphere(center=(0, 0, 1))
| >>> merged = sphere_a.merge([sphere_b, sphere_c])
| >>> merged.plot()
|
| merge_points(self: '_DataSetType', tolerance: 'float' = 0.0, inplace: 'bool' = False, progress_bar: 'bool' = False)
| Merge duplicate points in this mesh.
|
| .. versionadded:: 0.45
|
| Parameters
| ----------
| tolerance : float, optional
| Specify a tolerance to use when comparing points. Points within
| this tolerance will be merged.
|
| inplace : bool, default: False
| Overwrite the original mesh with the result. Only possible if the input
| is :class:`~pyvista.PolyData` or :class:`~pyvista.UnstructuredGrid`.
|
| progress_bar : bool, default: False
| Display a progress bar to indicate progress.
|
| Returns
| -------
| pyvista.PolyData or pyvista.UnstructuredGrid
| Mesh with merged points. PolyData is returned only if the input is PolyData.
|
| Examples
| --------
| Merge duplicate points in a mesh.
|
| >>> import pyvista as pv
| >>> mesh = pv.Cylinder(resolution=4)
| >>> mesh.n_points
| 16
| >>> _ = mesh.merge_points(inplace=True)
| >>> mesh.n_points
| 8
|
| oriented_bounding_box(self: '_DataSetType', box_style: "Literal['frame', 'outline', 'face']" = 'face', *, axis_0_direction: 'VectorLike[float] | str | None' = None, axis_1_direction: 'VectorLike[float] | str | None' = None, axis_2_direction: 'VectorLike[float] | str | None' = None, frame_width: 'float' = 0.1, return_meta: 'bool' = False, as_composite: 'bool' = True)
| Return an oriented bounding box (OBB) for this dataset.
|
| By default, the bounding box is a :class:`~pyvista.MultiBlock` with six
| :class:`PolyData` comprising the faces of a cube. The blocks are named and
| ordered as ``('+X','-X','+Y','-Y','+Z','-Z')``.
|
| The box can optionally be styled as an outline or frame.
|
| .. note::
|
| The names of the blocks of the returned :class:`~pyvista.MultiBlock`
| correspond to the oriented box's local axes, not the global x-y-z axes.
| E.g. the normal of the ``'+X'`` face of the returned box has the same
| direction as the box's primary axis, and is not necessarily pointing in
| the +x direction ``(1, 0, 0)``.
|
| .. versionadded:: 0.45
|
| Parameters
| ----------
| box_style : 'frame' | 'outline' | 'face', default: 'face'
| Choose the style of the box. If ``'face'`` (default), each face of the box
| is a single quad cell. If ``'outline'``, the edges of each face are returned
| as line cells. If ``'frame'``, the center portion of each face is removed to
| create a picture-frame style border with each face having four quads (one
| for each side of the frame). Use ``frame_width`` to control the size of the
| frame.
|
| axis_0_direction : VectorLike[float] | str, optional
| Approximate direction vector of this mesh's primary axis. If set, the first
| axis in the returned ``axes`` metadata is flipped such that it best aligns
| with the specified vector. Can be a vector or string specifying the axis by
| name (e.g. ``'x'`` or ``'-x'``, etc.).
|
| axis_1_direction : VectorLike[float] | str, optional
| Approximate direction vector of this mesh's secondary axis. If set, the second
| axis in the returned ``axes`` metadata is flipped such that it best aligns
| with the specified vector. Can be a vector or string specifying the axis by
| name (e.g. ``'x'`` or ``'-x'``, etc.).
|
| axis_2_direction : VectorLike[float] | str, optional
| Approximate direction vector of this mesh's third axis. If set, the third
| axis in the returned ``axes`` metadata is flipped such that it best aligns
| with the specified vector. Can be a vector or string specifying the axis by
| name (e.g. ``'x'`` or ``'-x'``, etc.).
|
| frame_width : float, optional
| Set the width of the frame. Only has an effect if ``box_style`` is
| ``'frame'``. Values must be between ``0.0`` (minimal frame) and ``1.0``
| (large frame). The frame is scaled to ensure it has a constant width.
|
| return_meta : bool, default: False
| If ``True``, also returns the corner point and the three axes vectors
| defining the orientation of the box. The sign of the axes vectors can be
| controlled using the ``axis_#_direction`` arguments.
|
| as_composite : bool, default: True
| Return the box as a :class:`pyvista.MultiBlock` with six blocks: one for
| each face. Set this ``False`` to merge the output and return
| :class:`~pyvista.PolyData`.
|
| See Also
| --------
| bounding_box
| Similar filter for an axis-aligned bounding box (AABB).
|
| align_xyz
| Align a mesh to the world x-y-z axes. Used internally by this filter.
|
| pyvista.Plotter.add_bounding_box
| Add a bounding box to a scene.
|
| pyvista.CubeFacesSource
| Generate the faces of a cube. Used internally by this filter.
|
| Returns
| -------
| pyvista.MultiBlock or pyvista.PolyData
| MultiBlock with six named cube faces when ``as_composite=True`` and
| PolyData otherwise.
|
| numpy.ndarray
| The box's corner point corresponding to the origin of its axes if
| ``return_meta=True``.
|
| numpy.ndarray
| The box's orthonormal axes vectors if ``return_meta=True``.
|
| Examples
| --------
| Create a bounding box for a dataset.
|
| >>> import pyvista as pv
| >>> from pyvista import examples
| >>> mesh = examples.download_oblique_cone()
| >>> box = mesh.oriented_bounding_box()
|
| Plot the mesh and its bounding box.
|
| >>> pl = pv.Plotter()
| >>> _ = pl.add_mesh(mesh, color='red')
| >>> _ = pl.add_mesh(box, opacity=0.5)
| >>> pl.show()
|
| Return the metadata for the box.
|
| >>> box, point, axes = mesh.oriented_bounding_box('outline', return_meta=True)
|
| Use the metadata to plot the box's axes using :class:`~pyvista.AxesAssembly`.
| The assembly is aligned with the x-y-z axes and positioned at the origin by
| default. Create a transformation to scale, then rotate, then translate the
| assembly to the corner point of the box. The transpose of the axes is used
| as an inverted rotation matrix.
|
| >>> scale = box.length / 4
| >>> transform = pv.Transform().scale(scale).rotate(axes.T).translate(point)
| >>> axes_assembly = pv.AxesAssembly(user_matrix=transform.matrix)
|
| Plot the box and the axes.
|
| >>> pl = pv.Plotter()
| >>> _ = pl.add_mesh(mesh)
| >>> _ = pl.add_mesh(box, color='black', line_width=5)
| >>> _ = pl.add_actor(axes_assembly)
| >>> pl.show()
|
| Note how the box's z-axis is pointing from the cone's tip to its base. If we
| want to flip this axis, we can "seed" its direction as the ``'-z'`` direction.
|
| >>> box, _, axes = mesh.oriented_bounding_box(
| ... 'outline', axis_2_direction='-z', return_meta=True
| ... )
| >>>
|
| Plot the box and axes again. This time, use :class:`~pyvista.AxesAssemblySymmetric`
| and position the axes in the center of the box.
|
| >>> center = pv.merge(box).points.mean(axis=0)
| >>> scale = box.length / 2
| >>> transform = pv.Transform().scale(scale).rotate(axes.T).translate(center)
| >>> axes_assembly = pv.AxesAssemblySymmetric(user_matrix=transform.matrix)
|
| >>> pl = pv.Plotter()
| >>> _ = pl.add_mesh(mesh)
| >>> _ = pl.add_mesh(box, color='black', line_width=5)
| >>> _ = pl.add_actor(axes_assembly)
| >>> pl.show()
|
| outline(self: '_DataObjectType', generate_faces: 'bool' = False, progress_bar: 'bool' = False)
| Produce an outline of the full extent for the input dataset.
|
| Parameters
| ----------
| generate_faces : bool, default: False
| Generate solid faces for the box. This is disabled by default.
|
| progress_bar : bool, default: False
| Display a progress bar to indicate progress.
|
| Returns
| -------
| pyvista.PolyData
| Mesh containing an outline of the original dataset.
|
| See Also
| --------
| bounding_box
| Similar filter with additional options.
|
| Examples
| --------
| Generate and plot the outline of a sphere. This is
| effectively the ``(x, y, z)`` bounds of the mesh.
|
| >>> import pyvista as pv
| >>> sphere = pv.Sphere()
| >>> outline = sphere.outline()
| >>> pv.plot([sphere, outline], line_width=5)
|
| See :ref:`using_filters_example` for more examples using this filter.
|
| outline_corners(self: '_DataObjectType', factor: 'float' = 0.2, progress_bar: 'bool' = False)
| Produce an outline of the corners for the input dataset.
|
| Parameters
| ----------
| factor : float, default: 0.2
| Controls the relative size of the corners to the length of
| the corresponding bounds.
|
| progress_bar : bool, default: False
| Display a progress bar to indicate progress.
|
| Returns
| -------
| pyvista.PolyData
| Mesh containing outlined corners.
|
| Examples
| --------
| Generate and plot the corners of a sphere. This is
| effectively the ``(x, y, z)`` bounds of the mesh.
|
| >>> import pyvista as pv
| >>> sphere = pv.Sphere()
| >>> corners = sphere.outline_corners(factor=0.1)
| >>> pv.plot([sphere, corners], line_width=5)
|
| pack_labels(self: '_DataSetType', sort: 'bool' = False, scalars: 'str | None' = None, preference: "Literal['point', 'cell']" = 'point', output_scalars: 'str | None' = None, progress_bar: 'bool' = False, inplace: 'bool' = False)
| Renumber labeled data such that labels are contiguous.
|
| This filter renumbers scalar label data of any type with ``N`` labels
| such that the output labels are contiguous from ``[0, N)``. The
| output may optionally be sorted by label count.
|
| The output array ``'packed_labels'`` is added to the output by default,
| and is automatically set as the active scalars.
|
| See Also
| --------
| sort_labels
| Similar function with ``sort=True`` by default.
|
| Notes
| -----
| This filter uses :vtk:`vtkPackLabels` as the underlying method which
| requires VTK version 9.3 or higher. If :vtk:`vtkPackLabels` is not
| available, packing is done with ``NumPy`` instead which may be
| slower. For best performance, consider upgrading VTK.
|
| .. versionadded:: 0.43
|
| Parameters
| ----------
| sort : bool, default: False
| Whether to sort the output by label count in descending order
| (i.e. from largest to smallest).
|
| scalars : str, optional
| Name of scalars to pack. Defaults to currently active scalars.
|
| preference : str, default: "point"
| When ``scalars`` is specified, this is the preferred array
| type to search for in the dataset. Must be either
| ``'point'`` or ``'cell'``.
|
| output_scalars : str, None
| Name of the packed output scalars. By default, the output is
| saved to ``'packed_labels'``.
|
| progress_bar : bool, default: False
| If ``True``, display a progress bar. Has no effect if VTK
| version is lower than 9.3.
|
| inplace : bool, default: False
| If ``True``, the mesh is updated in-place.
|
| Returns
| -------
| pyvista.DataSet
| Dataset with packed labels.
|
| Examples
| --------
| Pack segmented image labels.
|
| Load non-contiguous image labels
|
| >>> from pyvista import examples
| >>> import numpy as np
| >>> image_labels = examples.load_frog_tissues()
|
| Show range of labels
|
| >>> image_labels.get_data_range()
| (np.uint8(0), np.uint8(29))
|
| Find 'gaps' in the labels
|
| >>> label_numbers = np.unique(image_labels.active_scalars)
| >>> label_max = np.max(label_numbers)
| >>> missing_labels = set(range(label_max)) - set(label_numbers)
| >>> len(missing_labels)
| 4
|
| Pack labels to remove gaps
|
| >>> packed_labels = image_labels.pack_labels()
|
| Show range of packed labels
|
| >>> packed_labels.get_data_range()
| (np.uint8(0), np.uint8(25))
|
| partition(self: '_DataSetType', n_partitions: 'int', generate_global_id: 'bool' = False, as_composite: 'bool' = True)
| Break down input dataset into a requested number of partitions.
|
| Cells on boundaries are uniquely assigned to each partition without duplication.
|
| It uses a kdtree implementation that builds balances the cell
| centers among a requested number of partitions. The current implementation
| only supports power-of-2 target partition. If a non-power of two value
| is specified for ``n_partitions``, then the load balancing simply
| uses the power-of-two greater than the requested value
|
| For more details, see :vtk:`vtkRedistributeDataSetFilter`.
|
| Parameters
| ----------
| n_partitions : int
| Specify the number of partitions to split the input dataset
| into. Current implementation results in a number of partitions equal
| to the power of 2 greater than or equal to the chosen value.
|
| generate_global_id : bool, default: False
| Generate global cell ids if ``None`` are present in the input. If
| global cell ids are present in the input then this flag is
| ignored.
|
| This is stored as ``"vtkGlobalCellIds"`` within the ``cell_data``
| of the output dataset(s).
|
| as_composite : bool, default: True
| Return the partitioned dataset as a :class:`pyvista.MultiBlock`.
|
| See Also
| --------
| split_bodies, extract_values
|
| Returns
| -------
| pyvista.MultiBlock or pyvista.UnstructuredGrid
| UnStructuredGrid if ``as_composite=False`` and MultiBlock when ``True``.
|
| Examples
| --------
| Partition a simple ImageData into a :class:`pyvista.MultiBlock`
| containing each partition.
|
| >>> import pyvista as pv
| >>> grid = pv.ImageData(dimensions=(5, 5, 5))
| >>> out = grid.partition(4, as_composite=True)
| >>> out.plot(multi_colors=True, show_edges=True)
|
| Partition of the Stanford bunny.
|
| >>> from pyvista import examples
| >>> mesh = examples.download_bunny()
| >>> out = mesh.partition(4, as_composite=True)
| >>> out.plot(multi_colors=True, cpos='xy')
|
| plot_over_circular_arc(self: '_DataSetType', pointa: 'VectorLike[float]', pointb: 'VectorLike[float]', center: 'VectorLike[float]', resolution: 'int | None' = None, scalars: 'str | None' = None, title: 'str | None' = None, ylabel: 'str | None' = None, figsize: 'tuple[int, int] | None' = None, figure: 'bool' = True, show: 'bool' = True, tolerance: 'float | None' = None, fname: 'str | None' = None, progress_bar: 'bool' = False) -> 'None'
| Sample a dataset along a circular arc and plot it.
|
| Plot the variables of interest in 2D where the X-axis is
| distance from Point A and the Y-axis is the variable of
| interest. Note that this filter returns ``None``.
|
| Parameters
| ----------
| pointa : sequence[float]
| Location in ``[x, y, z]``.
|
| pointb : sequence[float]
| Location in ``[x, y, z]``.
|
| center : sequence[float]
| Location in ``[x, y, z]``.
|
| resolution : int, optional
| Number of pieces to divide the circular arc into. Defaults
| to number of cells in the input mesh. Must be a positive
| integer.
|
| scalars : str, optional
| The string name of the variable in the input dataset to
| probe. The active scalar is used by default.
|
| title : str, optional
| The string title of the ``matplotlib`` figure.
|
| ylabel : str, optional
| The string label of the Y-axis. Defaults to the variable name.
|
| figsize : tuple(int), optional
| The size of the new figure.
|
| figure : bool, default: True
| Flag on whether or not to create a new figure.
|
| show : bool, default: True
| Shows the ``matplotlib`` figure when ``True``.
|
| tolerance : float, optional
| Tolerance used to compute whether a point in the source is
| in a cell of the input. If not given, tolerance is
| automatically generated.
|
| fname : str, optional
| Save the figure this file name when set.
|
| progress_bar : bool, default: False
| Display a progress bar to indicate progress.
|
| Examples
| --------
| Sample a dataset along a high resolution circular arc and plot.
|
| >>> from pyvista import examples
| >>> mesh = examples.load_uniform()
| >>> a = [mesh.bounds.x_min, mesh.bounds.y_min, mesh.bounds.z_max]
| >>> b = [mesh.bounds.x_max, mesh.bounds.y_min, mesh.bounds.z_min]
| >>> center = [
| ... mesh.bounds.x_min,
| ... mesh.bounds.y_min,
| ... mesh.bounds.z_min,
| ... ]
| >>> mesh.plot_over_circular_arc(
| ... a, b, center, resolution=1000, show=False
| ... ) # doctest:+SKIP
|
| plot_over_circular_arc_normal(self: '_DataSetType', center: 'VectorLike[float]', resolution: 'int | None' = None, normal: 'VectorLike[float] | None' = None, polar: 'VectorLike[float] | None' = None, angle: 'float | None' = None, scalars: 'str | None' = None, title: 'str | None' = None, ylabel: 'str | None' = None, figsize: 'tuple[int, int] | None' = None, figure: 'bool' = True, show: 'bool' = True, tolerance: 'float | None' = None, fname: 'str | None' = None, progress_bar: 'bool' = False) -> 'None'
| Sample a dataset along a circular arc defined by a normal and polar vector and plot it.
|
| Plot the variables of interest in 2D where the X-axis is
| distance from Point A and the Y-axis is the variable of
| interest. Note that this filter returns ``None``.
|
| Parameters
| ----------
| center : sequence[int]
| Location in ``[x, y, z]``.
|
| resolution : int, optional
| Number of pieces to divide circular arc into. Defaults to
| number of cells in the input mesh. Must be a positive
| integer.
|
| normal : sequence[float], optional
| The normal vector to the plane of the arc. By default it
| points in the positive Z direction.
|
| polar : sequence[float], optional
| Starting point of the arc in polar coordinates. By
| default it is the unit vector in the positive x direction.
|
| angle : float, optional
| Arc length (in degrees), beginning at the polar vector. The
| direction is counterclockwise. By default it is 360.
|
| scalars : str, optional
| The string name of the variable in the input dataset to
| probe. The active scalar is used by default.
|
| title : str, optional
| The string title of the `matplotlib` figure.
|
| ylabel : str, optional
| The string label of the Y-axis. Defaults to variable name.
|
| figsize : tuple(int), optional
| The size of the new figure.
|
| figure : bool, optional
| Flag on whether or not to create a new figure.
|
| show : bool, default: True
| Shows the matplotlib figure.
|
| tolerance : float, optional
| Tolerance used to compute whether a point in the source is
| in a cell of the input. If not given, tolerance is
| automatically generated.
|
| fname : str, optional
| Save the figure this file name when set.
|
| progress_bar : bool, default: False
| Display a progress bar to indicate progress.
|
| See Also
| --------
| :ref:`plot_over_circular_arc_example`
|
| Examples
| --------
| Sample a dataset along a high resolution circular arc and plot.
|
| >>> from pyvista import examples
| >>> mesh = examples.load_uniform()
| >>> normal = normal = [0, 0, 1]
| >>> polar = [0, 9, 0]
| >>> angle = 90
| >>> center = [
| ... mesh.bounds.x_min,
| ... mesh.bounds.y_min,
| ... mesh.bounds.z_min,
| ... ]
| >>> mesh.plot_over_circular_arc_normal(
| ... center, polar=polar, angle=angle
| ... ) # doctest:+SKIP
|
| plot_over_line(self: '_DataSetType', pointa: 'VectorLike[float]', pointb: 'VectorLike[float]', resolution: 'int | None' = None, scalars: 'str | None' = None, title: 'str | None' = None, ylabel: 'str | None' = None, figsize: 'tuple[int, int] | None' = None, figure: 'bool' = True, show: 'bool' = True, tolerance: 'float | None' = None, fname: 'str | None' = None, progress_bar: 'bool' = False) -> 'None'
| Sample a dataset along a high resolution line and plot.
|
| Plot the variables of interest in 2D using matplotlib where the
| X-axis is distance from Point A and the Y-axis is the variable
| of interest. Note that this filter returns ``None``.
|
| Parameters
| ----------
| pointa : sequence[float]
| Location in ``[x, y, z]``.
|
| pointb : sequence[float]
| Location in ``[x, y, z]``.
|
| resolution : int, optional
| Number of pieces to divide line into. Defaults to number of cells
| in the input mesh. Must be a positive integer.
|
| scalars : str, optional
| The string name of the variable in the input dataset to probe. The
| active scalar is used by default.
|
| title : str, optional
| The string title of the matplotlib figure.
|
| ylabel : str, optional
| The string label of the Y-axis. Defaults to variable name.
|
| figsize : tuple(int, int), optional
| The size of the new figure.
|
| figure : bool, default: True
| Flag on whether or not to create a new figure.
|
| show : bool, default: True
| Shows the matplotlib figure.
|
| tolerance : float, optional
| Tolerance used to compute whether a point in the source is in a
| cell of the input. If not given, tolerance is automatically generated.
|
| fname : str, optional
| Save the figure this file name when set.
|
| progress_bar : bool, default: False
| Display a progress bar to indicate progress.
|
| Examples
| --------
| See the :ref:`plot_over_line_example` example.
|
| sample_over_circular_arc(self: '_DataSetType', pointa: 'VectorLike[float]', pointb: 'VectorLike[float]', center: 'VectorLike[float]', resolution: 'int | None' = None, tolerance: 'float | None' = None, progress_bar: 'bool' = False)
| Sample a dataset over a circular arc.
|
| Parameters
| ----------
| pointa : sequence[float]
| Location in ``[x, y, z]``.
|
| pointb : sequence[float]
| Location in ``[x, y, z]``.
|
| center : sequence[float]
| Location in ``[x, y, z]``.
|
| resolution : int, optional
| Number of pieces to divide circular arc into. Defaults to
| number of cells in the input mesh. Must be a positive
| integer.
|
| tolerance : float, optional
| Tolerance used to compute whether a point in the source is
| in a cell of the input. If not given, tolerance is
| automatically generated.
|
| progress_bar : bool, default: False
| Display a progress bar to indicate progress.
|
| Returns
| -------
| pyvista.PolyData
| Arc containing the sampled data.
|
| Examples
| --------
| Sample a dataset over a circular arc and plot it.
|
| >>> import pyvista as pv
| >>> from pyvista import examples
| >>> uniform = examples.load_uniform()
| >>> uniform['height'] = uniform.points[:, 2]
| >>> pointa = [
| ... uniform.bounds.x_max,
| ... uniform.bounds.y_min,
| ... uniform.bounds.z_max,
| ... ]
| >>> pointb = [
| ... uniform.bounds.x_max,
| ... uniform.bounds.y_max,
| ... uniform.bounds.z_min,
| ... ]
| >>> center = [
| ... uniform.bounds.x_max,
| ... uniform.bounds.y_min,
| ... uniform.bounds.z_min,
| ... ]
| >>> sampled_arc = uniform.sample_over_circular_arc(
| ... pointa=pointa, pointb=pointb, center=center
| ... )
| >>> pl = pv.Plotter()
| >>> _ = pl.add_mesh(uniform, style='wireframe')
| >>> _ = pl.add_mesh(sampled_arc, line_width=10)
| >>> pl.show_axes()
| >>> pl.show()
|
| sample_over_circular_arc_normal(self: '_DataSetType', center: 'VectorLike[float]', resolution: 'int | None' = None, normal: 'VectorLike[float] | None' = None, polar: 'VectorLike[float] | None' = None, angle: 'float | None' = None, tolerance: 'float | None' = None, progress_bar: 'bool' = False)
| Sample a dataset over a circular arc defined by a normal and polar vector and plot it.
|
| The number of segments composing the polyline is controlled by
| setting the object resolution.
|
| Parameters
| ----------
| center : sequence[float]
| Location in ``[x, y, z]``.
|
| resolution : int, optional
| Number of pieces to divide circular arc into. Defaults to
| number of cells in the input mesh. Must be a positive
| integer.
|
| normal : sequence[float], optional
| The normal vector to the plane of the arc. By default it
| points in the positive Z direction.
|
| polar : sequence[float], optional
| Starting point of the arc in polar coordinates. By
| default it is the unit vector in the positive x direction.
|
| angle : float, optional
| Arc length (in degrees), beginning at the polar vector. The
| direction is counterclockwise. By default it is 360.
|
| tolerance : float, optional
| Tolerance used to compute whether a point in the source is
| in a cell of the input. If not given, tolerance is
| automatically generated.
|
| progress_bar : bool, default: False
| Display a progress bar to indicate progress.
|
| Returns
| -------
| pyvista.PolyData
| Sampled Dataset.
|
| Examples
| --------
| Sample a dataset over a circular arc.
|
| >>> import pyvista as pv
| >>> from pyvista import examples
| >>> uniform = examples.load_uniform()
| >>> uniform['height'] = uniform.points[:, 2]
| >>> normal = [0, 0, 1]
| >>> polar = [0, 9, 0]
| >>> center = [
| ... uniform.bounds.x_max,
| ... uniform.bounds.y_min,
| ... uniform.bounds.z_max,
| ... ]
| >>> arc = uniform.sample_over_circular_arc_normal(
| ... center=center, normal=normal, polar=polar
| ... )
| >>> pl = pv.Plotter()
| >>> _ = pl.add_mesh(uniform, style='wireframe')
| >>> _ = pl.add_mesh(arc, line_width=10)
| >>> pl.show_axes()
| >>> pl.show()
|
| sample_over_line(self: '_DataSetType', pointa: 'VectorLike[float]', pointb: 'VectorLike[float]', resolution: 'int | None' = None, tolerance: 'float | None' = None, progress_bar: 'bool' = False)
| Sample a dataset onto a line.
|
| Parameters
| ----------
| pointa : sequence[float]
| Location in ``[x, y, z]``.
|
| pointb : sequence[float]
| Location in ``[x, y, z]``.
|
| resolution : int, optional
| Number of pieces to divide line into. Defaults to number of cells
| in the input mesh. Must be a positive integer.
|
| tolerance : float, optional
| Tolerance used to compute whether a point in the source is in a
| cell of the input. If not given, tolerance is automatically generated.
|
| progress_bar : bool, default: False
| Display a progress bar to indicate progress.
|
| Returns
| -------
| pyvista.PolyData
| Line object with sampled data from dataset.
|
| Examples
| --------
| Sample over a plane that is interpolating a point cloud.
|
| >>> import pyvista as pv
| >>> import numpy as np
| >>> rng = np.random.default_rng(12)
| >>> point_cloud = rng.random((5, 3))
| >>> point_cloud[:, 2] = 0
| >>> point_cloud -= point_cloud.mean(0)
| >>> pdata = pv.PolyData(point_cloud)
| >>> pdata['values'] = rng.random(5)
| >>> plane = pv.Plane()
| >>> plane.clear_data()
| >>> plane = plane.interpolate(pdata, sharpness=3.5)
| >>> sample = plane.sample_over_line((-0.5, -0.5, 0), (0.5, 0.5, 0))
| >>> pl = pv.Plotter()
| >>> _ = pl.add_mesh(pdata, render_points_as_spheres=True, point_size=50)
| >>> _ = pl.add_mesh(sample, scalars='values', line_width=10)
| >>> _ = pl.add_mesh(plane, scalars='values', style='wireframe')
| >>> pl.show()
|
| sample_over_multiple_lines(self: '_DataSetType', points: 'MatrixLike[float]', tolerance: 'float | None' = None, progress_bar: 'bool' = False)
| Sample a dataset onto a multiple lines.
|
| Parameters
| ----------
| points : array_like[float]
| List of points defining multiple lines.
|
| tolerance : float, optional
| Tolerance used to compute whether a point in the source is in a
| cell of the input. If not given, tolerance is automatically generated.
|
| progress_bar : bool, default: False
| Display a progress bar to indicate progress.
|
| Returns
| -------
| pyvista.PolyData
| Line object with sampled data from dataset.
|
| Examples
| --------
| Sample over a plane that is interpolating a point cloud.
|
| >>> import pyvista as pv
| >>> import numpy as np
| >>> rng = np.random.default_rng(12)
| >>> point_cloud = rng.random((5, 3))
| >>> point_cloud[:, 2] = 0
| >>> point_cloud -= point_cloud.mean(0)
| >>> pdata = pv.PolyData(point_cloud)
| >>> pdata['values'] = rng.random(5)
| >>> plane = pv.Plane()
| >>> plane.clear_data()
| >>> plane = plane.interpolate(pdata, sharpness=3.5)
| >>> sample = plane.sample_over_multiple_lines(
| ... [
| ... [-0.5, -0.5, 0],
| ... [0.5, -0.5, 0],
| ... [0.5, 0.5, 0],
| ... ]
| ... )
| >>> pl = pv.Plotter()
| >>> _ = pl.add_mesh(pdata, render_points_as_spheres=True, point_size=50)
| >>> _ = pl.add_mesh(sample, scalars='values', line_width=10)
| >>> _ = pl.add_mesh(plane, scalars='values', style='wireframe')
| >>> pl.show()
|
| select_enclosed_points(self: '_DataSetType', surface: 'PolyData', tolerance: 'float' = 0.001, inside_out: 'bool' = False, check_surface: 'bool' = True, progress_bar: 'bool' = False)
| Mark points as to whether they are inside a closed surface.
|
| This evaluates all the input points to determine whether they are in an
| enclosed surface. The filter produces a (0,1) mask
| (in the form of a :vtk:`vtkDataArray`) that indicates whether points are
| outside (mask value=0) or inside (mask value=1) a provided surface.
| (The name of the output :vtk:`vtkDataArray` is ``"SelectedPoints"``.)
|
| This filter produces and output data array, but does not modify the
| input dataset. If you wish to extract cells or poinrs, various
| threshold filters are available (i.e., threshold the output array).
|
| .. warning::
| The filter assumes that the surface is closed and
| manifold. A boolean flag can be set to force the filter to
| first check whether this is true. If ``False`` and not manifold,
| an error will be raised.
|
| Parameters
| ----------
| surface : pyvista.PolyData
| Set the surface to be used to test for containment. This must be a
| :class:`pyvista.PolyData` object.
|
| tolerance : float, default: 0.001
| The tolerance on the intersection. The tolerance is expressed as a
| fraction of the bounding box of the enclosing surface.
|
| inside_out : bool, default: False
| By default, points inside the surface are marked inside or sent
| to the output. If ``inside_out`` is ``True``, then the points
| outside the surface are marked inside.
|
| check_surface : bool, default: True
| Specify whether to check the surface for closure. When ``True``, the
| algorithm first checks to see if the surface is closed and
| manifold. If the surface is not closed and manifold, a runtime
| error is raised.
|
| progress_bar : bool, default: False
| Display a progress bar to indicate progress.
|
| Returns
| -------
| pyvista.PolyData
| Mesh containing the ``point_data['SelectedPoints']`` array.
|
| See Also
| --------
| :ref:`extract_cells_inside_surface_example`
|
| Examples
| --------
| Determine which points on a plane are inside a manifold sphere
| surface mesh. Extract these points using the
| :func:`DataSetFilters.extract_points` filter and then plot them.
|
| >>> import pyvista as pv
| >>> sphere = pv.Sphere()
| >>> plane = pv.Plane()
| >>> selected = plane.select_enclosed_points(sphere)
| >>> pts = plane.extract_points(
| ... selected['SelectedPoints'].view(bool),
| ... adjacent_cells=False,
| ... )
| >>> pl = pv.Plotter()
| >>> _ = pl.add_mesh(sphere, style='wireframe')
| >>> _ = pl.add_points(pts, color='r')
| >>> pl.show()
|
| separate_cells(self: '_DataSetType')
| Return a copy of the dataset with separated cells with no shared points.
|
| This method may be useful when datasets have scalars that need to be
| associated to each point of each cell rather than either each cell or
| just the points of the dataset.
|
| Returns
| -------
| pyvista.UnstructuredGrid
| UnstructuredGrid with isolated cells.
|
| Examples
| --------
| Load the example hex beam and separate its cells. This increases the
| total number of points in the dataset since points are no longer
| shared.
|
| >>> from pyvista import examples
| >>> grid = examples.load_hexbeam()
| >>> grid.n_points
| 99
| >>> sep_grid = grid.separate_cells()
| >>> sep_grid.n_points
| 320
|
| See the :ref:`point_cell_scalars_example` for a more detailed example
| using this filter.
|
| shrink(self: '_DataSetType', shrink_factor: 'float' = 1.0, progress_bar: 'bool' = False)
| Shrink the individual faces of a mesh.
|
| This filter shrinks the individual faces of a mesh rather than
| scaling the entire mesh.
|
| Parameters
| ----------
| shrink_factor : float, default: 1.0
| Fraction of shrink for each cell. Default does not modify the
| faces.
|
| progress_bar : bool, default: False
| Display a progress bar to indicate progress.
|
| Returns
| -------
| pyvista.DataSet
| Dataset with shrunk faces. Return type matches input.
|
| Examples
| --------
| First, plot the original cube.
|
| >>> import pyvista as pv
| >>> mesh = pv.Cube()
| >>> mesh.plot(show_edges=True, line_width=5)
|
| Now, plot the mesh with shrunk faces.
|
| >>> shrunk = mesh.shrink(0.5)
| >>> shrunk.clear_data() # cleans up plot
| >>> shrunk.plot(show_edges=True, line_width=5)
|
| sort_labels(self: '_DataSetType', scalars: 'str | None' = None, preference: "Literal['point', 'cell']" = 'point', output_scalars: 'str | None' = None, progress_bar: 'bool' = False, inplace: 'bool' = False)
| Sort labeled data by number of points or cells.
|
| This filter renumbers scalar label data of any type with ``N`` labels
| such that the output labels are contiguous from ``[0, N)`` and
| sorted in descending order from largest to smallest (by label count).
| I.e., the largest label will have a value of ``0`` and the smallest
| label will have a value of ``N-1``.
|
| The filter is a convenience method for :func:`pyvista.DataSetFilters.pack_labels`
| with ``sort=True``.
|
| Parameters
| ----------
| scalars : str, optional
| Name of scalars to sort. Defaults to currently active scalars.
|
| preference : str, default: "point"
| When ``scalars`` is specified, this is the preferred array
| type to search for in the dataset. Must be either
| ``'point'`` or ``'cell'``.
|
| output_scalars : str, None
| Name of the sorted output scalars. By default, the output is
| saved to ``'packed_labels'``.
|
| progress_bar : bool, default: False
| If ``True``, display a progress bar. Has no effect if VTK
| version is lower than 9.3.
|
| inplace : bool, default: False
| If ``True``, the mesh is updated in-place.
|
| Returns
| -------
| pyvista.DataSet
| Dataset with sorted labels.
|
| Examples
| --------
| Sort segmented image labels.
|
| Load image labels
|
| >>> from pyvista import examples
| >>> import numpy as np
| >>> image_labels = examples.load_frog_tissues()
|
| Show label info for first four labels
|
| >>> label_number, label_size = np.unique(
| ... image_labels['MetaImage'], return_counts=True
| ... )
| >>> label_number[:4]
| pyvista_ndarray([0, 1, 2, 3], dtype=uint8)
| >>> label_size[:4]
| array([30805713, 35279, 19172, 38129])
|
| Sort labels
|
| >>> sorted_labels = image_labels.sort_labels()
|
| Show sorted label info for the four largest labels. Note
| the difference in label size after sorting.
|
| >>> sorted_label_number, sorted_label_size = np.unique(
| ... sorted_labels['packed_labels'], return_counts=True
| ... )
| >>> sorted_label_number[:4]
| pyvista_ndarray([0, 1, 2, 3], dtype=uint8)
| >>> sorted_label_size[:4]
| array([30805713, 438052, 204672, 133880])
|
| split_bodies(self: '_DataSetType', label: 'bool' = False, progress_bar: 'bool' = False)
| Find, label, and split connected bodies/volumes.
|
| This splits different connected bodies into blocks in a
| :class:`pyvista.MultiBlock` dataset.
|
| Parameters
| ----------
| label : bool, default: False
| A flag on whether to keep the ID arrays given by the
| ``connectivity`` filter.
|
| progress_bar : bool, default: False
| Display a progress bar to indicate progress.
|
| See Also
| --------
| extract_values, partition, connectivity
|
| Returns
| -------
| pyvista.MultiBlock
| MultiBlock with a split bodies.
|
| Examples
| --------
| Split a uniform grid thresholded to be non-connected.
|
| >>> from pyvista import examples
| >>> dataset = examples.load_uniform()
| >>> _ = dataset.set_active_scalars('Spatial Cell Data')
| >>> threshed = dataset.threshold_percent([0.15, 0.50], invert=True)
| >>> bodies = threshed.split_bodies()
| >>> len(bodies)
| 2
|
| See :ref:`split_vol` for more examples using this filter.
|
| split_values(self: '_DataSetType', values: 'None | (float | VectorLike[float] | MatrixLike[float] | dict[str, float] | dict[float, str])' = None, *, ranges: 'None | (VectorLike[float] | MatrixLike[float] | dict[str, VectorLike[float]] | dict[tuple[float, float], str])' = None, scalars: 'str | None' = None, preference: "Literal['point', 'cell']" = 'point', component_mode: "Literal['any', 'all', 'multi'] | int" = 'all', **kwargs)
| Split mesh into separate sub-meshes using point or cell data.
|
| By default, this filter generates a separate mesh for each unique value in the
| data array and combines them as blocks in a :class:`~pyvista.MultiBlock`
| dataset. Optionally, specific values and/or ranges of values may be specified to
| control which values to split from the input.
|
| This filter is a convenience method for :meth:`~pyvista.DataSetFilters.extract_values`
| with ``split`` set to ``True`` by default. Refer to that filter's documentation
| for more details.
|
| .. versionadded:: 0.44
|
| Parameters
| ----------
| values : float | ArrayLike[float] | dict, optional
| Value(s) to extract. Can be a number, an iterable of numbers, or a dictionary
| with numeric entries. For ``dict`` inputs, either its keys or values may be
| numeric, and the other field must be strings. The numeric field is used as
| the input for this parameter, and if ``split`` is ``True``, the string field
| is used to set the block names of the returned :class:`~pyvista.MultiBlock`.
|
| .. note::
| When extracting multi-component values with ``component_mode=multi``,
| each value is specified as a multi-component scalar. In this case,
| ``values`` can be a single vector or an array of row vectors.
|
| ranges : array_like | dict, optional
| Range(s) of values to extract. Can be a single range (i.e. a sequence of
| two numbers in the form ``[lower, upper]``), a sequence of ranges, or a
| dictionary with range entries. Any combination of ``values`` and ``ranges``
| may be specified together. The endpoints of the ranges are included in the
| extraction. Ranges cannot be set when ``component_mode=multi``.
|
| For ``dict`` inputs, either its keys or values may be numeric, and the other
| field must be strings. The numeric field is used as the input for this
| parameter, and if ``split`` is ``True``, the string field is used to set the
| block names of the returned :class:`~pyvista.MultiBlock`.
|
| .. note::
| Use ``+/-`` infinity to specify an unlimited bound, e.g.:
|
| - ``[0, float('inf')]`` to extract values greater than or equal to zero.
| - ``[float('-inf'), 0]`` to extract values less than or equal to zero.
|
| scalars : str, optional
| Name of scalars to extract with. Defaults to currently active scalars.
|
| preference : str, default: 'point'
| When ``scalars`` is specified, this is the preferred array type to search
| for in the dataset. Must be either ``'point'`` or ``'cell'``.
|
| component_mode : int | 'any' | 'all' | 'multi', default: 'all'
| Specify the component(s) to use when ``scalars`` is a multi-component array.
| Has no effect when the scalars have a single component. Must be one of:
|
| - number: specify the component number as a 0-indexed integer. The selected
| component must have the specified value(s).
| - ``'any'``: any single component can have the specified value(s).
| - ``'all'``: all individual components must have the specified values(s).
| - ``'multi'``: the entire multi-component item must have the specified value.
|
| **kwargs : dict, optional
| Additional keyword arguments passed to :meth:`~pyvista.DataSetFilters.extract_values`.
|
| See Also
| --------
| extract_values, split_bodies, partition
|
| Returns
| -------
| pyvista.MultiBlock
| Composite of split meshes with :class:`pyvista.UnstructuredGrid` blocks.
|
| Examples
| --------
| Load image with labeled regions.
|
| >>> import numpy as np
| >>> import pyvista as pv
| >>> from pyvista import examples
| >>> image = examples.load_channels()
| >>> np.unique(image.active_scalars)
| pyvista_ndarray([0, 1, 2, 3, 4])
|
| Split the image into its separate regions. Here, we also remove the first
| region for visualization.
|
| >>> multiblock = image.split_values()
| >>> _ = multiblock.pop(0) # Remove first region
|
| Plot the regions.
|
| >>> plot = pv.Plotter()
| >>> _ = plot.add_composite(multiblock, multi_colors=True)
| >>> _ = plot.show_grid()
| >>> plot.show()
|
| Note that the block names are generic by default.
|
| >>> multiblock.keys()
| ['Block-01', 'Block-02', 'Block-03', 'Block-04']
|
| To name the output blocks, use a dictionary as input instead.
|
| Here, we also explicitly omit the region with ``0`` values from the input
| instead of removing it from the output.
|
| >>> labels = dict(region1=1, region2=2, region3=3, region4=4)
| >>>
| >>> multiblock = image.split_values(labels)
| >>> multiblock.keys()
| ['region1', 'region2', 'region3', 'region4']
|
| Plot the regions as separate meshes using the labels instead of plotting
| the MultiBlock directly.
|
| Clear scalar data so we can color each mesh using a single color
|
| >>> _ = [block.clear_data() for block in multiblock]
| >>>
| >>> plot = pv.Plotter()
| >>> plot.set_color_cycler('default')
| >>> _ = [
| ... plot.add_mesh(block, label=label)
| ... for block, label in zip(multiblock, labels)
| ... ]
| >>> _ = plot.add_legend()
| >>> plot.show()
|
| streamlines(self: '_DataSetType', vectors: 'str | None' = None, source_center: 'VectorLike[float] | None' = None, source_radius: 'float | None' = None, n_points: 'int' = 100, start_position: 'VectorLike[float] | None' = None, return_source: 'bool' = False, pointa: 'VectorLike[float] | None' = None, pointb: 'VectorLike[float] | None' = None, progress_bar: 'bool' = False, **kwargs)
| Integrate a vector field to generate streamlines.
|
| The default behavior uses a sphere as the source - set its
| location and radius via the ``source_center`` and
| ``source_radius`` keyword arguments. ``n_points`` defines the
| number of starting points on the sphere surface.
| Alternatively, a line source can be used by specifying
| ``pointa`` and ``pointb``. ``n_points`` again defines the
| number of points on the line.
|
| You can retrieve the source by specifying
| ``return_source=True``.
|
| Optional keyword parameters from
| :func:`pyvista.DataSetFilters.streamlines_from_source` can be
| used here to control the generation of streamlines.
|
| Parameters
| ----------
| vectors : str, optional
| The string name of the active vector field to integrate across.
|
| source_center : sequence[float], optional
| Length 3 tuple of floats defining the center of the source
| particles. Defaults to the center of the dataset.
|
| source_radius : float, optional
| Float radius of the source particle cloud. Defaults to one-tenth of
| the diagonal of the dataset's spatial extent.
|
| n_points : int, default: 100
| Number of particles present in source sphere or line.
|
| start_position : sequence[float], optional
| A single point. This will override the sphere point source.
|
| return_source : bool, default: False
| Return the source particles as :class:`pyvista.PolyData` as well as the
| streamlines. This will be the second value returned if ``True``.
|
| pointa, pointb : sequence[float], optional
| The coordinates of a start and end point for a line source. This
| will override the sphere and start_position point source.
|
| progress_bar : bool, default: False
| Display a progress bar to indicate progress.
|
| **kwargs : dict, optional
| See :func:`pyvista.DataSetFilters.streamlines_from_source`.
|
| Returns
| -------
| streamlines : pyvista.PolyData
| This produces polylines as the output, with each cell
| (i.e., polyline) representing a streamline. The attribute values
| associated with each streamline are stored in the cell data, whereas
| those associated with streamline-points are stored in the point data.
|
| source : pyvista.PolyData
| The points of the source are the seed points for the streamlines.
| Only returned if ``return_source=True``.
|
| Examples
| --------
| See the :ref:`streamlines_example` example.
|
| streamlines_evenly_spaced_2D(self: '_DataSetType', vectors: 'str | None' = None, start_position: 'VectorLike[float] | None' = None, integrator_type: 'Literal[2, 4]' = 2, step_length: 'float' = 0.5, step_unit: "Literal['cl', 'l']" = 'cl', max_steps: 'int' = 2000, terminal_speed: 'float' = 1e-12, interpolator_type: "Literal['point', 'cell', 'p', 'c']" = 'point', separating_distance: 'float' = 10.0, separating_distance_ratio: 'float' = 0.5, closed_loop_maximum_distance: 'float' = 0.5, loop_angle: 'float' = 20.0, minimum_number_of_loop_points: 'int' = 4, compute_vorticity: 'bool' = True, progress_bar: 'bool' = False)
| Generate evenly spaced streamlines on a 2D dataset.
|
| This filter only supports datasets that lie on the xy plane, i.e. ``z=0``.
| Particular care must be used to choose a `separating_distance`
| that do not result in too much memory being utilized. The
| default unit is cell length.
|
| Parameters
| ----------
| vectors : str, optional
| The string name of the active vector field to integrate across.
|
| start_position : sequence[float], optional
| The seed point for generating evenly spaced streamlines.
| If not supplied, a random position in the dataset is chosen.
|
| integrator_type : {2, 4}, default: 2
| The integrator type to be used for streamline generation.
| The default is Runge-Kutta2. The recognized solvers are:
| RUNGE_KUTTA2 (``2``) and RUNGE_KUTTA4 (``4``).
|
| step_length : float, default: 0.5
| Constant Step size used for line integration, expressed in length
| units or cell length units (see ``step_unit`` parameter).
|
| step_unit : {'cl', 'l'}, default: "cl"
| Uniform integration step unit. The valid unit is now limited to
| only LENGTH_UNIT (``'l'``) and CELL_LENGTH_UNIT (``'cl'``).
| Default is CELL_LENGTH_UNIT.
|
| max_steps : int, default: 2000
| Maximum number of steps for integrating a streamline.
|
| terminal_speed : float, default: 1e-12
| Terminal speed value, below which integration is terminated.
|
| interpolator_type : str, optional
| Set the type of the velocity field interpolator to locate cells
| during streamline integration either by points or cells.
| The cell locator is more robust then the point locator. Options
| are ``'point'`` or ``'cell'`` (abbreviations of ``'p'`` and ``'c'``
| are also supported).
|
| separating_distance : float, default: 10
| The distance between streamlines expressed in ``step_unit``.
|
| separating_distance_ratio : float, default: 0.5
| Streamline integration is stopped if streamlines are closer than
| ``SeparatingDistance*SeparatingDistanceRatio`` to other streamlines.
|
| closed_loop_maximum_distance : float, default: 0.5
| The distance between points on a streamline to determine a
| closed loop.
|
| loop_angle : float, default: 20
| The maximum angle in degrees between points to determine a closed loop.
|
| minimum_number_of_loop_points : int, default: 4
| The minimum number of points before which a closed loop will
| be determined.
|
| compute_vorticity : bool, default: True
| Vorticity computation at streamline points. Necessary for generating
| proper stream-ribbons using the :vtk:`vtkRibbonFilter`.
|
| progress_bar : bool, default: False
| Display a progress bar to indicate progress.
|
| Returns
| -------
| pyvista.PolyData
| This produces polylines as the output, with each cell
| (i.e., polyline) representing a streamline. The attribute
| values associated with each streamline are stored in the
| cell data, whereas those associated with streamline-points
| are stored in the point data.
|
| Examples
| --------
| Plot evenly spaced streamlines for cylinder in a crossflow.
| This dataset is a multiblock dataset, and the fluid velocity is in the
| first block.
|
| >>> import pyvista as pv
| >>> from pyvista import examples
| >>> mesh = examples.download_cylinder_crossflow()
| >>> streams = mesh[0].streamlines_evenly_spaced_2D(
| ... start_position=(4, 0.1, 0.0),
| ... separating_distance=3,
| ... separating_distance_ratio=0.2,
| ... )
| >>> plotter = pv.Plotter()
| >>> _ = plotter.add_mesh(streams.tube(radius=0.02), scalars='vorticity_mag')
| >>> plotter.view_xy()
| >>> plotter.show()
|
| See :ref:`streamlines_2D_example` for more examples using this filter.
|
| streamlines_from_source(self: '_DataSetType', source: '_vtk.vtkDataSet', vectors: 'str | None' = None, integrator_type: 'Literal[45, 2, 4]' = 45, integration_direction: "Literal['both', 'backward', 'forward']" = 'both', surface_streamlines: 'bool' = False, initial_step_length: 'float' = 0.5, step_unit: "Literal['cl', 'l']" = 'cl', min_step_length: 'float' = 0.01, max_step_length: 'float' = 1.0, max_steps: 'int' = 2000, terminal_speed: 'float' = 1e-12, max_error: 'float' = 1e-06, max_time: 'float | None' = None, compute_vorticity: 'bool' = True, rotation_scale: 'float' = 1.0, interpolator_type: "Literal['point', 'cell', 'p', 'c']" = 'point', progress_bar: 'bool' = False, max_length: 'float | None' = None)
| Generate streamlines of vectors from the points of a source mesh.
|
| The integration is performed using a specified integrator, by default
| Runge-Kutta45. This supports integration through any type of dataset.
| If the dataset contains 2D cells like polygons or triangles and the
| ``surface_streamlines`` parameter is used, the integration is constrained
| to lie on the surface defined by 2D cells.
|
| Parameters
| ----------
| source : pyvista.DataSet
| The points of the source provide the starting points of the
| streamlines. This will override both sphere and line sources.
|
| vectors : str, optional
| The string name of the active vector field to integrate across.
|
| integrator_type : {45, 2, 4}, default: 45
| The integrator type to be used for streamline generation.
| The default is Runge-Kutta45. The recognized solvers are:
| RUNGE_KUTTA2 (``2``), RUNGE_KUTTA4 (``4``), and RUNGE_KUTTA45
| (``45``). Options are ``2``, ``4``, or ``45``.
|
| integration_direction : str, default: "both"
| Specify whether the streamline is integrated in the upstream or
| downstream directions (or both). Options are ``'both'``,
| ``'backward'``, or ``'forward'``.
|
| surface_streamlines : bool, default: False
| Compute streamlines on a surface.
|
| initial_step_length : float, default: 0.5
| Initial step size used for line integration, expressed ib length
| unitsL or cell length units (see ``step_unit`` parameter).
| either the starting size for an adaptive integrator, e.g., RK45, or
| the constant / fixed size for non-adaptive ones, i.e., RK2 and RK4).
|
| step_unit : {'cl', 'l'}, default: "cl"
| Uniform integration step unit. The valid unit is now limited to
| only LENGTH_UNIT (``'l'``) and CELL_LENGTH_UNIT (``'cl'``).
| Default is CELL_LENGTH_UNIT.
|
| min_step_length : float, default: 0.01
| Minimum step size used for line integration, expressed in length or
| cell length units. Only valid for an adaptive integrator, e.g., RK45.
|
| max_step_length : float, default: 1.0
| Maximum step size used for line integration, expressed in length or
| cell length units. Only valid for an adaptive integrator, e.g., RK45.
|
| max_steps : int, default: 2000
| Maximum number of steps for integrating a streamline.
|
| terminal_speed : float, default: 1e-12
| Terminal speed value, below which integration is terminated.
|
| max_error : float, 1e-6
| Maximum error tolerated throughout streamline integration.
|
| max_time : float, optional
| Specify the maximum length of a streamline expressed in physical length.
|
| .. deprecated:: 0.45.0
| ``max_time`` parameter is deprecated. Use ``max_length`` instead.
| It will be removed in v0.48. Default for ``max_time`` changed in v0.45.0.
|
| compute_vorticity : bool, default: True
| Vorticity computation at streamline points. Necessary for generating
| proper stream-ribbons using the :vtk:`vtkRibbonFilter`.
|
| rotation_scale : float, default: 1.0
| This can be used to scale the rate with which the streamribbons
| twist.
|
| interpolator_type : str, default: "point"
| Set the type of the velocity field interpolator to locate cells
| during streamline integration either by points or cells.
| The cell locator is more robust then the point locator. Options
| are ``'point'`` or ``'cell'`` (abbreviations of ``'p'`` and ``'c'``
| are also supported).
|
| progress_bar : bool, default: False
| Display a progress bar to indicate progress.
|
| max_length : float, optional
| Specify the maximum length of a streamline expressed in physical length.
| Default is 4 times the diagonal length of the bounding box of the ``source``
| dataset.
|
| Returns
| -------
| pyvista.PolyData
| Streamlines. This produces polylines as the output, with
| each cell (i.e., polyline) representing a streamline. The
| attribute values associated with each streamline are
| stored in the cell data, whereas those associated with
| streamline-points are stored in the point data.
|
| Examples
| --------
| See the :ref:`streamlines_example` example.
|
| surface_indices(self: '_DataSetType', progress_bar: 'bool' = False)
| Return the surface indices of a grid.
|
| Parameters
| ----------
| progress_bar : bool, default: False
| Display a progress bar to indicate progress.
|
| Returns
| -------
| numpy.ndarray
| Indices of the surface points.
|
| Examples
| --------
| Return the first 10 surface indices of an UnstructuredGrid.
|
| >>> from pyvista import examples
| >>> grid = examples.load_hexbeam()
| >>> ind = grid.surface_indices()
| >>> ind[:10] # doctest:+SKIP
| pyvista_ndarray([ 0, 2, 36, 27, 7, 8, 81, 1, 18, 4])
|
| tessellate(self: '_DataSetType', max_n_subdivide: 'int' = 3, merge_points: 'bool' = True, progress_bar: 'bool' = False)
| Tessellate a mesh.
|
| This filter approximates nonlinear FEM-like elements with linear
| simplices. The output mesh will have geometry and any fields specified
| as attributes in the input mesh's point data. The attribute's copy
| flags are honored, except for normals.
|
| For more details see :vtk:`vtkTessellatorFilter`.
|
| Parameters
| ----------
| max_n_subdivide : int, default: 3
| Maximum number of subdivisions.
|
| merge_points : bool, default: True
| The adaptive tessellation will output vertices that are not shared among cells,
| even where they should be. This can be corrected to some extent.
|
| progress_bar : bool, default: False
| Display a progress bar to indicate progress.
|
| Returns
| -------
| pyvista.DataSet
| Dataset with tessellated mesh. Return type matches input.
|
| Examples
| --------
| First, plot the high order FEM-like elements.
|
| >>> import pyvista as pv
| >>> import numpy as np
| >>> points = np.array(
| ... [
| ... [0.0, 0.0, 0.0],
| ... [2.0, 0.0, 0.0],
| ... [1.0, 2.0, 0.0],
| ... [1.0, 0.5, 0.0],
| ... [1.5, 1.5, 0.0],
| ... [0.5, 1.5, 0.0],
| ... ]
| ... )
| >>> cells = np.array([6, 0, 1, 2, 3, 4, 5])
| >>> cell_types = np.array([69])
| >>> mesh = pv.UnstructuredGrid(cells, cell_types, points)
| >>> mesh.plot(show_edges=True, line_width=5)
|
| Now, plot the tessellated mesh.
|
| >>> tessellated = mesh.tessellate()
| >>> tessellated.clear_data() # cleans up plot
| >>> tessellated.plot(show_edges=True, line_width=5)
|
| texture_map_to_plane(self: '_DataSetType', origin: 'VectorLike[float] | None' = None, point_u: 'VectorLike[float] | None' = None, point_v: 'VectorLike[float] | None' = None, inplace: 'bool' = False, name: 'str' = 'Texture Coordinates', use_bounds: 'bool' = False, progress_bar: 'bool' = False)
| Texture map this dataset to a user defined plane.
|
| This is often used to define a plane to texture map an image
| to this dataset. The plane defines the spatial reference and
| extent of that image.
|
| Parameters
| ----------
| origin : sequence[float], optional
| Length 3 iterable of floats defining the XYZ coordinates of the
| bottom left corner of the plane.
|
| point_u : sequence[float], optional
| Length 3 iterable of floats defining the XYZ coordinates of the
| bottom right corner of the plane.
|
| point_v : sequence[float], optional
| Length 3 iterable of floats defining the XYZ coordinates of the
| top left corner of the plane.
|
| inplace : bool, default: False
| If ``True``, the new texture coordinates will be added to this
| dataset. If ``False``, a new dataset is returned with the texture
| coordinates.
|
| name : str, default: "Texture Coordinates"
| The string name to give the new texture coordinates if applying
| the filter inplace.
|
| use_bounds : bool, default: False
| Use the bounds to set the mapping plane by default (bottom plane
| of the bounding box).
|
| progress_bar : bool, default: False
| Display a progress bar to indicate progress.
|
| Returns
| -------
| pyvista.DataSet
| Original dataset with texture coordinates if
| ``inplace=True``, otherwise a copied dataset.
|
| Examples
| --------
| See :ref:`topo_map_example`
|
| texture_map_to_sphere(self: '_DataSetType', center: 'VectorLike[float] | None' = None, prevent_seam: 'bool' = True, inplace: 'bool' = False, name: 'str' = 'Texture Coordinates', progress_bar: 'bool' = False)
| Texture map this dataset to a user defined sphere.
|
| This is often used to define a sphere to texture map an image
| to this dataset. The sphere defines the spatial reference and
| extent of that image.
|
| Parameters
| ----------
| center : sequence[float], optional
| Length 3 iterable of floats defining the XYZ coordinates of the
| center of the sphere. If ``None``, this will be automatically
| calculated.
|
| prevent_seam : bool, default: True
| Control how the texture coordinates are generated. If
| set, the s-coordinate ranges from 0 to 1 and 1 to 0
| corresponding to the theta angle variation between 0 to
| 180 and 180 to 0 degrees. Otherwise, the s-coordinate
| ranges from 0 to 1 between 0 to 360 degrees.
|
| inplace : bool, default: False
| If ``True``, the new texture coordinates will be added to
| the dataset inplace. If ``False`` (default), a new dataset
| is returned with the texture coordinates.
|
| name : str, default: "Texture Coordinates"
| The string name to give the new texture coordinates if applying
| the filter inplace.
|
| progress_bar : bool, default: False
| Display a progress bar to indicate progress.
|
| Returns
| -------
| pyvista.DataSet
| Dataset containing the texture mapped to a sphere. Return
| type matches input.
|
| Examples
| --------
| See :ref:`texture_example`.
|
| threshold(self: '_DataSetType', value: 'float | VectorLike[float] | None' = None, scalars: 'str | None' = None, invert: 'bool' = False, continuous: 'bool' = False, preference: "Literal['point', 'cell']" = 'cell', all_scalars: 'bool' = False, component_mode: "Literal['component', 'all', 'any']" = 'all', component: 'int' = 0, method: "Literal['upper', 'lower']" = 'upper', progress_bar: 'bool' = False)
| Apply a :vtk:`vtkThreshold` filter to the input dataset.
|
| This filter will apply a :vtk:`vtkThreshold` filter to the input
| dataset and return the resulting object. This extracts cells
| where the scalar value in each cell satisfies the threshold
| criterion. If ``scalars`` is ``None``, the input's active
| scalars array is used.
|
| .. warning::
| Thresholding is inherently a cell operation, even though it can use
| associated point data for determining whether to keep a cell. In
| other words, whether or not a given point is included after
| thresholding depends on whether that point is part of a cell that
| is kept after thresholding.
|
| Please also note the default ``preference`` choice for CELL data
| over POINT data. This is contrary to most other places in PyVista's
| API where the preference typically defaults to POINT data. We chose
| to prefer CELL data here so that if thresholding by a named array
| that exists for both the POINT and CELL data, this filter will
| default to the CELL data array while performing the CELL-wise
| operation.
|
| Parameters
| ----------
| value : float | sequence[float], optional
| Single value or ``(min, max)`` to be used for the data threshold. If
| a sequence, then length must be 2. If no value is specified, the
| non-NaN data range will be used to remove any NaN values.
| Please reference the ``method`` parameter for how single values
| are handled.
|
| scalars : str, optional
| Name of scalars to threshold on. Defaults to currently active scalars.
|
| invert : bool, default: False
| Invert the threshold results. That is, cells that would have been
| in the output with this option off are excluded, while cells that
| would have been excluded from the output are included.
|
| continuous : bool, default: False
| When True, the continuous interval [minimum cell scalar,
| maximum cell scalar] will be used to intersect the threshold bound,
| rather than the set of discrete scalar values from the vertices.
|
| preference : str, default: 'cell'
| When ``scalars`` is specified, this is the preferred array
| type to search for in the dataset. Must be either
| ``'point'`` or ``'cell'``. Throughout PyVista, the preference
| is typically ``'point'`` but since the threshold filter is a
| cell-wise operation, we prefer cell data for thresholding
| operations.
|
| all_scalars : bool, default: False
| If using scalars from point data, all
| points in a cell must satisfy the threshold when this
| value is ``True``. When ``False``, any point of the cell
| with a scalar value satisfying the threshold criterion
| will extract the cell. Has no effect when using cell data.
|
| component_mode : {'component', 'all', 'any'}
| The method to satisfy the criteria for the threshold of
| multicomponent scalars. 'component' (default)
| uses only the ``component``. 'all' requires all
| components to meet criteria. 'any' is when
| any component satisfies the criteria.
|
| component : int, default: 0
| When using ``component_mode='component'``, this sets
| which component to threshold on.
|
| method : str, default: 'upper'
| Set the threshold method for single-values, defining which
| threshold bounds to use. If the ``value`` is a range, this
| parameter will be ignored, extracting data between the two
| values. For single values, ``'lower'`` will extract data
| lower than the ``value``. ``'upper'`` will extract data
| larger than the ``value``.
|
| progress_bar : bool, default: False
| Display a progress bar to indicate progress.
|
| See Also
| --------
| threshold_percent
| Threshold a dataset by a percentage of its scalar range.
| :meth:`~pyvista.DataSetFilters.extract_values`
| Threshold-like filter for extracting specific values and ranges.
| :meth:`~pyvista.ImageDataFilters.image_threshold`
| Similar method for thresholding :class:`~pyvista.ImageData`.
| :meth:`~pyvista.ImageDataFilters.select_values`
| Threshold-like filter for ``ImageData`` to keep some values and replace others.
|
| Returns
| -------
| pyvista.UnstructuredGrid
| Dataset containing geometry that meets the threshold requirements.
|
| Examples
| --------
| >>> import pyvista as pv
| >>> import numpy as np
| >>> volume = np.zeros([10, 10, 10])
| >>> volume[:3] = 1
| >>> vol = pv.wrap(volume)
| >>> threshed = vol.threshold(0.1)
| >>> threshed
| UnstructuredGrid (...)
| N Cells: 243
| N Points: 400
| X Bounds: 0.000e+00, 3.000e+00
| Y Bounds: 0.000e+00, 9.000e+00
| Z Bounds: 0.000e+00, 9.000e+00
| N Arrays: 1
|
| Apply the threshold filter to Perlin noise. First generate
| the structured grid.
|
| >>> import pyvista as pv
| >>> noise = pv.perlin_noise(0.1, (1, 1, 1), (0, 0, 0))
| >>> grid = pv.sample_function(
| ... noise, bounds=[0, 1.0, -0, 1.0, 0, 1.0], dim=(20, 20, 20)
| ... )
| >>> grid.plot(
| ... cmap='gist_earth_r',
| ... show_scalar_bar=True,
| ... show_edges=False,
| ... )
|
| Next, apply the threshold.
|
| >>> import pyvista as pv
| >>> noise = pv.perlin_noise(0.1, (1, 1, 1), (0, 0, 0))
| >>> grid = pv.sample_function(
| ... noise, bounds=[0, 1.0, -0, 1.0, 0, 1.0], dim=(20, 20, 20)
| ... )
| >>> threshed = grid.threshold(value=0.02)
| >>> threshed.plot(
| ... cmap='gist_earth_r',
| ... show_scalar_bar=False,
| ... show_edges=True,
| ... )
|
| See :ref:`using_filters_example` and :ref:`image_representations_example`
| for more examples using this filter.
|
| threshold_percent(self: '_DataSetType', percent: 'float' = 0.5, scalars: 'str | None' = None, invert: 'bool' = False, continuous: 'bool' = False, preference: "Literal['point', 'cell']" = 'cell', method: "Literal['upper', 'lower']" = 'upper', progress_bar: 'bool' = False)
| Threshold the dataset by a percentage of its range on the active scalars array.
|
| .. warning::
| Thresholding is inherently a cell operation, even though it can use
| associated point data for determining whether to keep a cell. In
| other words, whether or not a given point is included after
| thresholding depends on whether that point is part of a cell that
| is kept after thresholding.
|
| Parameters
| ----------
| percent : float | sequence[float], optional
| The percentage in the range ``(0, 1)`` to threshold. If value is
| out of 0 to 1 range, then it will be divided by 100 and checked to
| be in that range.
|
| scalars : str, optional
| Name of scalars to threshold on. Defaults to currently active scalars.
|
| invert : bool, default: False
| Invert the threshold results. That is, cells that would have been
| in the output with this option off are excluded, while cells that
| would have been excluded from the output are included.
|
| continuous : bool, default: False
| When True, the continuous interval [minimum cell scalar,
| maximum cell scalar] will be used to intersect the threshold bound,
| rather than the set of discrete scalar values from the vertices.
|
| preference : str, default: 'cell'
| When ``scalars`` is specified, this is the preferred array
| type to search for in the dataset. Must be either
| ``'point'`` or ``'cell'``. Throughout PyVista, the preference
| is typically ``'point'`` but since the threshold filter is a
| cell-wise operation, we prefer cell data for thresholding
| operations.
|
| method : str, default: 'upper'
| Set the threshold method for single-values, defining which
| threshold bounds to use. If the ``value`` is a range, this
| parameter will be ignored, extracting data between the two
| values. For single values, ``'lower'`` will extract data
| lower than the ``value``. ``'upper'`` will extract data
| larger than the ``value``.
|
| progress_bar : bool, default: False
| Display a progress bar to indicate progress.
|
| Returns
| -------
| pyvista.UnstructuredGrid
| Dataset containing geometry that meets the threshold requirements.
|
| See Also
| --------
| threshold
| Threshold a dataset by value.
|
| Examples
| --------
| Apply a 50% threshold filter.
|
| >>> import pyvista as pv
| >>> noise = pv.perlin_noise(0.1, (2, 2, 2), (0, 0, 0))
| >>> grid = pv.sample_function(
| ... noise, bounds=[0, 1.0, -0, 1.0, 0, 1.0], dim=(30, 30, 30)
| ... )
| >>> threshed = grid.threshold_percent(0.5)
| >>> threshed.plot(
| ... cmap='gist_earth_r',
| ... show_scalar_bar=False,
| ... show_edges=True,
| ... )
|
| Apply a 80% threshold filter.
|
| >>> threshed = grid.threshold_percent(0.8)
| >>> threshed.plot(
| ... cmap='gist_earth_r',
| ... show_scalar_bar=False,
| ... show_edges=True,
| ... )
|
| See :ref:`using_filters_example` for more examples using a similar filter.
|
| voxelize(self: 'DataSet', *, reference_volume: 'ImageData | None' = None, dimensions: 'VectorLike[int] | None' = None, spacing: 'float | VectorLike[float] | None' = None, rounding_func: 'Callable[[VectorLike[float]], VectorLike[int]] | None' = None, cell_length_percentile: 'float | None' = None, cell_length_sample_size: 'int | None' = None, progress_bar: 'bool' = False) -> 'UnstructuredGrid'
| Voxelize mesh to UnstructuredGrid.
|
| The voxelization can be controlled in several ways:
|
| #. Specify the output geometry using a ``reference_volume``.
|
| #. Specify the ``spacing`` explicitly.
|
| #. Specify the ``dimensions`` explicitly.
|
| #. Specify the ``cell_length_percentile``. The spacing is estimated from the
| surface's cells using the specified percentile.
|
| Use ``reference_volume`` for full control of the output geometry. For
| all other options, the geometry is implicitly defined such that the generated
| mesh fits the bounds of the input mesh.
|
| If no inputs are provided, ``cell_length_percentile=0.1`` (10th percentile) is
| used by default to estimate the spacing. On systems with VTK < 9.2, the default
| spacing is set to ``1/100`` of the input mesh's length.
|
| .. versionadded:: 0.46
|
| .. note::
|
| This method is a wrapper around :meth:`voxelize_binary_mask`. See that
| method for additional information.
|
| Parameters
| ----------
| reference_volume : ImageData, optional
| Volume to use as a reference. The output will have the same ``dimensions``,
| and ``spacing`` as the reference.
|
| dimensions : VectorLike[int], optional
| Dimensions of the voxelized mesh. Set this value to control the
| dimensions explicitly. If unset, the dimensions are defined implicitly
| through other parameter. See summary and examples for details.
|
| .. note::
|
| Dimensions is the number of points along each axis, not cells. Set
| dimensions to ``N+1`` instead for ``N`` cells along each axis.
|
| spacing : float | VectorLike[float], optional
| Approximate spacing to use for the generated mesh. Set this value
| to control the spacing explicitly. If unset, the spacing is defined
| implicitly through other parameters. See summary and examples for details.
|
| rounding_func : Callable[VectorLike[float], VectorLike[int]], optional
| Control how the dimensions are rounded to integers based on the provided or
| calculated ``spacing``. Should accept a length-3 vector containing the
| dimension values along the three directions and return a length-3 vector.
| :func:`numpy.round` is used by default.
|
| Rounding the dimensions implies rounding the actual spacing.
|
| Has no effect if ``dimensions`` is specified.
|
| cell_length_percentile : float, optional
| Cell length percentage ``p`` to use for computing the default ``spacing``.
| Default is ``0.1`` (10th percentile) and must be between ``0`` and ``1``.
| The ``p``-th percentile is computed from the cumulative distribution function
| (CDF) of lengths which are representative of the cell length scales present
| in the input. The CDF is computed by:
|
| #. Triangulating the input cells.
| #. Sampling a subset of up to ``cell_length_sample_size`` cells.
| #. Computing the distance between two random points in each cell.
| #. Inserting the distance into an ordered set to create the CDF.
|
| Has no effect if ``dimensions`` is specified.
|
| .. note::
| This option is only available for VTK 9.2 or greater.
|
| cell_length_sample_size : int, optional
| Number of samples to use for the cumulative distribution function (CDF)
| when using the ``cell_length_percentile`` option. ``100 000`` samples are
| used by default.
|
| progress_bar : bool, default: False
| Display a progress bar to indicate progress.
|
| Returns
| -------
| UnstructuredGrid
| Voxelized unstructured grid of the original mesh.
|
| See Also
| --------
| voxelize_rectilinear
| Similar function that returns a :class:`~pyvista.RectilinearGrid` with cell data.
|
| voxelize_binary_mask
| Similar function that returns a :class:`~pyvista.ImageData` with point data.
|
| Examples
| --------
| Create a voxelized mesh with uniform spacing.
|
| >>> import numpy as np
| >>> import pyvista as pv
| >>> from pyvista import examples
| >>> mesh = examples.download_bunny_coarse()
| >>> vox = mesh.voxelize(spacing=0.01)
| >>> vox.plot(show_edges=True)
|
| Create a voxelized mesh using non-uniform spacing.
|
| >>> vox = mesh.voxelize(spacing=(0.01, 0.005, 0.002))
| >>> vox.plot(show_edges=True)
|
| The bounds of the voxelized mesh always match the bounds of the input.
|
| >>> mesh.bounds
| BoundsTuple(x_min = -0.13155962526798248,
| x_max = 0.18016336858272552,
| y_min = -0.12048563361167908,
| y_max = 0.18769524991512299,
| z_min = -0.14300920069217682,
| z_max = 0.09850578755140305)
|
| >>> vox.bounds
| BoundsTuple(x_min = -0.13155962526798248,
| x_max = 0.18016336858272552,
| y_min = -0.12048563361167908,
| y_max = 0.18769524991512299,
| z_min = -0.14300920069217682,
| z_max = 0.09650979936122894)
|
| Create a voxelized mesh with ``3 x 4 x 5`` cells. Since ``dimensions`` is the
| number of points, not cells, we need to add ``1`` to get the number of desired cells.
|
| >>> mesh = pv.Box()
| >>> cell_dimensions = np.array((3, 4, 5))
| >>> vox = mesh.voxelize(dimensions=cell_dimensions + 1)
| >>> vox.plot(show_edges=True)
|
| voxelize_binary_mask(self: 'DataSet', *, background_value: 'int | float' = 0, foreground_value: 'int | float' = 1, reference_volume: 'pyvista.ImageData | None' = None, dimensions: 'VectorLike[int] | None' = None, spacing: 'float | VectorLike[float] | None' = None, rounding_func: 'Callable[[VectorLike[float]], VectorLike[int]] | None' = None, cell_length_percentile: 'float | None' = None, cell_length_sample_size: 'int | None' = None, progress_bar: 'bool' = False)
| Voxelize mesh as a binary :class:`~pyvista.ImageData` mask.
|
| The binary mask is a point data array where points inside and outside of the
| input surface are labelled with ``foreground_value`` and ``background_value``,
| respectively.
|
| This filter implements :vtk:`vtkPolyDataToImageStencil`. This
| algorithm operates as follows:
|
| * The algorithm iterates through the z-slice of the ``reference_volume``.
| * For each slice, it cuts the input :class:`~pyvista.PolyData` surface to create
| 2D polylines at that z position. It attempts to close any open polylines.
| * For each x position along the polylines, the corresponding y positions are
| determined.
| * For each slice, the grid points are labelled as foreground or background based
| on their xy coordinates.
|
| The voxelization can be controlled in several ways:
|
| #. Specify the output geometry using a ``reference_volume``.
|
| #. Specify the ``spacing`` explicitly.
|
| #. Specify the ``dimensions`` explicitly.
|
| #. Specify the ``cell_length_percentile``. The spacing is estimated from the
| surface's cells using the specified percentile.
|
| Use ``reference_volume`` for full control of the output mask's geometry. For
| all other options, the geometry is implicitly defined such that the generated
| mask fits the bounds of the input surface.
|
| If no inputs are provided, ``cell_length_percentile=0.1`` (10th percentile) is
| used by default to estimate the spacing. On systems with VTK < 9.2, the default
| spacing is set to ``1/100`` of the input mesh's length.
|
| .. versionadded:: 0.45.0
|
| .. note::
| For best results, ensure the input surface is a closed surface. The
| surface is considered closed if it has zero :attr:`~pyvista.PolyData.n_open_edges`.
|
| .. note::
| This filter returns voxels represented as point data, not
| :attr:`~pyvista.CellType.VOXEL` cells.
| This differs from :func:`~pyvista.voxelize` and :func:`~pyvista.voxelize_volume`
| which return meshes with voxel cells. See :ref:`image_representations_example`
| for examples demonstrating the difference.
|
| .. note::
| This filter does not discard internal surfaces, due, for instance, to
| intersecting meshes. Instead, the intersection will be considered as
| background which may produce unexpected results. See `Examples`.
|
| Parameters
| ----------
| background_value : int, default: 0
| Background value of the generated mask.
|
| foreground_value : int, default: 1
| Foreground value of the generated mask.
|
| reference_volume : ImageData, optional
| Volume to use as a reference. The output will have the same ``dimensions``,
| ``origin``, ``spacing``, and ``direction_matrix`` as the reference.
|
| dimensions : VectorLike[int], optional
| Dimensions of the generated mask image. Set this value to control the
| dimensions explicitly. If unset, the dimensions are defined implicitly
| through other parameter. See summary and examples for details.
|
| spacing : float | VectorLike[float], optional
| Approximate spacing to use for the generated mask image. Set this value
| to control the spacing explicitly. If unset, the spacing is defined
| implicitly through other parameters. See summary and examples for details.
|
| rounding_func : Callable[VectorLike[float], VectorLike[int]], optional
| Control how the dimensions are rounded to integers based on the provided or
| calculated ``spacing``. Should accept a length-3 vector containing the
| dimension values along the three directions and return a length-3 vector.
| :func:`numpy.round` is used by default.
|
| Rounding the dimensions implies rounding the actual spacing.
|
| Has no effect if ``reference_volume`` or ``dimensions`` are specified.
|
| cell_length_percentile : float, optional
| Cell length percentage ``p`` to use for computing the default ``spacing``.
| Default is ``0.1`` (10th percentile) and must be between ``0`` and ``1``.
| The ``p``-th percentile is computed from the cumulative distribution function
| (CDF) of lengths which are representative of the cell length scales present
| in the input. The CDF is computed by:
|
| #. Triangulating the input cells.
| #. Sampling a subset of up to ``cell_length_sample_size`` cells.
| #. Computing the distance between two random points in each cell.
| #. Inserting the distance into an ordered set to create the CDF.
|
| Has no effect if ``dimensions`` or ``reference_volume`` are specified.
|
| .. note::
| This option is only available for VTK 9.2 or greater.
|
| cell_length_sample_size : int, optional
| Number of samples to use for the cumulative distribution function (CDF)
| when using the ``cell_length_percentile`` option. ``100 000`` samples are
| used by default.
|
| progress_bar : bool, default: False
| Display a progress bar to indicate progress.
|
| Returns
| -------
| ImageData
| Generated binary mask with a ``'mask'`` point data array. The data array
| has dtype :class:`numpy.uint8` if the foreground and background values are
| unsigned and less than 256.
|
| See Also
| --------
| voxelize
| Similar function that returns a :class:`~pyvista.UnstructuredGrid` of
| :attr:`~pyvista.CellType.VOXEL` cells.
|
| voxelize_rectilinear
| Similar function that returns a :class:`~pyvista.RectilinearGrid` with cell data.
|
| pyvista.ImageDataFilters.contour_labels
| Filter that generates surface contours from labeled image data. Can be
| loosely considered as an inverse of this filter.
|
| pyvista.ImageDataFilters.points_to_cells
| Convert voxels represented as points to :attr:`~pyvista.CellType.VOXEL`
| cells.
|
| ImageData
| Class used to build custom ``reference_volume``.
|
| Examples
| --------
| Generate a binary mask from a coarse mesh.
|
| >>> import numpy as np
| >>> import pyvista as pv
| >>> from pyvista import examples
| >>> poly = examples.download_bunny_coarse()
| >>> mask = poly.voxelize_binary_mask()
|
| The mask is stored as :class:`~pyvista.ImageData` with point data scalars
| (zeros for background, ones for foreground).
|
| >>> mask
| ImageData (...)
| N Cells: 7056
| N Points: 8228
| X Bounds: -1.245e-01, 1.731e-01
| Y Bounds: -1.135e-01, 1.807e-01
| Z Bounds: -1.359e-01, 9.140e-02
| Dimensions: 22, 22, 17
| Spacing: 1.417e-02, 1.401e-02, 1.421e-02
| N Arrays: 1
|
| >>> np.unique(mask.point_data['mask'])
| pyvista_ndarray([0, 1], dtype=uint8)
|
| To visualize it as voxel cells, use :meth:`~pyvista.ImageDataFilters.points_to_cells`,
| then use :meth:`~pyvista.DataSetFilters.threshold` to extract the foreground.
|
| We also plot the voxel cells in blue and the input poly data in green for
| comparison.
|
| >>> def mask_and_polydata_plotter(mask, poly):
| ... voxel_cells = mask.points_to_cells().threshold(0.5)
| ...
| ... plot = pv.Plotter()
| ... _ = plot.add_mesh(voxel_cells, color='blue')
| ... _ = plot.add_mesh(poly, color='lime')
| ... plot.camera_position = 'xy'
| ... return plot
|
| >>> plot = mask_and_polydata_plotter(mask, poly)
| >>> plot.show()
|
| The spacing of the mask image is automatically adjusted to match the
| density of the input.
|
| Repeat the previous example with a finer mesh.
|
| >>> poly = examples.download_bunny()
| >>> mask = poly.voxelize_binary_mask()
| >>> plot = mask_and_polydata_plotter(mask, poly)
| >>> plot.show()
|
| Control the spacing manually instead. Here, a very coarse spacing is used.
|
| >>> mask = poly.voxelize_binary_mask(spacing=(0.01, 0.04, 0.02))
| >>> plot = mask_and_polydata_plotter(mask, poly)
| >>> plot.show()
|
| Note that the spacing is only approximate. Check the mask's actual spacing.
|
| >>> mask.spacing
| (0.009731187485158443, 0.03858340159058571, 0.020112216472625732)
|
| The actual values may be greater or less than the specified values. Use
| ``rounding_func=np.floor`` to force all values to be greater.
|
| >>> mask = poly.voxelize_binary_mask(
| ... spacing=(0.01, 0.04, 0.02), rounding_func=np.floor
| ... )
| >>> mask.spacing
| (0.01037993331750234, 0.05144453545411428, 0.020112216472625732)
|
| Set the dimensions instead of the spacing.
|
| >>> mask = poly.voxelize_binary_mask(dimensions=(10, 20, 30))
| >>> plot = mask_and_polydata_plotter(mask, poly)
| >>> plot.show()
|
| >>> mask.dimensions
| (10, 20, 30)
|
| Create a mask using a reference volume. First generate polydata from
| an existing mask.
|
| >>> volume = examples.load_frog_tissues()
| >>> poly = volume.contour_labels()
|
| Now create the mask from the polydata using the volume as a reference.
|
| >>> mask = poly.voxelize_binary_mask(reference_volume=volume)
| >>> plot = mask_and_polydata_plotter(mask, poly)
| >>> plot.show()
|
| Visualize the effect of internal surfaces.
|
| >>> mesh = pv.Cylinder() + pv.Cylinder(center=(0, 0.75, 0))
| >>> binary_mask = mesh.voxelize_binary_mask(
| ... dimensions=(1, 100, 50)
| ... ).points_to_cells()
| >>> plot = pv.Plotter()
| >>> _ = plot.add_mesh(binary_mask)
| >>> _ = plot.add_mesh(mesh.slice(), color='red')
| >>> plot.show(cpos='yz')
|
| Note how the intersection is excluded from the mask.
| To include the voxels delimited by internal surfaces in the foreground, the internal
| surfaces should be removed, for instance by applying a boolean union. Note that
| this operation in unreliable in VTK but may be performed with external tools such
| as `vtkbool <https://github.com/zippy84/vtkbool>`_.
|
| Alternatively, the intersecting parts of the mesh can be processed sequentially.
|
| >>> cylinder_1 = pv.Cylinder()
| >>> cylinder_2 = pv.Cylinder(center=(0, 0.75, 0))
|
| >>> reference_volume = pv.ImageData(
| ... dimensions=(1, 100, 50),
| ... spacing=(1, 0.0175, 0.02),
| ... origin=(0, -0.5 + 0.0175 / 2, -0.5 + 0.02 / 2),
| ... )
|
| >>> binary_mask_1 = cylinder_1.voxelize_binary_mask(
| ... reference_volume=reference_volume
| ... ).points_to_cells()
| >>> binary_mask_2 = cylinder_2.voxelize_binary_mask(
| ... reference_volume=reference_volume
| ... ).points_to_cells()
|
| >>> binary_mask_1['mask'] = binary_mask_1['mask'] | binary_mask_2['mask']
|
| >>> plot = pv.Plotter()
| >>> _ = plot.add_mesh(binary_mask_1)
| >>> _ = plot.add_mesh(cylinder_1.slice(), color='red')
| >>> _ = plot.add_mesh(cylinder_2.slice(), color='red')
| >>> plot.show(cpos='yz')
|
| When multiple internal surfaces are nested, they are successively treated as
| interfaces between background and foreground.
|
| >>> mesh = pv.Tube(radius=2) + pv.Tube(radius=3) + pv.Tube(radius=4)
| >>> binary_mask = mesh.voxelize_binary_mask(
| ... dimensions=(1, 50, 50)
| ... ).points_to_cells()
| >>> plot = pv.Plotter()
| >>> _ = plot.add_mesh(binary_mask)
| >>> _ = plot.add_mesh(mesh.slice(), color='red')
| >>> plot.show(cpos='yz')
|
| voxelize_rectilinear(self: 'DataSet', *, background_value: 'int | float' = 0, foreground_value: 'int | float' = 1, reference_volume: 'ImageData | None' = None, dimensions: 'VectorLike[int] | None' = None, spacing: 'float | VectorLike[float] | None' = None, rounding_func: 'Callable[[VectorLike[float]], VectorLike[int]] | None' = None, cell_length_percentile: 'float | None' = None, cell_length_sample_size: 'int | None' = None, progress_bar: 'bool' = False) -> 'RectilinearGrid'
| Voxelize mesh to create a RectilinearGrid voxel volume.
|
| The voxelization can be controlled in several ways:
|
| #. Specify the output geometry using a ``reference_volume``.
|
| #. Specify the ``spacing`` explicitly.
|
| #. Specify the ``dimensions`` explicitly.
|
| #. Specify the ``cell_length_percentile``. The spacing is estimated from the
| surface's cells using the specified percentile.
|
| Use ``reference_volume`` for full control of the output grid's geometry. For
| all other options, the geometry is implicitly defined such that the generated
| grid fits the bounds of the input mesh.
|
| If no inputs are provided, ``cell_length_percentile=0.1`` (10th percentile) is
| used by default to estimate the spacing. On systems with VTK < 9.2, the default
| spacing is set to ``1/100`` of the input mesh's length.
|
| A point data array ``mask`` is included where points inside and outside of the
| input surface are labelled with ``foreground_value`` and ``background_value``,
| respectively.
|
| .. versionadded:: 0.46
|
| .. note::
|
| This method is a wrapper around :meth:`voxelize_binary_mask`. See that
| method for additional information.
|
| Parameters
| ----------
| background_value : int, default: 0
| Background value of the generated grid.
|
| foreground_value : int, default: 1
| Foreground value of the generated grid.
|
| reference_volume : ImageData, optional
| Volume to use as a reference. The output will have the same ``dimensions``,
| ``origin``, and ``spacing`` as the reference.
|
| dimensions : VectorLike[int], optional
| Dimensions of the generated rectilinear grid. Set this value to control the
| dimensions explicitly. If unset, the dimensions are defined implicitly
| through other parameter. See summary and examples for details.
|
| .. note::
|
| Dimensions is the number of points along each axis, not cells. Set
| dimensions to ``N+1`` instead for ``N`` cells along each axis.
|
| spacing : float | VectorLike[float], optional
| Approximate spacing to use for the generated grid. Set this value
| to control the spacing explicitly. If unset, the spacing is defined
| implicitly through other parameters. See summary and examples for details.
|
| rounding_func : Callable[VectorLike[float], VectorLike[int]], optional
| Control how the dimensions are rounded to integers based on the provided or
| calculated ``spacing``. Should accept a length-3 vector containing the
| dimension values along the three directions and return a length-3 vector.
| :func:`numpy.round` is used by default.
|
| Rounding the dimensions implies rounding the actual spacing.
|
| Has no effect if ``reference_volume`` or ``dimensions`` are specified.
|
| cell_length_percentile : float, optional
| Cell length percentage ``p`` to use for computing the default ``spacing``.
| Default is ``0.1`` (10th percentile) and must be between ``0`` and ``1``.
| The ``p``-th percentile is computed from the cumulative distribution function
| (CDF) of lengths which are representative of the cell length scales present
| in the input. The CDF is computed by:
|
| #. Triangulating the input cells.
| #. Sampling a subset of up to ``cell_length_sample_size`` cells.
| #. Computing the distance between two random points in each cell.
| #. Inserting the distance into an ordered set to create the CDF.
|
| Has no effect if ``dimensions`` or ``reference_volume`` are specified.
|
| .. note::
| This option is only available for VTK 9.2 or greater.
|
| cell_length_sample_size : int, optional
| Number of samples to use for the cumulative distribution function (CDF)
| when using the ``cell_length_percentile`` option. ``100 000`` samples are
| used by default.
|
| progress_bar : bool, default: False
| Display a progress bar to indicate progress.
|
| Returns
| -------
| RectilinearGrid
| RectilinearGrid as voxelized volume with discretized cells.
|
| See Also
| --------
| voxelize
| Similar function that returns a :class:`~pyvista.UnstructuredGrid` of
| :attr:`~pyvista.CellType.VOXEL` cells.
|
| voxelize_binary_mask
| Similar function that returns a :class:`~pyvista.ImageData` with point data.
|
| Examples
| --------
| Create a voxel volume of a nut. By default, the spacing is automatically
| estimated.
|
| >>> import pyvista as pv
| >>> from pyvista import examples
| >>> mesh = pv.examples.load_nut()
| >>> vox = mesh.voxelize_rectilinear()
|
| Plot the mesh together with its volume.
|
| >>> pl = pv.Plotter()
| >>> _ = pl.add_mesh(mesh=vox, show_edges=True)
| >>> _ = pl.add_mesh(mesh=mesh, show_edges=True, opacity=1)
| >>> pl.show()
|
| Load a mesh of a cow.
|
| >>> mesh = examples.download_cow()
|
| Create an equal density voxel volume and plot the result.
|
| >>> vox = mesh.voxelize_rectilinear(spacing=0.15)
| >>> cpos = [(15, 3, 15), (0, 0, 0), (0, 0, 0)]
| >>> vox.plot(scalars='mask', show_edges=True, cpos=cpos)
|
| Slice the voxel volume to view the ``mask`` scalars.
|
| >>> slices = vox.slice_orthogonal()
| >>> slices.plot(scalars='mask', show_edges=True)
|
| Create a voxel volume from unequal density dimensions and plot result.
|
| >>> vox = mesh.voxelize_rectilinear(spacing=(0.15, 0.15, 0.5))
| >>> vox.plot(scalars='mask', show_edges=True, cpos=cpos)
|
| Slice the unequal density voxel volume to view the ``mask`` scalars.
|
| >>> slices = vox.slice_orthogonal()
| >>> slices.plot(scalars='mask', show_edges=True, cpos=cpos)
|
| warp_by_scalar(self: '_DataSetType', scalars: 'str | None' = None, factor: 'float' = 1.0, normal: 'VectorLike[float] | None' = None, inplace: 'bool' = False, progress_bar: 'bool' = False, **kwargs)
| Warp the dataset's points by a point data scalars array's values.
|
| This modifies point coordinates by moving points along point
| normals by the scalar amount times the scale factor.
|
| Parameters
| ----------
| scalars : str, optional
| Name of scalars to warp by. Defaults to currently active scalars.
|
| factor : float, default: 1.0
| A scaling factor to increase the scaling effect. Alias
| ``scale_factor`` also accepted - if present, overrides ``factor``.
|
| normal : sequence, optional
| User specified normal. If given, data normals will be
| ignored and the given normal will be used to project the
| warp.
|
| inplace : bool, default: False
| If ``True``, the points of the given dataset will be updated.
|
| progress_bar : bool, default: False
| Display a progress bar to indicate progress.
|
| **kwargs : dict, optional
| Accepts ``scale_factor`` instead of ``factor``.
|
| Returns
| -------
| pyvista.DataSet
| Warped Dataset. Return type matches input.
|
| Examples
| --------
| First, plot the unwarped mesh.
|
| >>> from pyvista import examples
| >>> mesh = examples.download_st_helens()
| >>> mesh.plot(cmap='gist_earth', show_scalar_bar=False)
|
| Now, warp the mesh by the ``'Elevation'`` scalars.
|
| >>> warped = mesh.warp_by_scalar('Elevation')
| >>> warped.plot(cmap='gist_earth', show_scalar_bar=False)
|
| See :ref:`compute_normals_example` for more examples using this filter.
|
| warp_by_vector(self: '_DataSetType', vectors: 'str | None' = None, factor: 'float' = 1.0, inplace: 'bool' = False, progress_bar: 'bool' = False)
| Warp the dataset's points by a point data vectors array's values.
|
| This modifies point coordinates by moving points along point
| vectors by the local vector times the scale factor.
|
| A classical application of this transform is to visualize
| eigenmodes in mechanics.
|
| Parameters
| ----------
| vectors : str, optional
| Name of vector to warp by. Defaults to currently active vector.
|
| factor : float, default: 1.0
| A scaling factor that multiplies the vectors to warp by. Can
| be used to enhance the warping effect.
|
| inplace : bool, default: False
| If ``True``, the function will update the mesh in-place.
|
| progress_bar : bool, default: False
| Display a progress bar to indicate progress.
|
| Returns
| -------
| pyvista.PolyData
| The warped mesh resulting from the operation.
|
| Examples
| --------
| Warp a sphere by vectors.
|
| >>> import pyvista as pv
| >>> from pyvista import examples
| >>> sphere = examples.load_sphere_vectors()
| >>> warped = sphere.warp_by_vector()
| >>> pl = pv.Plotter(shape=(1, 2))
| >>> pl.subplot(0, 0)
| >>> actor = pl.add_text('Before warp')
| >>> actor = pl.add_mesh(sphere, color='white')
| >>> pl.subplot(0, 1)
| >>> actor = pl.add_text('After warp')
| >>> actor = pl.add_mesh(warped, color='white')
| >>> pl.show()
|
| See :ref:`warp_by_vector_example` and :ref:`warp_by_vector_eigenmodes_example` for
| more examples using this filter.
|
| ----------------------------------------------------------------------
| Readonly properties inherited from pyvista.core.utilities.misc._BoundsSizeMixin:
|
| bounds_size
| Return the size of each axis of the object's bounding box.
|
| .. versionadded:: 0.46
|
| Returns
| -------
| tuple[float, float, float]
| Size of each x-y-z axis.
|
| Examples
| --------
| Get the size of a cube. The cube has edge lengths af ``(1.0, 1.0, 1.0)``
| by default.
|
| >>> import pyvista as pv
| >>> mesh = pv.Cube()
| >>> mesh.bounds_size
| (1.0, 1.0, 1.0)
|
| ----------------------------------------------------------------------
| Data descriptors inherited from pyvista.core.utilities.misc._BoundsSizeMixin:
|
| __dict__
| dictionary for instance variables
|
| __weakref__
| list of weak references to the object
|
| ----------------------------------------------------------------------
| Methods inherited from pyvista.core.filters.data_object.DataObjectFilters:
|
| cell_centers(self: '_DataSetOrMultiBlockType', vertex: 'bool' = True, pass_cell_data: 'bool' = True, progress_bar: 'bool' = False)
| Generate points at the center of the cells in this dataset.
|
| These points can be used for placing glyphs or vectors.
|
| Parameters
| ----------
| vertex : bool, default: True
| Enable or disable the generation of vertex cells.
|
| pass_cell_data : bool, default: True
| If enabled, pass the input cell data through to the output.
|
| progress_bar : bool, default: False
| Display a progress bar to indicate progress.
|
| Returns
| -------
| pyvista.PolyData
| Polydata where the points are the cell centers of the
| original dataset.
|
| Examples
| --------
| >>> import pyvista as pv
| >>> mesh = pv.Plane()
| >>> mesh.point_data.clear()
| >>> centers = mesh.cell_centers()
| >>> pl = pv.Plotter()
| >>> actor = pl.add_mesh(mesh, show_edges=True)
| >>> actor = pl.add_points(
| ... centers,
| ... render_points_as_spheres=True,
| ... color='red',
| ... point_size=20,
| ... )
| >>> pl.show()
|
| See :ref:`cell_centers_example` for more examples using this filter.
|
| cell_data_to_point_data(self: '_DataSetOrMultiBlockType', pass_cell_data: 'bool' = False, progress_bar: 'bool' = False)
| Transform cell data into point data.
|
| Point data are specified per node and cell data specified
| within cells. Optionally, the input point data can be passed
| through to the output.
|
| The method of transformation is based on averaging the data
| values of all cells using a particular point. Optionally, the
| input cell data can be passed through to the output as well.
|
| Parameters
| ----------
| pass_cell_data : bool, default: False
| If enabled, pass the input cell data through to the output.
|
| progress_bar : bool, default: False
| Display a progress bar to indicate progress.
|
| Returns
| -------
| DataSet | MultiBlock
| Dataset with the point data transformed into cell data.
| Return type matches input.
|
| See Also
| --------
| point_data_to_cell_data
| Similar transformation applied to point data.
| :meth:`~pyvista.ImageDataFilters.cells_to_points`
| Re-mesh :class:`~pyvista.ImageData` to a points-based representation.
|
| Examples
| --------
| First compute the face area of the example airplane mesh and
| show the cell values. This is to show discrete cell data.
|
| >>> from pyvista import examples
| >>> surf = examples.load_airplane()
| >>> surf = surf.compute_cell_sizes(length=False, volume=False)
| >>> surf.plot(scalars='Area')
|
| These cell scalars can be applied to individual points to
| effectively smooth out the cell data onto the points.
|
| >>> from pyvista import examples
| >>> surf = examples.load_airplane()
| >>> surf = surf.compute_cell_sizes(length=False, volume=False)
| >>> surf = surf.cell_data_to_point_data()
| >>> surf.plot(scalars='Area')
|
| cell_quality(self: '_DataSetOrMultiBlockType', quality_measure: "Literal['all', 'all_valid'] | _CellQualityLiteral | Sequence[_CellQualityLiteral]" = 'scaled_jacobian', *, null_value: 'float' = -1.0, progress_bar: 'bool' = False) -> '_DataSetOrMultiBlockType'
| Compute a function of (geometric) quality for each cell of a mesh.
|
| The per-cell quality is added to the mesh's cell data, in an array with
| the same name as the quality measure. Cell types not supported by this
| filter or undefined quality of supported cell types will have an
| entry of ``-1``.
|
| See the :ref:`cell_quality_measures_table` below for all measures and the
| :class:`~pyvista.CellType` supported by each one.
| Defaults to computing the ``scaled_jacobian`` quality measure.
|
| .. _cell_quality_measures_table:
|
| .. include:: /api/core/cell_quality/cell_quality_measures_table.rst
|
| .. note::
|
| Refer to the `Verdict Library Reference Manual <https://github.com/sandialabs/verdict/raw/master/SAND2007-2853p.pdf>`_
| for low-level technical information about how each metric is computed.
|
| .. versionadded:: 0.45
|
| Parameters
| ----------
| quality_measure : str | sequence[str], default: 'scaled_jacobian'
| The cell quality measure(s) to use. May be either:
|
| - A single measure or a sequence of measures listed in
| :ref:`cell_quality_measures_table`.
| - ``'all'`` to compute all measures.
| - ``'all_valid'`` to only keep quality measures that are valid for the mesh's
| cell type(s).
|
| A separate array is created for each measure.
|
| null_value : float, default: -1.0
| Float value for undefined quality. Undefined quality are qualities
| that could be addressed by this filter but is not well defined for
| the particular geometry of cell in question, e.g. a volume query
| for a triangle. Undefined quality will always be undefined.
| The default value is -1.
|
| progress_bar : bool, default: False
| Display a progress bar to indicate progress.
|
| Returns
| -------
| DataSet | MultiBlock
| Dataset with the computed mesh quality. Return type matches input.
| Cell data array(s) with the computed quality measure(s) are included.
|
| See Also
| --------
| :func:`~pyvista.cell_quality_info`
| Return information about a cell's quality measure, e.g. acceptable range.
|
| Examples
| --------
| Compute and plot the minimum angle of a sample sphere mesh.
|
| >>> import pyvista as pv
| >>> sphere = pv.Sphere(theta_resolution=20, phi_resolution=20)
| >>> cqual = sphere.cell_quality('min_angle')
| >>> cqual.plot(show_edges=True)
|
| Quality measures like ``'volume'`` do not apply to 2D cells, and a null value
| of ``-1`` is returned.
|
| >>> qual = sphere.cell_quality('volume')
| >>> qual.get_data_range('volume')
| (np.float64(-1.0), np.float64(-1.0))
|
| Compute all valid quality measures for the sphere. These measures all return
| non-null values for :attr:`~pyvista.CellType.TRIANGLE` cells.
|
| >>> cqual = sphere.cell_quality('all_valid')
| >>> valid_measures = cqual.cell_data.keys()
| >>> valid_measures # doctest: +NORMALIZE_WHITESPACE
| ['area',
| 'aspect_frobenius',
| 'aspect_ratio',
| 'condition',
| 'distortion',
| 'max_angle',
| 'min_angle',
| 'radius_ratio',
| 'relative_size_squared',
| 'scaled_jacobian',
| 'shape',
| 'shape_and_size']
|
| See :ref:`mesh_quality_example` for more examples using this filter.
|
| clip(self: '_DataSetOrMultiBlockType', normal: 'VectorLike[float] | NormalsLiteral' = 'x', origin: 'VectorLike[float] | None' = None, invert: 'bool' = True, value: 'float' = 0.0, inplace: 'bool' = False, return_clipped: 'bool' = False, progress_bar: 'bool' = False, crinkle: 'bool' = False)
| Clip a dataset by a plane by specifying the origin and normal.
|
| If no parameters are given the clip will occur in the center
| of that dataset.
|
| Parameters
| ----------
| normal : tuple(float) | str, default: 'x'
| Length 3 tuple for the normal vector direction. Can also
| be specified as a string conventional direction such as
| ``'x'`` for ``(1, 0, 0)`` or ``'-x'`` for ``(-1, 0, 0)``, etc.
|
| origin : sequence[float], optional
| The center ``(x, y, z)`` coordinate of the plane on which the clip
| occurs. The default is the center of the dataset.
|
| invert : bool, default: True
| Flag on whether to flip/invert the clip.
|
| value : float, default: 0.0
| Set the clipping value along the normal direction.
|
| inplace : bool, default: False
| Updates mesh in-place.
|
| return_clipped : bool, default: False
| Return both unclipped and clipped parts of the dataset.
|
| progress_bar : bool, default: False
| Display a progress bar to indicate progress.
|
| crinkle : bool, default: False
| Crinkle the clip by extracting the entire cells along the
| clip. This adds the ``"cell_ids"`` array to the ``cell_data``
| attribute that tracks the original cell IDs of the original
| dataset.
|
| Returns
| -------
| pyvista.PolyData | tuple[pyvista.PolyData]
| Clipped mesh when ``return_clipped=False``,
| otherwise a tuple containing the unclipped and clipped datasets.
|
| Examples
| --------
| Clip a cube along the +X direction. ``triangulate`` is used as
| the cube is initially composed of quadrilateral faces and
| subdivide only works on triangles.
|
| >>> import pyvista as pv
| >>> cube = pv.Cube().triangulate().subdivide(3)
| >>> clipped_cube = cube.clip()
| >>> clipped_cube.plot()
|
| Clip a cube in the +Z direction. This leaves half a cube
| below the XY plane.
|
| >>> import pyvista as pv
| >>> cube = pv.Cube().triangulate().subdivide(3)
| >>> clipped_cube = cube.clip('z')
| >>> clipped_cube.plot()
|
| See :ref:`clip_with_surface_example` for more examples using this filter.
|
| clip_box(self: '_DataSetOrMultiBlockType', bounds: 'float | VectorLike[float] | pyvista.PolyData | None' = None, invert: 'bool' = True, factor: 'float' = 0.35, progress_bar: 'bool' = False, merge_points: 'bool' = True, crinkle: 'bool' = False)
| Clip a dataset by a bounding box defined by the bounds.
|
| If no bounds are given, a corner of the dataset bounds will be removed.
|
| Parameters
| ----------
| bounds : sequence[float], optional
| Length 6 sequence of floats: ``(x_min, x_max, y_min, y_max, z_min, z_max)``.
| Length 3 sequence of floats: distances from the min coordinate of
| of the input mesh. Single float value: uniform distance from the
| min coordinate. Length 12 sequence of length 3 sequence of floats:
| a plane collection (normal, center, ...).
| :class:`pyvista.PolyData`: if a poly mesh is passed that represents
| a box with 6 faces that all form a standard box, then planes will
| be extracted from the box to define the clipping region.
|
| invert : bool, default: True
| Flag on whether to flip/invert the clip.
|
| factor : float, default: 0.35
| If bounds are not given this is the factor along each axis to
| extract the default box.
|
| progress_bar : bool, default: False
| Display a progress bar to indicate progress.
|
| merge_points : bool, default: True
| If ``True``, coinciding points of independently defined mesh
| elements will be merged.
|
| crinkle : bool, default: False
| Crinkle the clip by extracting the entire cells along the
| clip. This adds the ``"cell_ids"`` array to the ``cell_data``
| attribute that tracks the original cell IDs of the original
| dataset.
|
| Returns
| -------
| pyvista.UnstructuredGrid
| Clipped dataset.
|
| Examples
| --------
| Clip a corner of a cube. The bounds of a cube are normally
| ``[-0.5, 0.5, -0.5, 0.5, -0.5, 0.5]``, and this removes 1/8 of
| the cube's surface.
|
| >>> import pyvista as pv
| >>> cube = pv.Cube().triangulate().subdivide(3)
| >>> clipped_cube = cube.clip_box([0, 1, 0, 1, 0, 1])
| >>> clipped_cube.plot()
|
| See :ref:`clip_with_plane_box_example` for more examples using this filter.
|
| compute_cell_sizes(self: '_DataSetOrMultiBlockType', length: 'bool' = True, area: 'bool' = True, volume: 'bool' = True, progress_bar: 'bool' = False, vertex_count: 'bool' = False)
| Compute sizes for 0D (vertex count), 1D (length), 2D (area) and 3D (volume) cells.
|
| Parameters
| ----------
| length : bool, default: True
| Specify whether or not to compute the length of 1D cells.
|
| area : bool, default: True
| Specify whether or not to compute the area of 2D cells.
|
| volume : bool, default: True
| Specify whether or not to compute the volume of 3D cells.
|
| progress_bar : bool, default: False
| Display a progress bar to indicate progress.
|
| vertex_count : bool, default: False
| Specify whether or not to compute sizes for vertex and polyvertex cells (0D cells).
| The computed value is the number of points in the cell.
|
| Returns
| -------
| DataSet | MultiBlock
| Dataset with `cell_data` containing the ``"VertexCount"``,
| ``"Length"``, ``"Area"``, and ``"Volume"`` arrays if set
| in the parameters. Return type matches input.
|
| Notes
| -----
| If cells do not have a dimension (for example, the length of
| hexahedral cells), the corresponding array will be all zeros.
|
| Examples
| --------
| Compute the face area of the example airplane mesh.
|
| >>> from pyvista import examples
| >>> surf = examples.load_airplane()
| >>> surf = surf.compute_cell_sizes(length=False, volume=False)
| >>> surf.plot(show_edges=True, scalars='Area')
|
| ctp(self: '_DataSetOrMultiBlockType', pass_cell_data: 'bool' = False, progress_bar: 'bool' = False, **kwargs)
| Transform cell data into point data.
|
| Point data are specified per node and cell data specified
| within cells. Optionally, the input point data can be passed
| through to the output.
|
| This method is an alias for :func:`cell_data_to_point_data`.
|
| Parameters
| ----------
| pass_cell_data : bool, default: False
| If enabled, pass the input cell data through to the output.
|
| progress_bar : bool, default: False
| Display a progress bar to indicate progress.
|
| **kwargs : dict, optional
| Deprecated keyword argument ``pass_cell_arrays``.
|
| Returns
| -------
| DataSet | MultiBlock
| Dataset with the cell data transformed into point data.
| Return type matches input.
|
| elevation(self: '_DataSetOrMultiBlockType', low_point: 'VectorLike[float] | None' = None, high_point: 'VectorLike[float] | None' = None, scalar_range: 'str | VectorLike[float] | None' = None, preference: "Literal['point', 'cell']" = 'point', set_active: 'bool' = True, progress_bar: 'bool' = False)
| Generate scalar values on a dataset.
|
| The scalar values lie within a user specified range, and are
| generated by computing a projection of each dataset point onto
| a line. The line can be oriented arbitrarily. A typical
| example is to generate scalars based on elevation or height
| above a plane.
|
| .. warning::
| This will create a scalars array named ``'Elevation'`` on the
| point data of the input dataset and overwrite the array
| named ``'Elevation'`` if present.
|
| Parameters
| ----------
| low_point : sequence[float], optional
| The low point of the projection line in 3D space. Default is bottom
| center of the dataset. Otherwise pass a length 3 sequence.
|
| high_point : sequence[float], optional
| The high point of the projection line in 3D space. Default is top
| center of the dataset. Otherwise pass a length 3 sequence.
|
| scalar_range : str | sequence[float], optional
| The scalar range to project to the low and high points on the line
| that will be mapped to the dataset. If None given, the values will
| be computed from the elevation (Z component) range between the
| high and low points. Min and max of a range can be given as a length
| 2 sequence. If ``str``, name of scalar array present in the
| dataset given, the valid range of that array will be used.
|
| preference : str, default: "point"
| When an array name is specified for ``scalar_range``, this is the
| preferred array type to search for in the dataset.
| Must be either ``'point'`` or ``'cell'``.
|
| set_active : bool, default: True
| A boolean flag on whether or not to set the new
| ``'Elevation'`` scalar as the active scalars array on the
| output dataset.
|
| progress_bar : bool, default: False
| Display a progress bar to indicate progress.
|
| Returns
| -------
| DataSet | MultiBlock
| Dataset containing elevation scalars in the
| ``"Elevation"`` array in ``point_data``.
|
| Examples
| --------
| Generate the "elevation" scalars for a sphere mesh. This is
| simply the height in Z from the XY plane.
|
| >>> import pyvista as pv
| >>> sphere = pv.Sphere()
| >>> sphere_elv = sphere.elevation()
| >>> sphere_elv.plot(smooth_shading=True)
|
| Access the first 4 elevation scalars. This is a point-wise
| array containing the "elevation" of each point.
|
| >>> sphere_elv['Elevation'][:4] # doctest:+SKIP
| array([-0.5 , 0.5 , -0.49706897, -0.48831028], dtype=float32)
|
| See :ref:`using_filters_example` for more examples using this filter.
|
| extract_all_edges(self: '_DataSetOrMultiBlockType', use_all_points: 'bool' = False, clear_data: 'bool' = False, progress_bar: 'bool' = False)
| Extract all the internal/external edges of the dataset as PolyData.
|
| This produces a full wireframe representation of the input dataset.
|
| Parameters
| ----------
| use_all_points : bool, default: False
| Indicates whether all of the points of the input mesh should exist
| in the output. When ``True``, point numbering does not change and
| a threaded approach is used, which avoids the use of a point locator
| and is quicker.
|
| By default this is set to ``False``, and unused points are omitted
| from the output.
|
| This parameter can only be set to ``True`` with ``vtk==9.1.0`` or newer.
|
| clear_data : bool, default: False
| Clear any point, cell, or field data. This is useful
| if wanting to strictly extract the edges.
|
| progress_bar : bool, default: False
| Display a progress bar to indicate progress.
|
| Returns
| -------
| pyvista.PolyData
| Edges extracted from the dataset.
|
| Examples
| --------
| Extract the edges of a sample unstructured grid and plot the edges.
| Note how it plots interior edges.
|
| >>> import pyvista as pv
| >>> from pyvista import examples
| >>> hex_beam = pv.read(examples.hexbeamfile)
| >>> edges = hex_beam.extract_all_edges()
| >>> edges.plot(line_width=5, color='k')
|
| See :ref:`cell_centers_example` for more examples using this filter.
|
| flip_normal(self: '_MeshType_co', normal: 'VectorLike[float]', point: 'VectorLike[float] | None' = None, transform_all_input_vectors: 'bool' = False, inplace: 'bool' = False) -> '_MeshType_co'
| Flip mesh about the normal.
|
| .. note::
| See also the notes at :func:`transform` which is used by this filter
| under the hood.
|
| Parameters
| ----------
| normal : VectorLike[float]
| Normal vector to flip about.
|
| point : VectorLike[float], optional
| Point to rotate about. Defaults to center of mesh at
| :attr:`~pyvista.DataSet.center`.
|
| transform_all_input_vectors : bool, default: False
| When ``True``, all input vectors are
| transformed. Otherwise, only the points, normals and
| active vectors are transformed.
|
| inplace : bool, default: False
| Updates mesh in-place.
|
| Returns
| -------
| DataSet | MultiBlock
| Dataset flipped about its normal. Return type matches input.
|
| See Also
| --------
| pyvista.Transform.reflect
| Concatenate a reflection matrix with a transformation.
|
| Examples
| --------
| >>> import pyvista as pv
| >>> from pyvista import examples
| >>> pl = pv.Plotter(shape=(1, 2))
| >>> pl.subplot(0, 0)
| >>> pl.show_axes()
| >>> mesh1 = examples.download_teapot()
| >>> _ = pl.add_mesh(mesh1)
| >>> pl.subplot(0, 1)
| >>> pl.show_axes()
| >>> mesh2 = mesh1.flip_normal([1.0, 1.0, 1.0], inplace=False)
| >>> _ = pl.add_mesh(mesh2)
| >>> pl.show(cpos='xy')
|
| flip_x(self: '_MeshType_co', point: 'VectorLike[float] | None' = None, transform_all_input_vectors: 'bool' = False, inplace: 'bool' = False) -> '_MeshType_co'
| Flip mesh about the x-axis.
|
| .. note::
| See also the notes at :func:`transform` which is used by this filter
| under the hood.
|
| Parameters
| ----------
| point : sequence[float], optional
| Point to rotate about. Defaults to center of mesh at
| :attr:`~pyvista.DataSet.center`.
|
| transform_all_input_vectors : bool, default: False
| When ``True``, all input vectors are
| transformed. Otherwise, only the points, normals and
| active vectors are transformed.
|
| inplace : bool, default: False
| Updates mesh in-place.
|
| Returns
| -------
| DataSet | MultiBlock
| Flipped dataset. Return type matches input.
|
| See Also
| --------
| pyvista.Transform.flip_x
| Concatenate a reflection about the x-axis with a transformation.
|
| Examples
| --------
| >>> import pyvista as pv
| >>> from pyvista import examples
| >>> pl = pv.Plotter(shape=(1, 2))
| >>> pl.subplot(0, 0)
| >>> pl.show_axes()
| >>> mesh1 = examples.download_teapot()
| >>> _ = pl.add_mesh(mesh1)
| >>> pl.subplot(0, 1)
| >>> pl.show_axes()
| >>> mesh2 = mesh1.flip_x(inplace=False)
| >>> _ = pl.add_mesh(mesh2)
| >>> pl.show(cpos='xy')
|
| flip_y(self: '_MeshType_co', point: 'VectorLike[float] | None' = None, transform_all_input_vectors: 'bool' = False, inplace: 'bool' = False) -> '_MeshType_co'
| Flip mesh about the y-axis.
|
| .. note::
| See also the notes at :func:`transform` which is used by this filter
| under the hood.
|
| Parameters
| ----------
| point : VectorLike[float], optional
| Point to rotate about. Defaults to center of mesh at
| :attr:`~pyvista.DataSet.center`.
|
| transform_all_input_vectors : bool, default: False
| When ``True``, all input vectors are
| transformed. Otherwise, only the points, normals and
| active vectors are transformed.
|
| inplace : bool, default: False
| Updates mesh in-place.
|
| Returns
| -------
| DataSet | MultiBlock
| Flipped dataset. Return type matches input.
|
| See Also
| --------
| pyvista.Transform.flip_y
| Concatenate a reflection about the y-axis with a transformation.
|
| Examples
| --------
| >>> import pyvista as pv
| >>> from pyvista import examples
| >>> pl = pv.Plotter(shape=(1, 2))
| >>> pl.subplot(0, 0)
| >>> pl.show_axes()
| >>> mesh1 = examples.download_teapot()
| >>> _ = pl.add_mesh(mesh1)
| >>> pl.subplot(0, 1)
| >>> pl.show_axes()
| >>> mesh2 = mesh1.flip_y(inplace=False)
| >>> _ = pl.add_mesh(mesh2)
| >>> pl.show(cpos='xy')
|
| flip_z(self: '_MeshType_co', point: 'VectorLike[float] | None' = None, transform_all_input_vectors: 'bool' = False, inplace: 'bool' = False) -> '_MeshType_co'
| Flip mesh about the z-axis.
|
| .. note::
| See also the notes at :func:`transform` which is used by this filter
| under the hood.
|
| Parameters
| ----------
| point : VectorLike[float], optional
| Point to rotate about. Defaults to center of mesh at
| :attr:`~pyvista.DataSet.center`.
|
| transform_all_input_vectors : bool, default: False
| When ``True``, all input vectors are
| transformed. Otherwise, only the points, normals and
| active vectors are transformed.
|
| inplace : bool, default: False
| Updates mesh in-place.
|
| Returns
| -------
| DataSet | MultiBlock
| Flipped dataset. Return type matches input.
|
| See Also
| --------
| pyvista.Transform.flip_z
| Concatenate a reflection about the z-axis with a transformation.
|
| Examples
| --------
| >>> import pyvista as pv
| >>> from pyvista import examples
| >>> pl = pv.Plotter(shape=(1, 2))
| >>> pl.subplot(0, 0)
| >>> pl.show_axes()
| >>> mesh1 = examples.download_teapot().rotate_x(90, inplace=False)
| >>> _ = pl.add_mesh(mesh1)
| >>> pl.subplot(0, 1)
| >>> pl.show_axes()
| >>> mesh2 = mesh1.flip_z(inplace=False)
| >>> _ = pl.add_mesh(mesh2)
| >>> pl.show(cpos='xz')
|
| point_data_to_cell_data(self: '_DataSetOrMultiBlockType', pass_point_data: 'bool' = False, categorical: 'bool' = False, progress_bar: 'bool' = False)
| Transform point data into cell data.
|
| Point data are specified per node and cell data specified within cells.
| Optionally, the input point data can be passed through to the output.
|
| Parameters
| ----------
| pass_point_data : bool, default: False
| If enabled, pass the input point data through to the output.
|
| categorical : bool, default: False
| Control whether the source point data is to be treated as
| categorical. If ``True``, histograming is used to assign the
| cell data. Specifically, a histogram is populated for each cell
| from the scalar values at each point, and the bin with the most
| elements is selected. In case of a tie, the smaller value is selected.
|
| .. note::
|
| If the point data is continuous, values that are almost equal (within
| ``1e-6``) are merged into a single bin. Otherwise, for discrete data
| the number of bins equals the number of unique values.
|
| progress_bar : bool, default: False
| Display a progress bar to indicate progress.
|
| Returns
| -------
| DataSet | MultiBlock
| Dataset with the point data transformed into cell data.
| Return type matches input.
|
| See Also
| --------
| cell_data_to_point_data
| Similar transformation applied to cell data.
| :meth:`~pyvista.ImageDataFilters.points_to_cells`
| Re-mesh :class:`~pyvista.ImageData` to a cells-based representation.
|
| Examples
| --------
| Color cells by their z coordinates. First, create point
| scalars based on z-coordinates of a sample sphere mesh. Then
| convert this point data to cell data. Use a low resolution
| sphere for emphasis of cell valued data.
|
| First, plot these values as point values to show the
| difference between point and cell data.
|
| >>> import pyvista as pv
| >>> sphere = pv.Sphere(theta_resolution=10, phi_resolution=10)
| >>> sphere['Z Coordinates'] = sphere.points[:, 2]
| >>> sphere.plot()
|
| Now, convert these values to cell data and then plot it.
|
| >>> import pyvista as pv
| >>> sphere = pv.Sphere(theta_resolution=10, phi_resolution=10)
| >>> sphere['Z Coordinates'] = sphere.points[:, 2]
| >>> sphere = sphere.point_data_to_cell_data()
| >>> sphere.plot()
|
| ptc(self: '_DataSetOrMultiBlockType', pass_point_data: 'bool' = False, progress_bar: 'bool' = False, **kwargs)
| Transform point data into cell data.
|
| Point data are specified per node and cell data specified
| within cells. Optionally, the input point data can be passed
| through to the output.
|
| This method is an alias for :func:`point_data_to_cell_data`.
|
| Parameters
| ----------
| pass_point_data : bool, default: False
| If enabled, pass the input point data through to the output.
|
| progress_bar : bool, default: False
| Display a progress bar to indicate progress.
|
| **kwargs : dict, optional
| Deprecated keyword argument ``pass_point_arrays``.
|
| Returns
| -------
| DataSet | MultiBlock
| Dataset with the point data transformed into cell data.
| Return type matches input.
|
| reflect(self: '_MeshType_co', normal: 'VectorLike[float]', point: 'VectorLike[float] | None' = None, inplace: 'bool' = False, transform_all_input_vectors: 'bool' = False, progress_bar: 'bool' = False) -> '_MeshType_co'
| Reflect a dataset across a plane.
|
| Parameters
| ----------
| normal : array_like[float]
| Normal direction for reflection.
|
| point : array_like[float]
| Point which, along with ``normal``, defines the reflection
| plane. If not specified, this is the origin.
|
| inplace : bool, default: False
| When ``True``, modifies the dataset inplace.
|
| transform_all_input_vectors : bool, default: False
| When ``True``, all input vectors are transformed. Otherwise,
| only the points, normals and active vectors are transformed.
|
| progress_bar : bool, default: False
| Display a progress bar to indicate progress.
|
| Returns
| -------
| DataSet | MultiBlock
| Reflected dataset. Return type matches input.
|
| See Also
| --------
| pyvista.Transform.reflect
| Concatenate a reflection matrix with a transformation.
|
| Examples
| --------
| >>> from pyvista import examples
| >>> mesh = examples.load_airplane()
| >>> mesh = mesh.reflect((0, 0, 1), point=(0, 0, -100))
| >>> mesh.plot(show_edges=True)
|
| See the :ref:`reflect_example` for more examples using this filter.
|
| resize(self: '_MeshType_co', *, bounds: 'VectorLike[float] | None' = None, bounds_size: 'float | VectorLike[float] | None' = None, center: 'VectorLike[float] | None' = None, transform_all_input_vectors: 'bool' = False, inplace: 'bool' = False) -> '_MeshType_co'
| Resize the dataset's bounds.
|
| This filter rescales and translates the mesh to fit specified bounds. This is useful for
| normalizing datasets, changing units, or fitting datasets into specific coordinate ranges.
|
| Use ``bounds`` to set the mesh's :attr:`~pyvista.DataSet.bounds` directly or use
| ``bounds_size`` and ``center`` to implicitly set the new bounds.
|
| .. versionadded:: 0.46
|
| See Also
| --------
| :meth:`scale`, :meth:`translate`
| Scale and/or translate a mesh. Used internally by :meth:`resize`.
|
| Parameters
| ----------
| bounds : VectorLike[float], optional
| Target :attr:`~pyvista.DataSet.bounds` for the resized dataset in the format
| ``[xmin, xmax, ymin, ymax, zmin, zmax]``. If provided, the dataset is scaled and
| translated to fit exactly within these bounds. Cannot be used together with
| ``bounds_size`` or ``center``.
|
| bounds_size : float | VectorLike[float], optional
| Target size of the :attr:`~pyvista.DataSet.bounds` for the resized dataset. Use a
| single float to specify the size of all three axes, or a 3-element vector to set the
| size of each axis independently. Cannot be used together with ``bounds``.
|
| center : VectorLike[float], optional
| Center of the resized dataset in ``[x, y, z]``. By default, the mesh's
| :attr:`~pyvista.DataSet.center` is used. Only used when ``bounds_size`` is specified.
|
| transform_all_input_vectors : bool, default: False
| When ``True``, all input vectors are transformed as part of the resize. Otherwise, only
| the points, normals and active vectors are transformed.
|
| inplace : bool, default: False
| If True, the dataset is modified in place. If False, a new dataset is returned.
|
| Returns
| -------
| DataSet | MultiBlock
| Resized dataset. Return type matches input.
|
| Examples
| --------
| Load a mesh with asymmetric bounds and show them.
|
| >>> import pyvista as pv
| >>> mesh = pv.Cube(
| ... x_length=1.0, y_length=2.0, z_length=3.0, center=(1.0, 2.0, 3.0)
| ... )
| >>> mesh.bounds
| BoundsTuple(x_min = 0.5,
| x_max = 1.5,
| y_min = 1.0,
| y_max = 3.0,
| z_min = 1.5,
| z_max = 4.5)
|
| Resize it to fit specific bounds.
|
| >>> resized = mesh.resize(bounds=[-1, 2, -3, 4, -5, 6])
| >>> resized.bounds
| BoundsTuple(x_min = -1.0,
| x_max = 2.0,
| y_min = -3.0,
| y_max = 4.0,
| z_min = -5.0,
| z_max = 6.0)
|
| Resize the mesh so its size is ``4.0``.
|
| >>> resized = mesh.resize(bounds_size=4.0)
| >>> resized.bounds_size
| (4.0, 4.0, 4.0)
| >>> resized.bounds
| BoundsTuple(x_min = -1.0,
| x_max = 3.0,
| y_min = 0.0,
| y_max = 4.0,
| z_min = 1.0,
| z_max = 5.0)
|
| Specify a different size for each axis and set the desired center.
|
| >>> resized = mesh.resize(bounds_size=(2.0, 1.0, 0.5), center=(1.0, 0.5, 0.25))
| >>> resized.bounds_size
| (2.0, 1.0, 0.5)
| >>> resized.center
| (1.0, 0.5, 0.25)
|
| Center the mesh at the origin and normalize its bounds to ``1.0``.
|
| >>> resized = mesh.resize(bounds_size=1.0, center=(0.0, 0.0, 0.0))
| >>> resized.bounds
| BoundsTuple(x_min = -0.5,
| x_max = 0.5,
| y_min = -0.5,
| y_max = 0.5,
| z_min = -0.5,
| z_max = 0.5)
|
| rotate(self: '_MeshType_co', rotation: 'RotationLike', point: 'VectorLike[float] | None' = None, transform_all_input_vectors: 'bool' = False, inplace: 'bool' = False) -> '_MeshType_co'
| Rotate mesh about a point with a rotation matrix or ``Rotation`` object.
|
| .. note::
| See also the notes at :func:`transform` which is used by this filter
| under the hood.
|
| Parameters
| ----------
| rotation : RotationLike
| 3x3 rotation matrix or a SciPy ``Rotation`` object.
|
| point : VectorLike[float], optional
| Point to rotate about. Defaults to origin.
|
| transform_all_input_vectors : bool, default: False
| When ``True``, all input vectors are
| transformed. Otherwise, only the points, normals and
| active vectors are transformed.
|
| inplace : bool, default: False
| Updates mesh in-place.
|
| Returns
| -------
| DataSet | MultiBlock
| Rotated dataset. Return type matches input.
|
| See Also
| --------
| pyvista.Transform.rotate
| Concatenate a rotation matrix with a transformation.
|
| Examples
| --------
| Define a rotation. Here, a 3x3 matrix is used which rotates about the z-axis by
| 60 degrees.
|
| >>> import pyvista as pv
| >>> rotation = [
| ... [0.5, -0.8660254, 0.0],
| ... [0.8660254, 0.5, 0.0],
| ... [0.0, 0.0, 1.0],
| ... ]
|
| Use the rotation to rotate a cone about its tip.
|
| >>> mesh = pv.Cone()
| >>> tip = (0.5, 0.0, 0.0)
| >>> rot = mesh.rotate(rotation, point=tip)
|
| Plot the rotated mesh.
|
| >>> pl = pv.Plotter()
| >>> _ = pl.add_mesh(rot)
| >>> _ = pl.add_mesh(mesh, style='wireframe', line_width=3)
| >>> _ = pl.add_axes_at_origin()
| >>> pl.show()
|
| rotate_vector(self: '_MeshType_co', vector: 'VectorLike[float]', angle: 'float', point: 'VectorLike[float] | None' = None, transform_all_input_vectors: 'bool' = False, inplace: 'bool' = False) -> '_MeshType_co'
| Rotate mesh about a vector.
|
| .. note::
| See also the notes at :func:`transform` which is used by this filter
| under the hood.
|
| Parameters
| ----------
| vector : VectorLike[float]
| Vector to rotate about.
|
| angle : float
| Angle to rotate.
|
| point : VectorLike[float], optional
| Point to rotate about. Defaults to origin.
|
| transform_all_input_vectors : bool, default: False
| When ``True``, all input vectors are
| transformed. Otherwise, only the points, normals and
| active vectors are transformed.
|
| inplace : bool, default: False
| Updates mesh in-place.
|
| Returns
| -------
| DataSet | MultiBlock
| Rotated dataset. Return type matches input.
|
| See Also
| --------
| pyvista.Transform.rotate_vector
| Concatenate a rotation about a vector with a transformation.
|
| Examples
| --------
| Rotate a mesh 30 degrees about the ``(1, 1, 1)`` axis.
|
| >>> import pyvista as pv
| >>> mesh = pv.Cube()
| >>> rot = mesh.rotate_vector((1, 1, 1), 30, inplace=False)
|
| Plot the rotated mesh.
|
| >>> pl = pv.Plotter()
| >>> _ = pl.add_mesh(rot)
| >>> _ = pl.add_mesh(mesh, style='wireframe', line_width=3)
| >>> _ = pl.add_axes_at_origin()
| >>> pl.show()
|
| rotate_x(self: '_MeshType_co', angle: 'float', point: 'VectorLike[float] | None' = None, transform_all_input_vectors: 'bool' = False, inplace: 'bool' = False) -> '_MeshType_co'
| Rotate mesh about the x-axis.
|
| .. note::
| See also the notes at :func:`transform` which is used by this filter
| under the hood.
|
| Parameters
| ----------
| angle : float
| Angle in degrees to rotate about the x-axis.
|
| point : VectorLike[float], optional
| Point to rotate about. Defaults to origin.
|
| transform_all_input_vectors : bool, default: False
| When ``True``, all input vectors are
| transformed. Otherwise, only the points, normals and
| active vectors are transformed.
|
| inplace : bool, default: False
| Updates mesh in-place.
|
| Returns
| -------
| DataSet | MultiBlock
| Rotated dataset. Return type matches input.
|
| See Also
| --------
| pyvista.Transform.rotate_x
| Concatenate a rotation about the x-axis with a transformation.
|
| Examples
| --------
| Rotate a mesh 30 degrees about the x-axis.
|
| >>> import pyvista as pv
| >>> mesh = pv.Cube()
| >>> rot = mesh.rotate_x(30, inplace=False)
|
| Plot the rotated mesh.
|
| >>> pl = pv.Plotter()
| >>> _ = pl.add_mesh(rot)
| >>> _ = pl.add_mesh(mesh, style='wireframe', line_width=3)
| >>> _ = pl.add_axes_at_origin()
| >>> pl.show()
|
| rotate_y(self: '_MeshType_co', angle: 'float', point: 'VectorLike[float] | None' = None, transform_all_input_vectors: 'bool' = False, inplace: 'bool' = False) -> '_MeshType_co'
| Rotate mesh about the y-axis.
|
| .. note::
| See also the notes at :func:`transform` which is used by this filter
| under the hood.
|
| Parameters
| ----------
| angle : float
| Angle in degrees to rotate about the y-axis.
|
| point : VectorLike[float], optional
| Point to rotate about.
|
| transform_all_input_vectors : bool, default: False
| When ``True``, all input vectors are transformed. Otherwise, only
| the points, normals and active vectors are transformed.
|
| inplace : bool, default: False
| Updates mesh in-place.
|
| Returns
| -------
| DataSet | MultiBlock
| Rotated dataset. Return type matches input.
|
| See Also
| --------
| pyvista.Transform.rotate_y
| Concatenate a rotation about the y-axis with a transformation.
|
| Examples
| --------
| Rotate a cube 30 degrees about the y-axis.
|
| >>> import pyvista as pv
| >>> mesh = pv.Cube()
| >>> rot = mesh.rotate_y(30, inplace=False)
|
| Plot the rotated mesh.
|
| >>> pl = pv.Plotter()
| >>> _ = pl.add_mesh(rot)
| >>> _ = pl.add_mesh(mesh, style='wireframe', line_width=3)
| >>> _ = pl.add_axes_at_origin()
| >>> pl.show()
|
| rotate_z(self: '_MeshType_co', angle: 'float', point: 'VectorLike[float] | None' = None, transform_all_input_vectors: 'bool' = False, inplace: 'bool' = False) -> '_MeshType_co'
| Rotate mesh about the z-axis.
|
| .. note::
| See also the notes at :func:`transform` which is used by this filter
| under the hood.
|
| Parameters
| ----------
| angle : float
| Angle in degrees to rotate about the z-axis.
|
| point : VectorLike[float], optional
| Point to rotate about. Defaults to origin.
|
| transform_all_input_vectors : bool, default: False
| When ``True``, all input vectors are
| transformed. Otherwise, only the points, normals and
| active vectors are transformed.
|
| inplace : bool, default: False
| Updates mesh in-place.
|
| Returns
| -------
| DataSet | MultiBlock
| Rotated dataset. Return type matches input.
|
| See Also
| --------
| pyvista.Transform.rotate_z
| Concatenate a rotation about the z-axis with a transformation.
|
| Examples
| --------
| Rotate a mesh 30 degrees about the z-axis.
|
| >>> import pyvista as pv
| >>> mesh = pv.Cube()
| >>> rot = mesh.rotate_z(30, inplace=False)
|
| Plot the rotated mesh.
|
| >>> pl = pv.Plotter()
| >>> _ = pl.add_mesh(rot)
| >>> _ = pl.add_mesh(mesh, style='wireframe', line_width=3)
| >>> _ = pl.add_axes_at_origin()
| >>> pl.show()
|
| sample(self: '_DataSetOrMultiBlockType', target: 'DataSet | _vtk.vtkDataSet', tolerance: 'float | None' = None, pass_cell_data: 'bool' = True, pass_point_data: 'bool' = True, categorical: 'bool' = False, progress_bar: 'bool' = False, locator: "Literal['cell', 'cell_tree', 'obb_tree', 'static_cell'] | _vtk.vtkAbstractCellLocator | None" = 'static_cell', pass_field_data: 'bool' = True, mark_blank: 'bool' = True, snap_to_closest_point: 'bool' = False)
| Resample array data from a passed mesh onto this mesh.
|
| For `mesh1.sample(mesh2)`, the arrays from `mesh2` are sampled onto
| the points of `mesh1`. This function interpolates within an
| enclosing cell. This contrasts with
| :func:`pyvista.DataSetFilters.interpolate` that uses a distance
| weighting for nearby points. If there is cell topology, `sample` is
| usually preferred.
|
| The point data 'vtkValidPointMask' stores whether the point could be sampled
| with a value of 1 meaning successful sampling. And a value of 0 means
| unsuccessful.
|
| This uses :vtk:`vtkResampleWithDataSet`.
|
| Parameters
| ----------
| target : pyvista.DataSet
| The vtk data object to sample from - point and cell arrays from
| this object are sampled onto the nodes of the ``dataset`` mesh.
|
| tolerance : float, optional
| Tolerance used to compute whether a point in the source is
| in a cell of the input. If not given, tolerance is
| automatically generated.
|
| pass_cell_data : bool, default: True
| Preserve source mesh's original cell data arrays.
|
| pass_point_data : bool, default: True
| Preserve source mesh's original point data arrays.
|
| categorical : bool, default: False
| Control whether the source point data is to be treated as
| categorical. If the data is categorical, then the resultant data
| will be determined by a nearest neighbor interpolation scheme.
|
| progress_bar : bool, default: False
| Display a progress bar to indicate progress.
|
| locator : :vtk:`vtkAbstractCellLocator` or str or None, default: 'static_cell'
| Prototype cell locator to perform the ``FindCell()``
| operation. If ``None``, uses the DataSet ``FindCell`` method.
| Valid strings with mapping to vtk cell locators are
|
| * 'cell' - :vtk:`vtkCellLocator`
| * 'cell_tree' - :vtk:`vtkCellTreeLocator`
| * 'obb_tree' - :vtk:`vtkOBBTree`
| * 'static_cell' - :vtk:`vtkStaticCellLocator`
|
| pass_field_data : bool, default: True
| Preserve source mesh's original field data arrays.
|
| mark_blank : bool, default: True
| Whether to mark blank points and cells in "vtkGhostType".
|
| snap_to_closest_point : bool, default: False
| Whether to snap to cell with closest point if no cell is found. Useful
| when sampling from data with vertex cells. Requires vtk >=9.3.0.
|
| .. versionadded:: 0.43
|
| Returns
| -------
| DataSet | MultiBlock
| Dataset containing resampled data.
|
| See Also
| --------
| pyvista.DataSetFilters.interpolate
| Interpolate values from one mesh onto another.
|
| pyvista.ImageDataFilters.resample
| Resample image data to modify its dimensions and spacing.
|
| Examples
| --------
| Resample data from another dataset onto a sphere.
|
| >>> import pyvista as pv
| >>> from pyvista import examples
| >>> mesh = pv.Sphere(center=(4.5, 4.5, 4.5), radius=4.5)
| >>> data_to_probe = examples.load_uniform()
| >>> result = mesh.sample(data_to_probe)
| >>> result.plot(scalars='Spatial Point Data')
|
| If sampling from a set of points represented by a ``(n, 3)``
| shaped ``numpy.ndarray``, they need to be converted to a
| PyVista DataSet, e.g. :class:`pyvista.PolyData`, first.
|
| >>> import numpy as np
| >>> points = np.array([[1.5, 5.0, 6.2], [6.7, 4.2, 8.0]])
| >>> mesh = pv.PolyData(points)
| >>> result = mesh.sample(data_to_probe)
| >>> result['Spatial Point Data']
| pyvista_ndarray([ 46.5 , 225.12])
|
| See :ref:`resampling_example` and :ref:`interpolate_sample_example`
| for more examples using this filter.
|
| scale(self: '_MeshType_co', xyz: 'float | VectorLike[float]', transform_all_input_vectors: 'bool' = False, inplace: 'bool' = False, point: 'VectorLike[float] | None' = None) -> '_MeshType_co'
| Scale the mesh.
|
| .. note::
| See also the notes at :func:`transform` which is used by this filter
| under the hood.
|
| Parameters
| ----------
| xyz : float | VectorLike[float]
| A vector sequence defining the scale factors along x, y, and z. If
| a scalar, the same uniform scale is used along all three axes.
|
| transform_all_input_vectors : bool, default: False
| When ``True``, all input vectors are transformed. Otherwise, only
| the points, normals and active vectors are transformed.
|
| inplace : bool, default: False
| Updates mesh in-place.
|
| point : VectorLike[float], optional
| Point to scale from. Defaults to origin.
|
| Returns
| -------
| DataSet | MultiBlock
| Scaled dataset. Return type matches input.
|
| See Also
| --------
| pyvista.Transform.scale
| Concatenate a scale matrix with a transformation.
|
| pyvista.DataObjectFilters.resize
| Resize a mesh.
|
| Examples
| --------
| >>> import pyvista as pv
| >>> from pyvista import examples
| >>> mesh1 = examples.download_teapot()
| >>> mesh2 = mesh1.scale([10.0, 10.0, 10.0], inplace=False)
|
| Plot meshes side-by-side
|
| >>> pl = pv.Plotter(shape=(1, 2))
| >>> # Create plot with unscaled mesh
| >>> pl.subplot(0, 0)
| >>> _ = pl.add_mesh(mesh1)
| >>> pl.show_axes()
| >>> _ = pl.show_grid()
| >>> # Create plot with scaled mesh
| >>> pl.subplot(0, 1)
| >>> _ = pl.add_mesh(mesh2)
| >>> pl.show_axes()
| >>> _ = pl.show_grid()
| >>> pl.show(cpos='xy')
|
| slice(self: '_DataSetOrMultiBlockType', normal: 'VectorLike[float] | NormalsLiteral' = 'x', origin: 'VectorLike[float] | None' = None, generate_triangles: 'bool' = False, contour: 'bool' = False, progress_bar: 'bool' = False)
| Slice a dataset by a plane at the specified origin and normal vector orientation.
|
| If no origin is specified, the center of the input dataset will be used.
|
| Parameters
| ----------
| normal : sequence[float] | str, default: 'x'
| Length 3 tuple for the normal vector direction. Can also be
| specified as a string conventional direction such as ``'x'`` for
| ``(1, 0, 0)`` or ``'-x'`` for ``(-1, 0, 0)``, etc.
|
| origin : sequence[float], optional
| The center ``(x, y, z)`` coordinate of the plane on which
| the slice occurs.
|
| generate_triangles : bool, default: False
| If this is enabled (``False`` by default), the output will
| be triangles. Otherwise the output will be the intersection
| polygons.
|
| contour : bool, default: False
| If ``True``, apply a ``contour`` filter after slicing.
|
| progress_bar : bool, default: False
| Display a progress bar to indicate progress.
|
| Returns
| -------
| pyvista.PolyData
| Sliced dataset.
|
| See Also
| --------
| slice_implicit
| slice_orthogonal
| slice_along_axis
| slice_along_line
| :meth:`~pyvista.ImageDataFilters.slice_index`
|
| Examples
| --------
| Slice the surface of a sphere.
|
| >>> import pyvista as pv
| >>> sphere = pv.Sphere()
| >>> slice_x = sphere.slice(normal='x')
| >>> slice_y = sphere.slice(normal='y')
| >>> slice_z = sphere.slice(normal='z')
| >>> slices = slice_x + slice_y + slice_z
| >>> slices.plot(line_width=5)
|
| See :ref:`slice_example` for more examples using this filter.
|
| slice_along_axis(self: '_DataSetOrMultiBlockType', n: 'int' = 5, axis: "Literal['x', 'y', 'z', 0, 1, 2]" = 'x', tolerance: 'float | None' = None, generate_triangles: 'bool' = False, contour: 'bool' = False, bounds=None, center=None, progress_bar: 'bool' = False)
| Create many slices of the input dataset along a specified axis.
|
| Parameters
| ----------
| n : int, default: 5
| The number of slices to create.
|
| axis : str | int, default: 'x'
| The axis to generate the slices along. Perpendicular to the
| slices. Can be string name (``'x'``, ``'y'``, or ``'z'``) or
| axis index (``0``, ``1``, or ``2``).
|
| tolerance : float, optional
| The tolerance to the edge of the dataset bounds to create
| the slices. The ``n`` slices are placed equidistantly with
| an absolute padding of ``tolerance`` inside each side of the
| ``bounds`` along the specified axis. Defaults to 1% of the
| ``bounds`` along the specified axis.
|
| generate_triangles : bool, default: False
| When ``True``, the output will be triangles. Otherwise the output
| will be the intersection polygons.
|
| contour : bool, default: False
| If ``True``, apply a ``contour`` filter after slicing.
|
| bounds : sequence[float], optional
| A 6-length sequence overriding the bounds of the mesh.
| The bounds along the specified axis define the extent
| where slices are taken.
|
| center : sequence[float], optional
| A 3-length sequence specifying the position of the line
| along which slices are taken. Defaults to the center of
| the mesh.
|
| progress_bar : bool, default: False
| Display a progress bar to indicate progress.
|
| Returns
| -------
| pyvista.PolyData
| Sliced dataset.
|
| See Also
| --------
| slice
| slice_implicit
| slice_orthogonal
| slice_along_line
| :meth:`~pyvista.ImageDataFilters.slice_index`
|
| Examples
| --------
| Slice the random hills dataset in the X direction.
|
| >>> from pyvista import examples
| >>> hills = examples.load_random_hills()
| >>> slices = hills.slice_along_axis(n=10)
| >>> slices.plot(line_width=5)
|
| Slice the random hills dataset in the Z direction.
|
| >>> from pyvista import examples
| >>> hills = examples.load_random_hills()
| >>> slices = hills.slice_along_axis(n=10, axis='z')
| >>> slices.plot(line_width=5)
|
| See :ref:`slice_example` for more examples using this filter.
|
| slice_along_line(self: '_DataSetOrMultiBlockType', line: 'pyvista.PolyData', generate_triangles: 'bool' = False, contour: 'bool' = False, progress_bar: 'bool' = False)
| Slice a dataset using a polyline/spline as the path.
|
| This also works for lines generated with :func:`pyvista.Line`.
|
| Parameters
| ----------
| line : pyvista.PolyData
| A PolyData object containing one single PolyLine cell.
|
| generate_triangles : bool, default: False
| When ``True``, the output will be triangles. Otherwise the output
| will be the intersection polygons.
|
| contour : bool, default: False
| If ``True``, apply a ``contour`` filter after slicing.
|
| progress_bar : bool, default: False
| Display a progress bar to indicate progress.
|
| Returns
| -------
| pyvista.PolyData
| Sliced dataset.
|
| See Also
| --------
| slice
| slice_implicit
| slice_orthogonal
| slice_along_axis
| :meth:`~pyvista.ImageDataFilters.slice_index`
|
| Examples
| --------
| Slice the random hills dataset along a circular arc.
|
| >>> import numpy as np
| >>> import pyvista as pv
| >>> from pyvista import examples
| >>> hills = examples.load_random_hills()
| >>> center = np.array(hills.center)
| >>> point_a = center + np.array([5, 0, 0])
| >>> point_b = center + np.array([-5, 0, 0])
| >>> arc = pv.CircularArc(
| ... pointa=point_a, pointb=point_b, center=center, resolution=100
| ... )
| >>> line_slice = hills.slice_along_line(arc)
|
| Plot the circular arc and the hills mesh.
|
| >>> pl = pv.Plotter()
| >>> _ = pl.add_mesh(hills, smooth_shading=True, style='wireframe')
| >>> _ = pl.add_mesh(
| ... line_slice,
| ... line_width=10,
| ... render_lines_as_tubes=True,
| ... color='k',
| ... )
| >>> _ = pl.add_mesh(arc, line_width=10, color='grey')
| >>> pl.show()
|
| See :ref:`slice_example` for more examples using this filter.
|
| slice_implicit(self: '_DataSetOrMultiBlockType', implicit_function: '_vtk.vtkImplicitFunction', generate_triangles: 'bool' = False, contour: 'bool' = False, progress_bar: 'bool' = False)
| Slice a dataset by a VTK implicit function.
|
| Parameters
| ----------
| implicit_function : :vtk:`vtkImplicitFunction`
| Specify the implicit function to perform the cutting.
|
| generate_triangles : bool, default: False
| If this is enabled (``False`` by default), the output will
| be triangles. Otherwise the output will be the intersection
| polygons. If the cutting function is not a plane, the
| output will be 3D polygons, which might be nice to look at
| but hard to compute with downstream.
|
| contour : bool, default: False
| If ``True``, apply a ``contour`` filter after slicing.
|
| progress_bar : bool, default: False
| Display a progress bar to indicate progress.
|
| Returns
| -------
| pyvista.PolyData
| Sliced dataset.
|
| See Also
| --------
| slice
| slice_orthogonal
| slice_along_axis
| slice_along_line
| :meth:`~pyvista.ImageDataFilters.slice_index`
|
| Examples
| --------
| Slice the surface of a sphere.
|
| >>> import pyvista as pv
| >>> import vtk
| >>> sphere = vtk.vtkSphere()
| >>> sphere.SetRadius(10)
| >>> mesh = pv.Wavelet()
| >>> slice = mesh.slice_implicit(sphere)
| >>> slice.plot(show_edges=True, line_width=5)
|
| >>> cylinder = vtk.vtkCylinder()
| >>> cylinder.SetRadius(10)
| >>> mesh = pv.Wavelet()
| >>> slice = mesh.slice_implicit(cylinder)
| >>> slice.plot(show_edges=True, line_width=5)
|
| slice_orthogonal(self: '_DataSetOrMultiBlockType', x: 'float | None' = None, y: 'float | None' = None, z: 'float | None' = None, generate_triangles: 'bool' = False, contour: 'bool' = False, progress_bar: 'bool' = False)
| Create three orthogonal slices through the dataset on the three cartesian planes.
|
| Yields a MutliBlock dataset of the three slices.
|
| Parameters
| ----------
| x : float, optional
| The X location of the YZ slice.
|
| y : float, optional
| The Y location of the XZ slice.
|
| z : float, optional
| The Z location of the XY slice.
|
| generate_triangles : bool, default: False
| When ``True``, the output will be triangles. Otherwise the output
| will be the intersection polygons.
|
| contour : bool, default: False
| If ``True``, apply a ``contour`` filter after slicing.
|
| progress_bar : bool, default: False
| Display a progress bar to indicate progress.
|
| Returns
| -------
| pyvista.PolyData
| Sliced dataset.
|
| See Also
| --------
| slice
| slice_implicit
| slice_along_axis
| slice_along_line
| :meth:`~pyvista.ImageDataFilters.slice_index`
|
| Examples
| --------
| Slice the random hills dataset with three orthogonal planes.
|
| >>> from pyvista import examples
| >>> hills = examples.load_random_hills()
| >>> slices = hills.slice_orthogonal(contour=False)
| >>> slices.plot(line_width=5)
|
| See :ref:`slice_example` for more examples using this filter.
|
| transform(self: '_MeshType_co', trans: 'TransformLike', transform_all_input_vectors: 'bool' = False, inplace: 'bool | None' = None, progress_bar: 'bool' = False) -> '_MeshType_co'
| Transform this mesh with a 4x4 transform.
|
| .. warning::
| When using ``transform_all_input_vectors=True``, there is
| no distinction in VTK between vectors and arrays with
| three components. This may be an issue if you have scalar
| data with three components (e.g. RGB data). This will be
| improperly transformed as if it was vector data rather
| than scalar data. One possible (albeit ugly) workaround
| is to store the three components as separate scalar
| arrays.
|
| .. warning::
| In general, transformations give non-integer results. This
| method converts integer-typed vector data to float before
| performing the transformation. This applies to the points
| array, as well as any vector-valued data that is affected
| by the transformation. To prevent subtle bugs arising from
| in-place transformations truncating the result to integers,
| this conversion always applies to the input mesh.
|
| .. warning::
| Shear transformations are not supported for :class:`~pyvista.ImageData` or
| :class:`~pyvista.RectilinearGrid`, and rotations are not supported for
| :class:`~pyvista.RectilinearGrid`. If present, these component(s) are removed by the
| filter. To fully support these transformations, the input should be cast to
| :class:`~pyvista.StructuredGrid` `before` applying this filter.
|
| .. note::
| Transforming :class:`~pyvista.ImageData` modifies its
| :class:`~pyvista.ImageData.origin`,
| :class:`~pyvista.ImageData.spacing`, and
| :class:`~pyvista.ImageData.direction_matrix` properties.
|
| .. deprecated:: 0.45.0
| `inplace` was previously defaulted to `True`. In the future this will change
| to `False`.
|
| .. versionchanged:: 0.45.0
| Transforming :class:`~pyvista.ImageData` now returns ``ImageData``.
| Previously, :class:`~pyvista.StructuredGrid` was returned.
|
| .. versionchanged:: 0.46.0
| Transforming :class:`~pyvista.RectilinearGrid` now returns ``RectilinearGrid``.
| Previously, :class:`~pyvista.StructuredGrid` was returned.
|
| Parameters
| ----------
| trans : TransformLike
| Accepts a vtk transformation object or a 4x4
| transformation matrix.
|
| transform_all_input_vectors : bool, default: False
| When ``True``, all arrays with three components are
| transformed. Otherwise, only the normals and vectors are
| transformed. See the warning for more details.
|
| inplace : bool, default: True
| When ``True``, modifies the dataset inplace.
|
| progress_bar : bool, default: False
| Display a progress bar to indicate progress.
|
| Returns
| -------
| DataSet | MultiBlock
| Transformed dataset. Return type matches input.
|
| See Also
| --------
| pyvista.Transform
| Describe linear transformations via a 4x4 matrix.
| pyvista.Prop3D.transform
| Transform an actor.
|
| Examples
| --------
| Translate a mesh by ``(50, 100, 200)``.
|
| >>> import numpy as np
| >>> from pyvista import examples
| >>> mesh = examples.load_airplane()
|
| Here a 4x4 :class:`numpy.ndarray` is used, but any :class:`~pyvista.TransformLike`
| is accepted.
|
| >>> transform_matrix = np.array(
| ... [
| ... [1, 0, 0, 50],
| ... [0, 1, 0, 100],
| ... [0, 0, 1, 200],
| ... [0, 0, 0, 1],
| ... ]
| ... )
| >>> transformed = mesh.transform(transform_matrix, inplace=False)
| >>> transformed.plot(show_edges=True)
|
| translate(self: '_MeshType_co', xyz: 'VectorLike[float]', transform_all_input_vectors: 'bool' = False, inplace: 'bool' = False) -> '_MeshType_co'
| Translate the mesh.
|
| .. note::
| See also the notes at :func:`transform` which is used by this filter
| under the hood.
|
| Parameters
| ----------
| xyz : VectorLike[float]
| A vector of three floats.
|
| transform_all_input_vectors : bool, default: False
| When ``True``, all input vectors are
| transformed. Otherwise, only the points, normals and
| active vectors are transformed.
|
| inplace : bool, default: False
| Updates mesh in-place.
|
| Returns
| -------
| DataSet | MultiBlock
| Translated dataset. Return type matches input.
|
| See Also
| --------
| pyvista.Transform.translate
| Concatenate a translation matrix with a transformation.
|
| Examples
| --------
| Create a sphere and translate it by ``(2, 1, 2)``.
|
| >>> import pyvista as pv
| >>> mesh = pv.Sphere()
| >>> mesh.center
| (0.0, 0.0, 0.0)
| >>> trans = mesh.translate((2, 1, 2), inplace=False)
| >>> trans.center
| (2.0, 1.0, 2.0)
|
| triangulate(self: '_DataSetOrMultiBlockType', inplace: 'bool' = False, progress_bar: 'bool' = False)
| Return an all triangle mesh.
|
| More complex polygons will be broken down into triangles.
|
| Parameters
| ----------
| inplace : bool, default: False
| Updates mesh in-place.
|
| progress_bar : bool, default: False
| Display a progress bar to indicate progress.
|
| Returns
| -------
| pyvista.PolyData
| Mesh containing only triangles.
|
| Examples
| --------
| Generate a mesh with quadrilateral faces.
|
| >>> import pyvista as pv
| >>> plane = pv.Plane()
| >>> plane.point_data.clear()
| >>> plane.plot(show_edges=True, line_width=5)
|
| Convert it to an all triangle mesh.
|
| >>> mesh = plane.triangulate()
| >>> mesh.plot(show_edges=True, line_width=5)
|
| ----------------------------------------------------------------------
| Methods inherited from pyvista.core.dataobject.DataObject:
|
| __eq__(self: 'Self', other: 'object') -> 'bool'
| Test equivalency between data objects.
|
| __getstate__(self: 'Self') -> 'tuple[FunctionType, tuple[dict[str, Any]]] | dict[str, Any]'
| Support pickle.
|
| __setstate__(self: 'Self', state: 'Any') -> 'None'
| Support unpickle.
|
| add_field_data(self: 'Self', array: 'NumpyArray[float]', name: 'str', deep: 'bool' = True) -> 'None'
| Add field data.
|
| Use field data when size of the data you wish to associate
| with the dataset does not match the number of points or cells
| of the dataset.
|
| Parameters
| ----------
| array : sequence
| Array of data to add to the dataset as a field array.
|
| name : str
| Name to assign the field array.
|
| deep : bool, default: True
| Perform a deep copy of the data when adding it to the
| dataset.
|
| Examples
| --------
| Add field data to a PolyData dataset.
|
| >>> import pyvista as pv
| >>> import numpy as np
| >>> mesh = pv.Sphere()
| >>> mesh.add_field_data(np.arange(10), 'my-field-data')
| >>> mesh['my-field-data']
| pyvista_ndarray([0, 1, 2, 3, 4, 5, 6, 7, 8, 9])
|
| Add field data to a ImageData dataset.
|
| >>> mesh = pv.ImageData(dimensions=(2, 2, 1))
| >>> mesh.add_field_data(['I could', 'write', 'notes', 'here'], 'my-field-data')
| >>> mesh['my-field-data']
| pyvista_ndarray(['I could', 'write', 'notes', 'here'], dtype='<U7')
|
| Add field data to a MultiBlock dataset.
|
| >>> blocks = pv.MultiBlock()
| >>> blocks.append(pv.Sphere())
| >>> blocks['cube'] = pv.Cube(center=(0, 0, -1))
| >>> blocks.add_field_data([1, 2, 3], 'my-field-data')
| >>> blocks.field_data['my-field-data']
| pyvista_ndarray([1, 2, 3])
|
| clear_field_data(self: 'Self') -> 'None'
| Remove all field data.
|
| Examples
| --------
| Add field data to a PolyData dataset and then remove it.
|
| >>> import pyvista as pv
| >>> mesh = pv.Sphere()
| >>> mesh.field_data['my-field-data'] = range(10)
| >>> len(mesh.field_data)
| 1
| >>> mesh.clear_field_data()
| >>> len(mesh.field_data)
| 0
|
| copy(self: 'Self', deep: 'bool' = True) -> 'Self'
| Return a copy of the object.
|
| Parameters
| ----------
| deep : bool, default: True
| When ``True`` makes a full copy of the object. When
| ``False``, performs a shallow copy where the points, cell,
| and data arrays are references to the original object.
|
| Returns
| -------
| pyvista.DataSet
| Deep or shallow copy of the input. Type is identical to
| the input.
|
| Examples
| --------
| Create and make a deep copy of a PolyData object.
|
| >>> import pyvista as pv
| >>> mesh_a = pv.Sphere()
| >>> mesh_b = mesh_a.copy()
| >>> mesh_a == mesh_b
| True
|
| copy_attributes(self: 'Self', dataset: 'Self') -> 'None'
| Copy the data attributes of the input dataset object.
|
| Parameters
| ----------
| dataset : pyvista.DataSet
| Dataset to copy the data attributes from.
|
| Examples
| --------
| >>> import pyvista as pv
| >>> source = pv.ImageData(dimensions=(10, 10, 5))
| >>> source = source.compute_cell_sizes()
| >>> target = pv.ImageData(dimensions=(10, 10, 5))
| >>> target.copy_attributes(source)
| >>> target.plot(scalars='Volume', show_edges=True)
|
| copy_structure(self: 'Self', dataset: 'Self') -> 'None'
| Copy the structure (geometry and topology) of the input dataset object.
|
| Parameters
| ----------
| dataset : :vtk:`vtkDataSet`
| Dataset to copy the geometry and topology from.
|
| Examples
| --------
| >>> import pyvista as pv
| >>> source = pv.ImageData(dimensions=(10, 10, 5))
| >>> target = pv.ImageData()
| >>> target.copy_structure(source)
| >>> target.plot(show_edges=True)
|
| deep_copy(self: 'Self', to_copy: 'Self | _vtk.vtkDataObject') -> 'None'
| Overwrite this data object with another data object as a deep copy.
|
| Parameters
| ----------
| to_copy : DataObject | :vtk:`vtkDataObject`
| Data object to perform a deep copy from.
|
| head(self: 'Self', display: 'bool' = True, html: 'bool | None' = None) -> 'str'
| Return the header stats of this dataset.
|
| If in IPython, this will be formatted to HTML. Otherwise
| returns a console friendly string.
|
| Parameters
| ----------
| display : bool, default: True
| Display this header in iPython.
|
| html : bool, optional
| Generate the output as HTML.
|
| Returns
| -------
| str
| Header statistics.
|
| save(self: 'Self', filename: 'Path | str', binary: 'bool' = True, texture: 'NumpyArray[np.uint8] | str | None' = None) -> 'None'
| Save this vtk object to file.
|
| .. versionadded:: 0.45
|
| Support saving pickled meshes
|
| See Also
| --------
| pyvista.read
|
| Parameters
| ----------
| filename : str, pathlib.Path
| Filename of output file. Writer type is inferred from
| the extension of the filename.
|
| binary : bool, default: True
| If ``True``, write as binary. Otherwise, write as ASCII.
|
| texture : str, np.ndarray, optional
| Write a single texture array to file when using a PLY
| file. Texture array must be a 3 or 4 component array with
| the datatype ``np.uint8``. Array may be a cell array or a
| point array, and may also be a string if the array already
| exists in the PolyData.
|
| If a string is provided, the texture array will be saved
| to disk as that name. If an array is provided, the
| texture array will be saved as ``'RGBA'``
|
| .. note::
| This feature is only available when saving PLY files.
|
| Notes
| -----
| Binary files write much faster than ASCII and have a smaller
| file size.
|
| shallow_copy(self: 'Self', to_copy: 'Self | _vtk.vtkDataObject') -> 'None'
| Shallow copy the given mesh to this mesh.
|
| Parameters
| ----------
| to_copy : DataObject | :vtk:`vtkDataObject`
| Data object to perform a shallow copy from.
|
| ----------------------------------------------------------------------
| Readonly properties inherited from pyvista.core.dataobject.DataObject:
|
| actual_memory_size
| Return the actual size of the dataset object.
|
| Returns
| -------
| int
| The actual size of the dataset object in kibibytes (1024
| bytes).
|
| Examples
| --------
| >>> from pyvista import examples
| >>> mesh = examples.load_airplane()
| >>> mesh.actual_memory_size # doctest:+SKIP
| 93
|
| field_data
| Return FieldData as DataSetAttributes.
|
| Use field data when size of the data you wish to associate
| with the dataset does not match the number of points or cells
| of the dataset.
|
| Returns
| -------
| DataSetAttributes
| FieldData as DataSetAttributes.
|
| Examples
| --------
| Add field data to a PolyData dataset and then return it.
|
| >>> import pyvista as pv
| >>> import numpy as np
| >>> mesh = pv.Sphere()
| >>> mesh.field_data['my-field-data'] = np.arange(10)
| >>> mesh.field_data['my-field-data']
| pyvista_ndarray([0, 1, 2, 3, 4, 5, 6, 7, 8, 9])
|
| memory_address
| Get address of the underlying VTK C++ object.
|
| Returns
| -------
| str
| Memory address formatted as ``'Addr=%p'``.
|
| Examples
| --------
| >>> import pyvista as pv
| >>> mesh = pv.Sphere()
| >>> mesh.memory_address
| 'Addr=...'
|
| ----------------------------------------------------------------------
| Data descriptors inherited from pyvista.core.dataobject.DataObject:
|
| user_dict
| Set or return a user-specified data dictionary.
|
| The dictionary is stored as a JSON-serialized string as part of the mesh's
| field data. Unlike regular field data, which requires values to be stored
| as an array, the user dict provides a mapping for scalar values.
|
| Since the user dict is stored as field data, it is automatically saved
| with the mesh when it is saved in a compatible file format (e.g. ``'.vtk'``).
| Any saved metadata is automatically de-serialized by PyVista whenever
| the user dict is accessed again. Since the data is stored as JSON, it
| may also be easily retrieved or read by other programs.
|
| Any JSON-serializable values are permitted by the user dict, i.e. values
| can have type ``dict``, ``list``, ``tuple``, ``str``, ``int``, ``float``,
| ``bool``, or ``None``. Storing NumPy arrays is not directly supported, but
| these may be cast beforehand to a supported type, e.g. by calling ``tolist()``
| on the array.
|
| To completely remove the user dict string from the dataset's field data,
| set its value to ``None``.
|
| .. note::
|
| The user dict is a convenience property and is intended for metadata storage.
| It has an inefficient dictionary implementation and should only be used to
| store a small number of infrequently-accessed keys with relatively small
| values. It should not be used to store frequently accessed array data
| with many entries (a regular field data array should be used instead).
|
| .. warning::
|
| Field data is typically passed-through by dataset filters, and therefore
| the user dict's items can generally be expected to persist and remain
| unchanged in the output of filtering methods. However, this behavior is
| not guaranteed, as it's possible that some filters may modify or clear
| field data. Use with caution.
|
| .. versionadded:: 0.44
|
| Returns
| -------
| UserDict
| JSON-serialized dict-like object which is subclassed from
| :py:class:`collections.UserDict`.
|
| Examples
| --------
| Load a mesh.
|
| >>> import pyvista as pv
| >>> from pyvista import examples
| >>> mesh = examples.load_ant()
|
| Add data to the user dict. The contents are serialized as JSON.
|
| >>> mesh.user_dict['name'] = 'ant'
| >>> mesh.user_dict
| {"name": "ant"}
|
| Alternatively, set the user dict from an existing dict.
|
| >>> mesh.user_dict = dict(name='ant')
|
| The user dict can be updated like a regular dict.
|
| >>> mesh.user_dict.update(
| ... {
| ... 'num_legs': 6,
| ... 'body_parts': ['head', 'thorax', 'abdomen'],
| ... }
| ... )
| >>> mesh.user_dict
| {"name": "ant", "num_legs": 6, "body_parts": ["head", "thorax", "abdomen"]}
|
| Data in the user dict is stored as field data.
|
| >>> mesh.field_data
| pyvista DataSetAttributes
| Association : NONE
| Contains arrays :
| _PYVISTA_USER_DICT str "{"name": "ant",..."
|
| Since it's field data, the user dict can be saved to file along with the
| mesh and retrieved later.
|
| >>> mesh.save('ant.vtk')
| >>> mesh_from_file = pv.read('ant.vtk')
| >>> mesh_from_file.user_dict
| {"name": "ant", "num_legs": 6, "body_parts": ["head", "thorax", "abdomen"]}
|
| ----------------------------------------------------------------------
| Data and other attributes inherited from pyvista.core.dataobject.DataObject:
|
| __hash__ = None
|
| ----------------------------------------------------------------------
| Methods inherited from pyvista.core.utilities.misc._NoNewAttrMixin:
|
| __setattr__(self, key: 'str', value: 'Any') -> 'None'
| Prevent adding new attributes to classes using "normal" methods.
|
| ----------------------------------------------------------------------
| Methods inherited from pyvista.core._vtk_core.DisableVtkSnakeCase:
|
| __getattribute__(self, item)
| Return getattr(self, name).
|
| ----------------------------------------------------------------------
| Static methods inherited from pyvista.core._vtk_core.DisableVtkSnakeCase:
|
| check_attribute(target, attr)
|
| ----------------------------------------------------------------------
| Class methods inherited from pyvista.core._vtk_core.vtkPyVistaOverride:
|
| __init_subclass__(**kwargs)
| This method is called when a class is subclassed.
|
| The default implementation does nothing. It may be
| overridden to extend subclasses.
|
| ----------------------------------------------------------------------
| Methods inherited from vtkmodules.vtkCommonDataModel.vtkImageData:
|
| AllocateScalars(...)
| AllocateScalars(self, dataType:int, numComponents:int) -> None
| C++: virtual void AllocateScalars(int dataType, int numComponents)
| AllocateScalars(self, pipeline_info:vtkInformation) -> None
| C++: virtual void AllocateScalars(vtkInformation *pipeline_info)
|
| Allocate the point scalars for this dataset. The data type
| determines the type of the array (VTK_FLOAT, VTK_INT etc.) where
| as numComponents determines its number of components.
|
| ApplyIndexToPhysicalMatrix(...)
| ApplyIndexToPhysicalMatrix(self, source:vtkMatrix4x4) -> None
| C++: void ApplyIndexToPhysicalMatrix(vtkMatrix4x4 *source)
|
| Set the transformation matrix from the index space to the
| physical space coordinate system of the dataset. The transform is
| a 4 by 4 matrix. The supplied matrix pointer is not stored in the
| the image object but the matrix values are used for updating the
| Origin, Spacing, and DirectionMatrix.
| \sa SetOrigin
| \sa SetSpacing
| \sa SetDirectionMatrix
|
| ApplyPhysicalToIndexMatrix(...)
| ApplyPhysicalToIndexMatrix(self, source:vtkMatrix4x4) -> None
| C++: void ApplyPhysicalToIndexMatrix(vtkMatrix4x4 *source)
|
| Get the transformation matrix from the physical space to the
| index space coordinate system of the dataset. The transform is a
| 4 by 4 matrix. The supplied matrix pointer is not stored in the
| the image object but the matrix values are used for updating the
| Origin, Spacing, and DirectionMatrix.
| \sa SetOrigin
| \sa SetSpacing
| \sa SetDirectionMatrix
|
| BlankCell(...)
| BlankCell(self, ptId:int) -> None
| C++: virtual void BlankCell(vtkIdType ptId)
| BlankCell(self, i:int, j:int, k:int) -> None
| C++: virtual void BlankCell(int i, int j, int k)
|
| Methods for supporting blanking of cells. Blanking turns on or
| off cells in the structured grid. These methods should be called
| only after the dimensions of the grid are set.
|
| BlankPoint(...)
| BlankPoint(self, ptId:int) -> None
| C++: virtual void BlankPoint(vtkIdType ptId)
| BlankPoint(self, i:int, j:int, k:int) -> None
| C++: virtual void BlankPoint(int i, int j, int k)
|
| Methods for supporting blanking of cells. Blanking turns on or
| off points in the structured grid, and hence the cells connected
| to them. These methods should be called only after the dimensions
| of the grid are set.
|
| ComputeBounds(...)
| ComputeBounds(self) -> None
| C++: void ComputeBounds() override;
|
| Compute the data bounding box from data points. THIS METHOD IS
| NOT THREAD SAFE.
|
| ComputeCellId(...)
| ComputeCellId(self, ijk:[int, int, int]) -> int
| C++: virtual vtkIdType ComputeCellId(int ijk[3])
|
| Given a location in structured coordinates (i-j-k), return the
| cell id.
|
| ComputeIndexToPhysicalMatrix(...)
| ComputeIndexToPhysicalMatrix(origin:(float, float, float),
| spacing:(float, float, float), direction:(float, float, float,
| float, float, float, float, float, float), result:[float,
| float, float, float, float, float, float, float, float, float,
| float, float, float, float, float, float]) -> None
| C++: static void ComputeIndexToPhysicalMatrix(
| double const origin[3], double const spacing[3],
| double const direction[9], double result[16])
|
| Static method to compute the IndexToPhysicalMatrix.
|
| ComputeInternalExtent(...)
| ComputeInternalExtent(self, intExt:[int, ...], tgtExt:[int, ...],
| bnds:[int, ...]) -> None
| C++: void ComputeInternalExtent(int *intExt, int *tgtExt,
| int *bnds)
|
| Given how many pixel are required on a side for boundary
| conditions (in bnds), the target extent to traverse, compute the
| internal extent (the extent for this ImageData that does not
| suffer from any boundary conditions) and place it in intExt
|
| ComputePhysicalToIndexMatrix(...)
| ComputePhysicalToIndexMatrix(origin:(float, float, float),
| spacing:(float, float, float), direction:(float, float, float,
| float, float, float, float, float, float), result:[float,
| float, float, float, float, float, float, float, float, float,
| float, float, float, float, float, float]) -> None
| C++: static void ComputePhysicalToIndexMatrix(
| double const origin[3], double const spacing[3],
| double const direction[9], double result[16])
|
| Static method to compute the PhysicalToIndexMatrix.
|
| ComputePointId(...)
| ComputePointId(self, ijk:[int, int, int]) -> int
| C++: virtual vtkIdType ComputePointId(int ijk[3])
|
| Given a location in structured coordinates (i-j-k), return the
| point id.
|
| ComputeStructuredCoordinates(...)
| ComputeStructuredCoordinates(self, x:(float, float, float),
| ijk:[int, int, int], pcoords:[float, float, float]) -> int
| C++: virtual int ComputeStructuredCoordinates(const double x[3],
| int ijk[3], double pcoords[3])
| ComputeStructuredCoordinates(self, x:(float, float, float),
| ijk:[int, int, int], pcoords:[float, float, float],
| tol2:float) -> int
| C++: virtual int ComputeStructuredCoordinates(const double x[3],
| int ijk[3], double pcoords[3], double tol2)
|
| Convenience function computes the structured coordinates for a
| point x[3]. The voxel is specified by the array ijk[3], and the
| parametric coordinates in the cell are specified with pcoords[3].
| The function returns a 0 if the point x is outside of the volume,
| and a 1 if inside the volume, using squared tolerance tol2 (1e-12
| if not provided).
|
| CopyAndCastFrom(...)
| CopyAndCastFrom(self, inData:vtkImageData, extent:[int, int, int,
| int, int, int]) -> None
| C++: virtual void CopyAndCastFrom(vtkImageData *inData,
| int extent[6])
| CopyAndCastFrom(self, inData:vtkImageData, x0:int, x1:int, y0:int,
| y1:int, z0:int, z1:int) -> None
| C++: virtual void CopyAndCastFrom(vtkImageData *inData, int x0,
| int x1, int y0, int y1, int z0, int z1)
|
| This method is passed a input and output region, and executes the
| filter algorithm to fill the output from the input. It just
| executes a switch statement to call the correct function for the
| regions data types.
|
| CopyInformationFromPipeline(...)
| CopyInformationFromPipeline(self, information:vtkInformation)
| -> None
| C++: void CopyInformationFromPipeline(vtkInformation *information)
| override;
|
| Override these to handle origin, spacing, scalar type, and scalar
| number of components. See vtkDataObject for details.
|
| CopyInformationToPipeline(...)
| CopyInformationToPipeline(self, information:vtkInformation)
| -> None
| C++: void CopyInformationToPipeline(vtkInformation *information)
| override;
|
| Copy information from this data object to the pipeline
| information. This is used by the vtkTrivialProducer that is
| created when someone calls SetInputData() to connect the image to
| a pipeline.
|
| CopyStructure(...)
| CopyStructure(self, ds:vtkDataSet) -> None
| C++: void CopyStructure(vtkDataSet *ds) override;
|
| Copy the geometric and topological structure of an input image
| data object.
|
| Crop(...)
| Crop(self, updateExtent:(int, ...)) -> None
| C++: void Crop(const int *updateExtent) override;
|
| Reallocates and copies to set the Extent to updateExtent. This is
| used internally when the exact extent is requested, and the
| source generated more than the update extent.
|
| DeepCopy(...)
| DeepCopy(self, src:vtkDataObject) -> None
| C++: void DeepCopy(vtkDataObject *src) override;
|
| The goal of the method is to copy the complete data from src into
| this object. The implementation is delegated to the differenent
| subclasses. If you want to copy the data up to the array pointers
| only, @see ShallowCopy.
|
| This method deep copy the field data and copy the internal
| structure.
|
| ExtendedNew(...)
| ExtendedNew() -> vtkImageData
| C++: static vtkImageData *ExtendedNew()
|
| FindAndGetCell(...)
| FindAndGetCell(self, x:[float, float, float], cell:vtkCell,
| cellId:int, tol2:float, subId:int, pcoords:[float, float,
| float], weights:[float, ...]) -> vtkCell
| C++: vtkCell *FindAndGetCell(double x[3], vtkCell *cell,
| vtkIdType cellId, double tol2, int &subId, double pcoords[3],
| double *weights) override;
|
| Locate the cell that contains a point and return the cell. Also
| returns the subcell id, parametric coordinates and weights for
| subsequent interpolation. This method combines the derived class
| methods int FindCell and vtkCell *GetCell. Derived classes may
| provide a more efficient implementation. See for example
| vtkStructuredPoints. THIS METHOD IS NOT THREAD SAFE.
|
| FindCell(...)
| FindCell(self, x:[float, float, float], cell:vtkCell, cellId:int,
| tol2:float, subId:int, pcoords:[float, float, float],
| weights:[float, ...]) -> int
| C++: vtkIdType FindCell(double x[3], vtkCell *cell,
| vtkIdType cellId, double tol2, int &subId, double pcoords[3],
| double *weights) override;
| FindCell(self, x:[float, float, float], cell:vtkCell,
| gencell:vtkGenericCell, cellId:int, tol2:float, subId:int,
| pcoords:[float, float, float], weights:[float, ...]) -> int
| C++: vtkIdType FindCell(double x[3], vtkCell *cell,
| vtkGenericCell *gencell, vtkIdType cellId, double tol2,
| int &subId, double pcoords[3], double *weights) override;
|
| Locate cell based on global coordinate x and tolerance squared.
| If cell and cellId is non-nullptr, then search starts from this
| cell and looks at immediate neighbors. Returns cellId >= 0 if
| inside, < 0 otherwise. The parametric coordinates are provided
| in pcoords[3]. The interpolation weights are returned in
| weights[]. (The number of weights is equal to the number of
| points in the found cell). Tolerance is used to control how close
| the point is to be considered "in" the cell. THIS METHOD IS NOT
| THREAD SAFE.
|
| FindPoint(...)
| FindPoint(self, x:[float, float, float]) -> int
| C++: vtkIdType FindPoint(double x[3]) override;
| FindPoint(self, x:float, y:float, z:float) -> int
| C++: vtkIdType FindPoint(double x, double y, double z)
|
| GetActualMemorySize(...)
| GetActualMemorySize(self) -> int
| C++: unsigned long GetActualMemorySize() override;
|
| Return the actual size of the data in kibibytes (1024 bytes).
| This number is valid only after the pipeline has updated. The
| memory size returned is guaranteed to be greater than or equal to
| the memory required to represent the data (e.g., extra space in
| arrays, etc. are not included in the return value). THIS METHOD
| IS THREAD SAFE.
|
| GetArrayIncrements(...)
| GetArrayIncrements(self, array:vtkDataArray, increments:[int, int,
| int]) -> None
| C++: void GetArrayIncrements(vtkDataArray *array,
| vtkIdType increments[3])
|
| Since various arrays have different number of components, the
| will have different increments.
|
| GetArrayPointer(...)
| GetArrayPointer(self, array:vtkDataArray, coordinates:[int, int,
| int]) -> Pointer
| C++: void *GetArrayPointer(vtkDataArray *array,
| int coordinates[3])
|
| GetArrayPointerForExtent(...)
| GetArrayPointerForExtent(self, array:vtkDataArray, extent:[int,
| int, int, int, int, int]) -> Pointer
| C++: void *GetArrayPointerForExtent(vtkDataArray *array,
| int extent[6])
|
| These are convenience methods for getting a pointer from any
| filed array. It is a start at expanding image filters to process
| any array (not just scalars).
|
| GetAxisUpdateExtent(...)
| GetAxisUpdateExtent(self, axis:int, min:int, max:int,
| updateExtent:(int, ...)) -> None
| C++: virtual void GetAxisUpdateExtent(int axis, int &min,
| int &max, const int *updateExtent)
|
| GetCell(...)
| GetCell(self, cellId:int) -> vtkCell
| C++: vtkCell *GetCell(vtkIdType cellId) override;
| GetCell(self, i:int, j:int, k:int) -> vtkCell
| C++: vtkCell *GetCell(int i, int j, int k) override;
| GetCell(self, cellId:int, cell:vtkGenericCell) -> None
| C++: void GetCell(vtkIdType cellId, vtkGenericCell *cell)
| override;
|
| Get cell with cellId such that: 0 <= cellId < NumberOfCells. The
| returned vtkCell is an object owned by this instance, hence the
| return value must not be deleted by the caller.
|
| @warning Repeat calls to this function for different face ids
| will change
| the data stored in the internal member object whose pointer is
| returned by this function.
|
| @warning THIS METHOD IS NOT THREAD SAFE. For a thread-safe
| version, please use
| void GetCell(vtkIdType cellId, vtkGenericCell* cell).
|
| GetCellBounds(...)
| GetCellBounds(self, cellId:int, bounds:[float, float, float,
| float, float, float]) -> None
| C++: void GetCellBounds(vtkIdType cellId, double bounds[6])
| override;
|
| Get the bounds of the cell with cellId such that: 0 <= cellId <
| NumberOfCells. A subclass may be able to determine the bounds of
| cell without using an expensive GetCell() method. A default
| implementation is provided that actually uses a GetCell() call.
| This is to ensure the method is available to all datasets.
| Subclasses should override this method to provide an efficient
| implementation. THIS METHOD IS THREAD SAFE IF FIRST CALLED FROM A
| SINGLE THREAD AND THE DATASET IS NOT MODIFIED
|
| GetCellDims(...)
| GetCellDims(self, cellDims:[int, int, int]) -> None
| C++: void GetCellDims(int cellDims[3])
|
| Given the node dimensions of this grid instance, this method
| computes the node dimensions. The value in each dimension can
| will have a lowest value of "1" such that computing the total
| number of cells can be achieved by simply by
| cellDims[0]*cellDims[1]*cellDims[2].
|
| GetCellNeighbors(...)
| GetCellNeighbors(self, cellId:int, ptIds:vtkIdList,
| cellIds:vtkIdList) -> None
| C++: void GetCellNeighbors(vtkIdType cellId, vtkIdList *ptIds,
| vtkIdList *cellIds) override;
| GetCellNeighbors(self, cellId:int, ptIds:vtkIdList,
| cellIds:vtkIdList, seedLoc:[int, ...]) -> None
| C++: void GetCellNeighbors(vtkIdType cellId, vtkIdList *ptIds,
| vtkIdList *cellIds, int *seedLoc)
|
| Topological inquiry to get all cells using list of points
| exclusive of cell specified (e.g., cellId). Note that the list
| consists of only cells that use ALL the points provided. THIS
| METHOD IS THREAD SAFE IF FIRST CALLED FROM A SINGLE THREAD AND
| THE DATASET IS NOT MODIFIED
|
| GetCellPoints(...)
| GetCellPoints(self, cellId:int, npts:int, pts:(int, ...),
| ptIds:vtkIdList) -> None
| C++: void GetCellPoints(vtkIdType cellId, vtkIdType &npts,
| vtkIdType const *&pts, vtkIdList *ptIds) override;
| GetCellPoints(self, cellId:int, ptIds:vtkIdList) -> None
| C++: void GetCellPoints(vtkIdType cellId, vtkIdList *ptIds)
| override;
|
| Topological inquiry to get points defining cell.
|
| This function MAY use ptIds, which is an object that is created
| by each thread, to guarantee thread safety.
|
| @warning Subsequent calls to this method may invalidate previous
| call
| results.
|
| THIS METHOD IS THREAD SAFE IF FIRST CALLED FROM A SINGLE THREAD
| AND THE DATASET IS NOT MODIFIED
|
| GetCellSize(...)
| GetCellSize(self, cellId:int) -> int
| C++: vtkIdType GetCellSize(vtkIdType cellId) override;
|
| Get the size of cell with cellId such that: 0 <= cellId <
| NumberOfCells. THIS METHOD IS THREAD SAFE IF FIRST CALLED FROM A
| SINGLE THREAD AND THE DATASET IS NOT MODIFIED
|
| @warning This method MUST be overridden for performance reasons.
| Default implementation is very inefficient.
|
| GetCellType(...)
| GetCellType(self, cellId:int) -> int
| C++: int GetCellType(vtkIdType cellId) override;
|
| Get type of cell with cellId such that: 0 <= cellId <
| NumberOfCells. THIS METHOD IS THREAD SAFE IF FIRST CALLED FROM A
| SINGLE THREAD AND THE DATASET IS NOT MODIFIED
|
| GetCellTypesArray(...)
| GetCellTypesArray(self) -> vtkConstantArray_IiE
| C++: vtkConstantArray<int> *GetCellTypesArray()
|
| Get the array of all cell types in the image data. Each
| single-component integer value is the same. The array is of size
| GetNumberOfCells().
|
| NOTE: the returned object should not be modified.
|
| GetCells(...)
| GetCells(self) -> vtkStructuredCellArray
| C++: vtkStructuredCellArray *GetCells()
|
| Return the image data connectivity array.
|
| NOTE: the returned object should not be modified.
|
| GetContinuousIncrements(...)
| GetContinuousIncrements(self, extent:[int, int, int, int, int,
| int], incX:int, incY:int, incZ:int) -> None
| C++: virtual void GetContinuousIncrements(int extent[6],
| vtkIdType &incX, vtkIdType &incY, vtkIdType &incZ)
| GetContinuousIncrements(self, scalars:vtkDataArray, extent:[int,
| int, int, int, int, int], incX:int, incY:int, incZ:int)
| -> None
| C++: virtual void GetContinuousIncrements(vtkDataArray *scalars,
| int extent[6], vtkIdType &incX, vtkIdType &incY,
| vtkIdType &incZ)
|
| Different ways to get the increments for moving around the data.
| incX is always returned with 0. incY is returned with the
| increment needed to move from the end of one X scanline of data
| to the start of the next line. incZ is filled in with the
| increment needed to move from the end of one image to the start
| of the next. The proper way to use these values is to for a loop
| over Z, Y, X, C, incrementing the pointer by 1 after each
| component. When the end of the component is reached, the pointer
| is set to the beginning of the next pixel, thus incX is properly
| set to 0. The first form of GetContinuousIncrements uses the
| active scalar field while the second form allows the scalar array
| to be passed in.
|
| GetData(...)
| GetData(info:vtkInformation) -> vtkImageData
| C++: static vtkImageData *GetData(vtkInformation *info)
| GetData(v:vtkInformationVector, i:int=0) -> vtkImageData
| C++: static vtkImageData *GetData(vtkInformationVector *v,
| int i=0)
|
| Retrieve an instance of this class from an information object.
|
| GetDataDescription(...)
| GetDataDescription(self) -> int
| C++: virtual int GetDataDescription()
|
| Get the data description of the image data.
|
| GetDataDimension(...)
| GetDataDimension(self) -> int
| C++: virtual int GetDataDimension()
|
| Return the dimensionality of the data.
|
| GetDataObjectType(...)
| GetDataObjectType(self) -> int
| C++: int GetDataObjectType() override;
|
| Return what type of dataset this is.
|
| GetDimensions(...)
| GetDimensions(self) -> (int, int, int)
| C++: virtual int *GetDimensions()
| GetDimensions(self, dims:[int, int, int]) -> None
| C++: virtual void GetDimensions(int dims[3])
| GetDimensions(self, dims:[int, int, int]) -> None
| C++: virtual void GetDimensions(vtkIdType dims[3])
|
| Get dimensions of this structured points dataset. It is the
| number of points on each axis. Dimensions are computed from
| Extents during this call.
| \warning Non thread-safe, use second signature if you want it to
| be.
|
| GetDirectionMatrix(...)
| GetDirectionMatrix(self) -> vtkMatrix3x3
| C++: virtual vtkMatrix3x3 *GetDirectionMatrix()
|
| Set/Get the direction transform of the dataset. The direction
| matrix is a 3x3 transformation matrix supporting scaling and
| rotation.
|
| GetExtent(...)
| GetExtent(self) -> (int, int, int, int, int, int)
| C++: virtual int *GetExtent()
|
| GetExtentType(...)
| GetExtentType(self) -> int
| C++: int GetExtentType() override;
|
| The extent type is a 3D extent
|
| GetIncrements(...)
| GetIncrements(self) -> (int, int, int)
| C++: virtual vtkIdType *GetIncrements()
| GetIncrements(self, incX:int, incY:int, incZ:int) -> None
| C++: virtual void GetIncrements(vtkIdType &incX, vtkIdType &incY,
| vtkIdType &incZ)
| GetIncrements(self, inc:[int, int, int]) -> None
| C++: virtual void GetIncrements(vtkIdType inc[3])
| GetIncrements(self, scalars:vtkDataArray) -> (int, int, int)
| C++: virtual vtkIdType *GetIncrements(vtkDataArray *scalars)
| GetIncrements(self, scalars:vtkDataArray, incX:int, incY:int,
| incZ:int) -> None
| C++: virtual void GetIncrements(vtkDataArray *scalars,
| vtkIdType &incX, vtkIdType &incY, vtkIdType &incZ)
| GetIncrements(self, scalars:vtkDataArray, inc:[int, int, int])
| -> None
| C++: virtual void GetIncrements(vtkDataArray *scalars,
| vtkIdType inc[3])
|
| Different ways to get the increments for moving around the data.
| GetIncrements() calls ComputeIncrements() to ensure the
| increments are up to date. The first three methods compute the
| increments based on the active scalar field while the next three,
| the scalar field is passed in.
|
| Note that all methods which do not have the increments passed in
| are not thread-safe. When working on a given `vtkImageData`
| instance on multiple threads, each thread should use the `inc*`
| overloads to compute the increments to avoid racing with other
| threads.
|
| GetIndexToPhysicalMatrix(...)
| GetIndexToPhysicalMatrix(self) -> vtkMatrix4x4
| C++: virtual vtkMatrix4x4 *GetIndexToPhysicalMatrix()
|
| Get the transformation matrix from the index space to the
| physical space coordinate system of the dataset. The transform is
| a 4 by 4 matrix.
|
| GetMaxCellSize(...)
| GetMaxCellSize(self) -> int
| C++: int GetMaxCellSize() override;
|
| Convenience method returns largest cell size in dataset. This is
| generally used to allocate memory for supporting data structures.
| THIS METHOD IS THREAD SAFE
|
| GetMaxSpatialDimension(...)
| GetMaxSpatialDimension(self) -> int
| C++: int GetMaxSpatialDimension() override;
|
| Get the maximum/minimum spatial dimensionality of the data which
| is the maximum/minimum dimension of all cells.
|
| @warning This method MUST be overridden for performance reasons.
| Default implementation is very inefficient.
|
| GetMinSpatialDimension(...)
| GetMinSpatialDimension(self) -> int
| C++: int GetMinSpatialDimension() override;
|
| GetNumberOfCells(...)
| GetNumberOfCells(self) -> int
| C++: vtkIdType GetNumberOfCells() override;
|
| Standard vtkDataSet API methods. See vtkDataSet for more
| information.
| \warning If GetCell(int,int,int) gets overridden in a subclass,
| it is
| necessary to override GetCell(vtkIdType) in that class as well
| since vtkImageData::GetCell(vtkIdType) will always call
| vkImageData::GetCell(int,int,int)
|
| GetNumberOfGenerationsFromBase(...)
| GetNumberOfGenerationsFromBase(self, type:str) -> int
| C++: vtkIdType GetNumberOfGenerationsFromBase(const char *type)
| override;
|
| Given the name of a base class of this class type, return the
| distance of inheritance between this class type and the named
| class (how many generations of inheritance are there between this
| class and the named class). If the named class is not in this
| class's inheritance tree, return a negative value. Valid
| responses will always be nonnegative. This method works in
| combination with vtkTypeMacro found in vtkSetGet.h.
|
| GetNumberOfGenerationsFromBaseType(...)
| GetNumberOfGenerationsFromBaseType(type:str) -> int
| C++: static vtkIdType GetNumberOfGenerationsFromBaseType(
| const char *type)
|
| Given a the name of a base class of this class type, return the
| distance of inheritance between this class type and the named
| class (how many generations of inheritance are there between this
| class and the named class). If the named class is not in this
| class's inheritance tree, return a negative value. Valid
| responses will always be nonnegative. This method works in
| combination with vtkTypeMacro found in vtkSetGet.h.
|
| GetNumberOfPoints(...)
| GetNumberOfPoints(self) -> int
| C++: vtkIdType GetNumberOfPoints() override;
|
| Determine the number of points composing the dataset. THIS METHOD
| IS THREAD SAFE
|
| GetNumberOfScalarComponents(...)
| GetNumberOfScalarComponents(meta_data:vtkInformation) -> int
| C++: static int GetNumberOfScalarComponents(
| vtkInformation *meta_data)
| GetNumberOfScalarComponents(self) -> int
| C++: int GetNumberOfScalarComponents()
|
| GetOrigin(...)
| GetOrigin(self) -> (float, float, float)
| C++: virtual double *GetOrigin()
|
| Set/Get the origin of the dataset. The origin is the position in
| world coordinates of the point of extent (0,0,0). This point does
| not have to be part of the dataset, in other words, the dataset
| extent does not have to start at (0,0,0) and the origin can be
| outside of the dataset bounding box. The origin plus spacing
| determine the position in space of the points.
|
| GetPhysicalToIndexMatrix(...)
| GetPhysicalToIndexMatrix(self) -> vtkMatrix4x4
| C++: virtual vtkMatrix4x4 *GetPhysicalToIndexMatrix()
|
| Get the transformation matrix from the physical space to the
| index space coordinate system of the dataset. The transform is a
| 4 by 4 matrix.
|
| GetPoint(...)
| GetPoint(self, ptId:int) -> (float, float, float)
| C++: double *GetPoint(vtkIdType ptId) override;
| GetPoint(self, id:int, x:[float, float, float]) -> None
| C++: void GetPoint(vtkIdType id, double x[3]) override;
|
| Get point coordinates with ptId such that: 0 <= ptId <
| NumberOfPoints. THIS METHOD IS NOT THREAD SAFE.
|
| GetPointCells(...)
| GetPointCells(self, ptId:int, cellIds:vtkIdList) -> None
| C++: void GetPointCells(vtkIdType ptId, vtkIdList *cellIds)
| override;
|
| Topological inquiry to get cells using point. THIS METHOD IS
| THREAD SAFE IF FIRST CALLED FROM A SINGLE THREAD AND THE DATASET
| IS NOT MODIFIED
|
| GetPointGradient(...)
| GetPointGradient(self, i:int, j:int, k:int, s:vtkDataArray,
| g:[float, float, float]) -> None
| C++: virtual void GetPointGradient(int i, int j, int k,
| vtkDataArray *s, double g[3])
|
| Given structured coordinates (i,j,k) for a point in a structured
| point dataset, compute the gradient vector from the scalar data
| at that point. The scalars s are the scalars from which the
| gradient is to be computed. This method will treat structured
| point datasets of any dimension.
|
| GetPoints(...)
| GetPoints(self) -> vtkPoints
| C++: vtkPoints *GetPoints() override;
|
| If the subclass has (implicit/explicit) points, then return them.
| Otherwise, create a vtkPoints object and return that.
|
| DO NOT MODIFY THE RETURNED POINTS OBJECT.
|
| GetScalarComponentAsDouble(...)
| GetScalarComponentAsDouble(self, x:int, y:int, z:int,
| component:int) -> float
| C++: virtual double GetScalarComponentAsDouble(int x, int y,
| int z, int component)
|
| GetScalarComponentAsFloat(...)
| GetScalarComponentAsFloat(self, x:int, y:int, z:int,
| component:int) -> float
| C++: virtual float GetScalarComponentAsFloat(int x, int y, int z,
| int component)
|
| For access to data from wrappers
|
| GetScalarIndex(...)
| GetScalarIndex(self, coordinates:[int, int, int]) -> int
| C++: virtual vtkIdType GetScalarIndex(int coordinates[3])
| GetScalarIndex(self, x:int, y:int, z:int) -> int
| C++: virtual vtkIdType GetScalarIndex(int x, int y, int z)
|
| GetScalarIndexForExtent(...)
| GetScalarIndexForExtent(self, extent:[int, int, int, int, int,
| int]) -> int
| C++: virtual vtkIdType GetScalarIndexForExtent(int extent[6])
|
| Access the index for the scalar data
|
| GetScalarPointer(...)
| GetScalarPointer(self, coordinates:[int, int, int]) -> Pointer
| C++: virtual void *GetScalarPointer(int coordinates[3])
| GetScalarPointer(self, x:int, y:int, z:int) -> Pointer
| C++: virtual void *GetScalarPointer(int x, int y, int z)
| GetScalarPointer(self) -> Pointer
| C++: virtual void *GetScalarPointer()
|
| GetScalarPointerForExtent(...)
| GetScalarPointerForExtent(self, extent:[int, int, int, int, int,
| int]) -> Pointer
| C++: virtual void *GetScalarPointerForExtent(int extent[6])
|
| Access the native pointer for the scalar data
|
| GetScalarSize(...)
| GetScalarSize(self, meta_data:vtkInformation) -> int
| C++: virtual int GetScalarSize(vtkInformation *meta_data)
| GetScalarSize(self) -> int
| C++: virtual int GetScalarSize()
|
| Get the size of the scalar type in bytes.
|
| GetScalarType(...)
| GetScalarType(meta_data:vtkInformation) -> int
| C++: static int GetScalarType(vtkInformation *meta_data)
| GetScalarType(self) -> int
| C++: int GetScalarType()
|
| GetScalarTypeAsString(...)
| GetScalarTypeAsString(self) -> str
| C++: const char *GetScalarTypeAsString()
|
| GetScalarTypeMax(...)
| GetScalarTypeMax(self, meta_data:vtkInformation) -> float
| C++: virtual double GetScalarTypeMax(vtkInformation *meta_data)
| GetScalarTypeMax(self) -> float
| C++: virtual double GetScalarTypeMax()
|
| GetScalarTypeMin(...)
| GetScalarTypeMin(self, meta_data:vtkInformation) -> float
| C++: virtual double GetScalarTypeMin(vtkInformation *meta_data)
| GetScalarTypeMin(self) -> float
| C++: virtual double GetScalarTypeMin()
|
| These returns the minimum and maximum values the ScalarType can
| hold without overflowing.
|
| GetSpacing(...)
| GetSpacing(self) -> (float, float, float)
| C++: virtual double *GetSpacing()
|
| Set the spacing (width,height,length) of the cubical cells that
| compose the data set.
|
| GetTupleIndex(...)
| GetTupleIndex(self, array:vtkDataArray, coordinates:[int, int,
| int]) -> int
| C++: vtkIdType GetTupleIndex(vtkDataArray *array,
| int coordinates[3])
|
| Given a data array and a coordinate, return the index of the
| tuple in the array corresponding to that coordinate.
|
| This method is analogous to GetArrayPointer(), but it conforms to
| the API of vtkGenericDataArray.
|
| GetVoxelGradient(...)
| GetVoxelGradient(self, i:int, j:int, k:int, s:vtkDataArray,
| g:vtkDataArray) -> None
| C++: virtual void GetVoxelGradient(int i, int j, int k,
| vtkDataArray *s, vtkDataArray *g)
|
| Given structured coordinates (i,j,k) for a voxel cell, compute
| the eight gradient values for the voxel corners. The order in
| which the gradient vectors are arranged corresponds to the
| ordering of the voxel points. Gradient vector is computed by
| central differences (except on edges of volume where forward
| difference is used). The scalars s are the scalars from which the
| gradient is to be computed. This method will treat only 3D
| structured point datasets (i.e., volumes).
|
| HasAnyBlankCells(...)
| HasAnyBlankCells(self) -> bool
| C++: bool HasAnyBlankCells() override;
|
| Returns 1 if there is any visibility constraint on the cells, 0
| otherwise.
|
| HasAnyBlankPoints(...)
| HasAnyBlankPoints(self) -> bool
| C++: bool HasAnyBlankPoints() override;
|
| Returns 1 if there is any visibility constraint on the points, 0
| otherwise.
|
| HasNumberOfScalarComponents(...)
| HasNumberOfScalarComponents(meta_data:vtkInformation) -> bool
| C++: static bool HasNumberOfScalarComponents(
| vtkInformation *meta_data)
|
| HasScalarType(...)
| HasScalarType(meta_data:vtkInformation) -> bool
| C++: static bool HasScalarType(vtkInformation *meta_data)
|
| Initialize(...)
| Initialize(self) -> None
| C++: void Initialize() override;
|
| Restore object to initial state. Release memory back to system.
|
| IsA(...)
| IsA(self, type:str) -> int
| C++: vtkTypeBool IsA(const char *type) override;
|
| Return 1 if this class is the same type of (or a subclass of) the
| named class. Returns 0 otherwise. This method works in
| combination with vtkTypeMacro found in vtkSetGet.h.
|
| IsCellVisible(...)
| IsCellVisible(self, cellId:int) -> int
| C++: unsigned char IsCellVisible(vtkIdType cellId)
|
| Return non-zero value if specified point is visible. These
| methods should be called only after the dimensions of the grid
| are set.
|
| IsPointVisible(...)
| IsPointVisible(self, ptId:int) -> int
| C++: unsigned char IsPointVisible(vtkIdType ptId)
|
| Return non-zero value if specified point is visible. These
| methods should be called only after the dimensions of the grid
| are set.
|
| IsTypeOf(...)
| IsTypeOf(type:str) -> int
| C++: static vtkTypeBool IsTypeOf(const char *type)
|
| Return 1 if this class type is the same type of (or a subclass
| of) the named class. Returns 0 otherwise. This method works in
| combination with vtkTypeMacro found in vtkSetGet.h.
|
| NewInstance(...)
| NewInstance(self) -> vtkImageData
| C++: vtkImageData *NewInstance()
|
| PrepareForNewData(...)
| PrepareForNewData(self) -> None
| C++: void PrepareForNewData() override;
|
| make the output data ready for new data to be inserted. For most
| objects we just call Initialize. But for image data we leave the
| old data in case the memory can be reused.
|
| SafeDownCast(...)
| SafeDownCast(o:vtkObjectBase) -> vtkImageData
| C++: static vtkImageData *SafeDownCast(vtkObjectBase *o)
|
| SetAxisUpdateExtent(...)
| SetAxisUpdateExtent(self, axis:int, min:int, max:int,
| updateExtent:(int, ...), axisUpdateExtent:[int, ...]) -> None
| C++: virtual void SetAxisUpdateExtent(int axis, int min, int max,
| const int *updateExtent, int *axisUpdateExtent)
|
| Set / Get the extent on just one axis
|
| SetDimensions(...)
| SetDimensions(self, i:int, j:int, k:int) -> None
| C++: virtual void SetDimensions(int i, int j, int k)
| SetDimensions(self, dims:(int, int, int)) -> None
| C++: virtual void SetDimensions(const int dims[3])
|
| Same as SetExtent(0, i-1, 0, j-1, 0, k-1)
|
| SetDirectionMatrix(...)
| SetDirectionMatrix(self, m:vtkMatrix3x3) -> None
| C++: virtual void SetDirectionMatrix(vtkMatrix3x3 *m)
| SetDirectionMatrix(self, elements:(float, float, float, float,
| float, float, float, float, float)) -> None
| C++: virtual void SetDirectionMatrix(const double elements[9])
| SetDirectionMatrix(self, e00:float, e01:float, e02:float,
| e10:float, e11:float, e12:float, e20:float, e21:float,
| e22:float) -> None
| C++: virtual void SetDirectionMatrix(double e00, double e01,
| double e02, double e10, double e11, double e12, double e20,
| double e21, double e22)
|
| SetExtent(...)
| SetExtent(self, extent:[int, int, int, int, int, int]) -> None
| C++: virtual void SetExtent(int extent[6])
| SetExtent(self, x1:int, x2:int, y1:int, y2:int, z1:int, z2:int)
| -> None
| C++: virtual void SetExtent(int x1, int x2, int y1, int y2,
| int z1, int z2)
|
| Set/Get the extent. On each axis, the extent is defined by the
| index of the first point and the index of the last point. The
| extent should be set before the "Scalars" are set or allocated.
| The Extent is stored in the order (X, Y, Z). The dataset extent
| does not have to start at (0,0,0). (0,0,0) is just the extent of
| the origin. The first point (the one with Id=0) is at extent
| (Extent[0],Extent[2],Extent[4]). As for any dataset, a data array
| on point data starts at Id=0.
|
| SetNumberOfScalarComponents(...)
| SetNumberOfScalarComponents(n:int, meta_data:vtkInformation)
| -> None
| C++: static void SetNumberOfScalarComponents(int n,
| vtkInformation *meta_data)
|
| Set/Get the number of scalar components for points. As with the
| SetScalarType method this is setting pipeline info.
|
| SetOrigin(...)
| SetOrigin(self, i:float, j:float, k:float) -> None
| C++: virtual void SetOrigin(double i, double j, double k)
| SetOrigin(self, ijk:(float, float, float)) -> None
| C++: virtual void SetOrigin(const double ijk[3])
|
| SetScalarComponentFromDouble(...)
| SetScalarComponentFromDouble(self, x:int, y:int, z:int,
| component:int, v:float) -> None
| C++: virtual void SetScalarComponentFromDouble(int x, int y,
| int z, int component, double v)
|
| SetScalarComponentFromFloat(...)
| SetScalarComponentFromFloat(self, x:int, y:int, z:int,
| component:int, v:float) -> None
| C++: virtual void SetScalarComponentFromFloat(int x, int y, int z,
| int component, float v)
|
| SetScalarType(...)
| SetScalarType(__a:int, meta_data:vtkInformation) -> None
| C++: static void SetScalarType(int, vtkInformation *meta_data)
|
| SetSpacing(...)
| SetSpacing(self, i:float, j:float, k:float) -> None
| C++: virtual void SetSpacing(double i, double j, double k)
| SetSpacing(self, ijk:(float, float, float)) -> None
| C++: virtual void SetSpacing(const double ijk[3])
|
| ShallowCopy(...)
| ShallowCopy(self, src:vtkDataObject) -> None
| C++: void ShallowCopy(vtkDataObject *src) override;
|
| Shallow and Deep copy.
|
| TransformContinuousIndexToPhysicalPoint(...)
| TransformContinuousIndexToPhysicalPoint(self, i:float, j:float,
| k:float, xyz:[float, float, float]) -> None
| C++: virtual void TransformContinuousIndexToPhysicalPoint(
| double i, double j, double k, double xyz[3])
| TransformContinuousIndexToPhysicalPoint(self, ijk:(float, float,
| float), xyz:[float, float, float]) -> None
| C++: virtual void TransformContinuousIndexToPhysicalPoint(
| const double ijk[3], double xyz[3])
| TransformContinuousIndexToPhysicalPoint(i:float, j:float, k:float,
| origin:(float, float, float), spacing:(float, float, float),
| direction:(float, float, float, float, float, float, float,
| float, float), xyz:[float, float, float]) -> None
| C++: static void TransformContinuousIndexToPhysicalPoint(double i,
| double j, double k, double const origin[3],
| double const spacing[3], double const direction[9],
| double xyz[3])
|
| Convert coordinates from index space (ijk) to physical space
| (xyz).
|
| TransformIndexToPhysicalPoint(...)
| TransformIndexToPhysicalPoint(self, i:int, j:int, k:int,
| xyz:[float, float, float]) -> None
| C++: virtual void TransformIndexToPhysicalPoint(int i, int j,
| int k, double xyz[3])
| TransformIndexToPhysicalPoint(self, ijk:(int, int, int),
| xyz:[float, float, float]) -> None
| C++: virtual void TransformIndexToPhysicalPoint(const int ijk[3],
| double xyz[3])
|
| TransformPhysicalNormalToContinuousIndex(...)
| TransformPhysicalNormalToContinuousIndex(self, xyz:(float, float,
| float), ijk:[float, float, float]) -> None
| C++: virtual void TransformPhysicalNormalToContinuousIndex(
| const double xyz[3], double ijk[3])
|
| Convert normal from physical space (xyz) to index space (ijk).
|
| TransformPhysicalPlaneToContinuousIndex(...)
| TransformPhysicalPlaneToContinuousIndex(self, pplane:(float,
| float, float, float), iplane:[float, float, float, float])
| -> None
| C++: virtual void TransformPhysicalPlaneToContinuousIndex(
| double const pplane[4], double iplane[4])
|
| Convert a plane from physical to a continuous index. The plane is
| represented as n(x-xo)=0; or using a four component normal:
| pplane=( nx,ny,nz,-(n(x0)) ).
|
| TransformPhysicalPointToContinuousIndex(...)
| TransformPhysicalPointToContinuousIndex(self, x:float, y:float,
| z:float, ijk:[float, float, float]) -> None
| C++: virtual void TransformPhysicalPointToContinuousIndex(
| double x, double y, double z, double ijk[3])
| TransformPhysicalPointToContinuousIndex(self, xyz:(float, float,
| float), ijk:[float, float, float]) -> None
| C++: virtual void TransformPhysicalPointToContinuousIndex(
| const double xyz[3], double ijk[3])
|
| Convert coordinates from physical space (xyz) to index space
| (ijk).
|
| UnBlankCell(...)
| UnBlankCell(self, ptId:int) -> None
| C++: virtual void UnBlankCell(vtkIdType ptId)
| UnBlankCell(self, i:int, j:int, k:int) -> None
| C++: virtual void UnBlankCell(int i, int j, int k)
|
| UnBlankPoint(...)
| UnBlankPoint(self, ptId:int) -> None
| C++: virtual void UnBlankPoint(vtkIdType ptId)
| UnBlankPoint(self, i:int, j:int, k:int) -> None
| C++: virtual void UnBlankPoint(int i, int j, int k)
|
| __delattr__(self, name, /)
| Implement delattr(self, name).
|
| ----------------------------------------------------------------------
| Data descriptors inherited from vtkmodules.vtkCommonDataModel.vtkImageData:
|
| __this__
| Pointer to the C++ object.
|
| cell_types_array
| read-only, Calls GetCellTypesArray
|
| cells
| read-only, Calls GetCells
|
| data_description
| read-only, Calls GetDataDescription
|
| data_dimension
| read-only, Calls GetDataDimension
|
| data_object_type
| read-only, Calls GetDataObjectType
|
| extent_type
| read-only, Calls GetExtentType
|
| increments
| read-only, Calls GetIncrements
|
| max_cell_size
| read-only, Calls GetMaxCellSize
|
| max_spatial_dimension
| read-only, Calls GetMaxSpatialDimension
|
| min_spatial_dimension
| read-only, Calls GetMinSpatialDimension
|
| number_of_scalar_components
| read-only, Calls GetNumberOfScalarComponents
|
| scalar_pointer
| read-only, Calls GetScalarPointer
|
| scalar_size
| read-only, Calls GetScalarSize
|
| scalar_type
| read-only, Calls GetScalarType
|
| scalar_type_max
| read-only, Calls GetScalarTypeMax
|
| scalar_type_min
| read-only, Calls GetScalarTypeMin
|
| ----------------------------------------------------------------------
| Data and other attributes inherited from vtkmodules.vtkCommonDataModel.vtkImageData:
|
| __vtkname__ = 'vtkImageData'
|
| ----------------------------------------------------------------------
| Methods inherited from vtkmodules.vtkCommonDataModel.vtkDataSet:
|
| AllocateCellGhostArray(...)
| AllocateCellGhostArray(self) -> vtkUnsignedCharArray
| C++: vtkUnsignedCharArray *AllocateCellGhostArray()
|
| Allocate ghost array for cells.
|
| AllocatePointGhostArray(...)
| AllocatePointGhostArray(self) -> vtkUnsignedCharArray
| C++: vtkUnsignedCharArray *AllocatePointGhostArray()
|
| Allocate ghost array for points.
|
| CheckAttributes(...)
| CheckAttributes(self) -> int
| C++: int CheckAttributes()
|
| This method checks to see if the cell and point attributes match
| the geometry. Many filters will crash if the number of tuples in
| an array is less than the number of points/cells. This method
| returns 1 if there is a mismatch, and 0 if everything is ok. It
| prints an error if an array is too short, and a warning if an
| array is too long.
|
| CopyAttributes(...)
| CopyAttributes(self, ds:vtkDataSet) -> None
| C++: virtual void CopyAttributes(vtkDataSet *ds)
|
| Copy the attributes associated with the specified dataset to this
| instance of vtkDataSet. THIS METHOD IS NOT THREAD SAFE.
|
| GenerateGhostArray(...)
| GenerateGhostArray(self, zeroExt:[int, int, int, int, int, int])
| -> None
| C++: virtual void GenerateGhostArray(int zeroExt[6])
| GenerateGhostArray(self, zeroExt:[int, int, int, int, int, int],
| cellOnly:bool) -> None
| C++: virtual void GenerateGhostArray(int zeroExt[6],
| bool cellOnly)
|
| Normally called by pipeline executives or algorithms only. This
| method computes the ghost arrays for a given dataset. The zeroExt
| argument specifies the extent of the region which ghost type = 0.
|
| GetAttributesAsFieldData(...)
| GetAttributesAsFieldData(self, type:int) -> vtkFieldData
| C++: vtkFieldData *GetAttributesAsFieldData(int type) override;
|
| Returns the attributes of the data object as a vtkFieldData. This
| returns non-null values in all the same cases as GetAttributes,
| in addition to the case of FIELD, which will return the field
| data for any vtkDataObject subclass.
|
| GetBounds(...)
| GetBounds(self) -> (float, float, float, float, float, float)
| C++: double *GetBounds()
| GetBounds(self, bounds:[float, float, float, float, float, float])
| -> None
| C++: void GetBounds(double bounds[6])
|
| Return a pointer to the geometry bounding box in the form
| (xmin,xmax, ymin,ymax, zmin,zmax). THIS METHOD IS NOT THREAD
| SAFE.
|
| GetCellData(...)
| GetCellData(self) -> vtkCellData
| C++: vtkCellData *GetCellData()
|
| Return a pointer to this dataset's cell data. THIS METHOD IS
| THREAD SAFE
|
| GetCellGhostArray(...)
| GetCellGhostArray(self) -> vtkUnsignedCharArray
| C++: vtkUnsignedCharArray *GetCellGhostArray()
|
| Get the array that defines the ghost type of each cell. We cache
| the pointer to the array to save a lookup involving string
| comparisons
|
| GetCellNumberOfFaces(...)
| GetCellNumberOfFaces(self, cellId:int, cellType:int,
| cell:vtkGenericCell) -> int
| C++: virtual int GetCellNumberOfFaces(vtkIdType cellId,
| unsigned char &cellType, vtkGenericCell *cell)
|
| Get the number of faces of a cell.
|
| Most of the times extracting the number of faces requires only
| extracting the cell type. However, for some cell types, the
| number of faces is not constant. For example, a convex point set
| cell can have a different number of faces for each cell. That's
| why this method requires the cell id and the dataset.
|
| GetCellTypes(...)
| GetCellTypes(self, types:vtkCellTypes) -> None
| C++: virtual void GetCellTypes(vtkCellTypes *types)
|
| Get a list of types of cells in a dataset. The list consists of
| an array of types (not necessarily in any order), with a single
| entry per type. For example a dataset 5 triangles, 3 lines, and
| 100 hexahedra would result a list of three entries, corresponding
| to the types VTK_TRIANGLE, VTK_LINE, and VTK_HEXAHEDRON. THIS
| METHOD IS THREAD SAFE IF FIRST CALLED FROM A SINGLE THREAD AND
| THE DATASET IS NOT MODIFIED
|
| GetCenter(...)
| GetCenter(self) -> (float, float, float)
| C++: double *GetCenter()
| GetCenter(self, center:[float, float, float]) -> None
| C++: void GetCenter(double center[3])
|
| Get the center of the bounding box. THIS METHOD IS NOT THREAD
| SAFE.
|
| GetGhostArray(...)
| GetGhostArray(self, type:int) -> vtkUnsignedCharArray
| C++: vtkUnsignedCharArray *GetGhostArray(int type) override;
|
| Returns the ghost array for the given type (point or cell). Takes
| advantage of the cache with the pointer to the array to save a
| string comparison.
|
| GetLength(...)
| GetLength(self) -> float
| C++: double GetLength()
|
| Return the length of the diagonal of the bounding box. THIS
| METHOD IS THREAD SAFE IF FIRST CALLED FROM A SINGLE THREAD AND
| THE DATASET IS NOT MODIFIED
|
| GetLength2(...)
| GetLength2(self) -> float
| C++: double GetLength2()
|
| Return the squared length of the diagonal of the bounding box.
| THIS METHOD IS THREAD SAFE IF FIRST CALLED FROM A SINGLE THREAD
| AND THE DATASET IS NOT MODIFIED
|
| GetMTime(...)
| GetMTime(self) -> int
| C++: vtkMTimeType GetMTime() override;
|
| Datasets are composite objects and need to check each part for
| MTime THIS METHOD IS THREAD SAFE
|
| GetMeshMTime(...)
| GetMeshMTime(self) -> int
| C++: virtual vtkMTimeType GetMeshMTime()
|
| Abstract method which return the mesh (geometry/topology)
| modification time. This time is different from the usual MTime
| which also takes into account the modification of data arrays.
| This function can be used to track the changes on the mesh
| separately from the data arrays (eg. static mesh over time with
| transient data). The default implementation returns the MTime. It
| is up to subclasses to provide a better approach.
|
| GetNumberOfElements(...)
| GetNumberOfElements(self, type:int) -> int
| C++: vtkIdType GetNumberOfElements(int type) override;
|
| Get the number of elements for a specific attribute type (POINT,
| CELL, etc.).
|
| GetPointData(...)
| GetPointData(self) -> vtkPointData
| C++: vtkPointData *GetPointData()
|
| Return a pointer to this dataset's point data. THIS METHOD IS
| THREAD SAFE
|
| GetPointGhostArray(...)
| GetPointGhostArray(self) -> vtkUnsignedCharArray
| C++: vtkUnsignedCharArray *GetPointGhostArray()
|
| Gets the array that defines the ghost type of each point. We
| cache the pointer to the array to save a lookup involving string
| comparisons
|
| GetScalarRange(...)
| GetScalarRange(self, range:[float, float]) -> None
| C++: virtual void GetScalarRange(double range[2])
| GetScalarRange(self) -> (float, float)
| C++: double *GetScalarRange()
|
| Convenience method to get the range of the first component (and
| only the first component) of any scalars in the data set. If the
| data has both point data and cell data, it returns the (min/max)
| range of combined point and cell data. If there are no point or
| cell scalars the method will return (0,1). Note: It might be
| necessary to call Update to create or refresh the scalars before
| calling this method. THIS METHOD IS THREAD SAFE IF FIRST CALLED
| FROM A SINGLE THREAD AND THE DATASET IS NOT MODIFIED
|
| HasAnyGhostCells(...)
| HasAnyGhostCells(self) -> bool
| C++: bool HasAnyGhostCells()
|
| Returns 1 if there are any ghost cells 0 otherwise.
|
| HasAnyGhostPoints(...)
| HasAnyGhostPoints(self) -> bool
| C++: bool HasAnyGhostPoints()
|
| Returns 1 if there are any ghost points 0 otherwise.
|
| NewCellIterator(...)
| NewCellIterator(self) -> vtkCellIterator
| C++: virtual vtkCellIterator *NewCellIterator()
|
| Return an iterator that traverses the cells in this data set.
|
| SetCellOrderAndRationalWeights(...)
| SetCellOrderAndRationalWeights(self, cellId:int,
| cell:vtkGenericCell) -> None
| C++: void SetCellOrderAndRationalWeights(vtkIdType cellId,
| vtkGenericCell *cell)
|
| Squeeze(...)
| Squeeze(self) -> None
| C++: virtual void Squeeze()
|
| Reclaim any extra memory used to store data. THIS METHOD IS NOT
| THREAD SAFE.
|
| SupportsGhostArray(...)
| SupportsGhostArray(self, type:int) -> bool
| C++: bool SupportsGhostArray(int type) override;
|
| Returns true for POINT or CELL, false otherwise
|
| ----------------------------------------------------------------------
| Data descriptors inherited from vtkmodules.vtkCommonDataModel.vtkDataSet:
|
| cell_ghost_array
| read-only, Calls GetCellGhostArray
|
| length2
| read-only, Calls GetLength2
|
| m_time
| read-only, Calls GetMTime
|
| mesh_m_time
| read-only, Calls GetMeshMTime
|
| point_ghost_array
| read-only, Calls GetPointGhostArray
|
| scalar_range
| read-only, Calls GetScalarRange
|
| ----------------------------------------------------------------------
| Data and other attributes inherited from vtkmodules.vtkCommonDataModel.vtkDataSet:
|
| CELL_DATA_FIELD = 2
|
| DATA_OBJECT_FIELD = 0
|
| FieldDataType = <class 'vtkmodules.vtkCommonDataModel.vtkDataSet.Field...
|
| POINT_DATA_FIELD = 1
|
| ----------------------------------------------------------------------
| Methods inherited from vtkmodules.vtkCommonDataModel.vtkDataObject:
|
| ALL_PIECES_EXTENT(...)
| ALL_PIECES_EXTENT() -> vtkInformationIntegerVectorKey
| C++: static vtkInformationIntegerVectorKey *ALL_PIECES_EXTENT()
|
| \ingroup InformationKeys
|
| BOUNDING_BOX(...)
| BOUNDING_BOX() -> vtkInformationDoubleVectorKey
| C++: static vtkInformationDoubleVectorKey *BOUNDING_BOX()
|
| \ingroup InformationKeys
|
| CELL_DATA_VECTOR(...)
| CELL_DATA_VECTOR() -> vtkInformationInformationVectorKey
| C++: static vtkInformationInformationVectorKey *CELL_DATA_VECTOR()
|
| \ingroup InformationKeys
|
| DATA_EXTENT(...)
| DATA_EXTENT() -> vtkInformationIntegerPointerKey
| C++: static vtkInformationIntegerPointerKey *DATA_EXTENT()
|
| \ingroup InformationKeys
|
| DATA_EXTENT_TYPE(...)
| DATA_EXTENT_TYPE() -> vtkInformationIntegerKey
| C++: static vtkInformationIntegerKey *DATA_EXTENT_TYPE()
|
| \ingroup InformationKeys
|
| DATA_NUMBER_OF_GHOST_LEVELS(...)
| DATA_NUMBER_OF_GHOST_LEVELS() -> vtkInformationIntegerKey
| C++: static vtkInformationIntegerKey *DATA_NUMBER_OF_GHOST_LEVELS(
| )
|
| \ingroup InformationKeys
|
| DATA_NUMBER_OF_PIECES(...)
| DATA_NUMBER_OF_PIECES() -> vtkInformationIntegerKey
| C++: static vtkInformationIntegerKey *DATA_NUMBER_OF_PIECES()
|
| \ingroup InformationKeys
|
| DATA_OBJECT(...)
| DATA_OBJECT() -> vtkInformationDataObjectKey
| C++: static vtkInformationDataObjectKey *DATA_OBJECT()
|
| \ingroup InformationKeys
|
| DATA_PIECE_NUMBER(...)
| DATA_PIECE_NUMBER() -> vtkInformationIntegerKey
| C++: static vtkInformationIntegerKey *DATA_PIECE_NUMBER()
|
| \ingroup InformationKeys
|
| DATA_TIME_STEP(...)
| DATA_TIME_STEP() -> vtkInformationDoubleKey
| C++: static vtkInformationDoubleKey *DATA_TIME_STEP()
|
| \ingroup InformationKeys
|
| DATA_TYPE_NAME(...)
| DATA_TYPE_NAME() -> vtkInformationStringKey
| C++: static vtkInformationStringKey *DATA_TYPE_NAME()
|
| \ingroup InformationKeys
|
| DIRECTION(...)
| DIRECTION() -> vtkInformationDoubleVectorKey
| C++: static vtkInformationDoubleVectorKey *DIRECTION()
|
| \ingroup InformationKeys
|
| DataHasBeenGenerated(...)
| DataHasBeenGenerated(self) -> None
| C++: void DataHasBeenGenerated()
|
| This method is called by the source when it executes to generate
| data. It is sort of the opposite of ReleaseData. It sets the
| DataReleased flag to 0, and sets a new UpdateTime.
|
| EDGE_DATA_VECTOR(...)
| EDGE_DATA_VECTOR() -> vtkInformationInformationVectorKey
| C++: static vtkInformationInformationVectorKey *EDGE_DATA_VECTOR()
|
| \ingroup InformationKeys
|
| FIELD_ACTIVE_ATTRIBUTE(...)
| FIELD_ACTIVE_ATTRIBUTE() -> vtkInformationIntegerKey
| C++: static vtkInformationIntegerKey *FIELD_ACTIVE_ATTRIBUTE()
|
| \ingroup InformationKeys
|
| FIELD_ARRAY_TYPE(...)
| FIELD_ARRAY_TYPE() -> vtkInformationIntegerKey
| C++: static vtkInformationIntegerKey *FIELD_ARRAY_TYPE()
|
| \ingroup InformationKeys
|
| FIELD_ASSOCIATION(...)
| FIELD_ASSOCIATION() -> vtkInformationIntegerKey
| C++: static vtkInformationIntegerKey *FIELD_ASSOCIATION()
|
| \ingroup InformationKeys
|
| FIELD_ATTRIBUTE_TYPE(...)
| FIELD_ATTRIBUTE_TYPE() -> vtkInformationIntegerKey
| C++: static vtkInformationIntegerKey *FIELD_ATTRIBUTE_TYPE()
|
| \ingroup InformationKeys
|
| FIELD_NAME(...)
| FIELD_NAME() -> vtkInformationStringKey
| C++: static vtkInformationStringKey *FIELD_NAME()
|
| \ingroup InformationKeys
|
| FIELD_NUMBER_OF_COMPONENTS(...)
| FIELD_NUMBER_OF_COMPONENTS() -> vtkInformationIntegerKey
| C++: static vtkInformationIntegerKey *FIELD_NUMBER_OF_COMPONENTS()
|
| \ingroup InformationKeys
|
| FIELD_NUMBER_OF_TUPLES(...)
| FIELD_NUMBER_OF_TUPLES() -> vtkInformationIntegerKey
| C++: static vtkInformationIntegerKey *FIELD_NUMBER_OF_TUPLES()
|
| \ingroup InformationKeys
|
| FIELD_OPERATION(...)
| FIELD_OPERATION() -> vtkInformationIntegerKey
| C++: static vtkInformationIntegerKey *FIELD_OPERATION()
|
| \ingroup InformationKeys
|
| FIELD_RANGE(...)
| FIELD_RANGE() -> vtkInformationDoubleVectorKey
| C++: static vtkInformationDoubleVectorKey *FIELD_RANGE()
|
| \ingroup InformationKeys
|
| GetActiveFieldInformation(...)
| GetActiveFieldInformation(info:vtkInformation,
| fieldAssociation:int, attributeType:int) -> vtkInformation
| C++: static vtkInformation *GetActiveFieldInformation(
| vtkInformation *info, int fieldAssociation, int attributeType)
|
| Return the information object within the input information
| object's field data corresponding to the specified association
| (FIELD_ASSOCIATION_POINTS or FIELD_ASSOCIATION_CELLS) and
| attribute (SCALARS, VECTORS, NORMALS, TCOORDS, or TENSORS)
|
| GetAssociationTypeAsString(...)
| GetAssociationTypeAsString(associationType:int) -> str
| C++: static const char *GetAssociationTypeAsString(
| int associationType)
|
| Given an integer association type, this static method returns a
| string type for the attribute (i.e. associationType = 0: returns
| "Points").
|
| GetAssociationTypeFromString(...)
| GetAssociationTypeFromString(associationName:str) -> int
| C++: static int GetAssociationTypeFromString(
| const char *associationName)
|
| Given a string association name, this static method returns an
| integer association type for the attribute (i.e. associationName
| = "Points": returns 0).
|
| GetAttributeTypeForArray(...)
| GetAttributeTypeForArray(self, arr:vtkAbstractArray) -> int
| C++: virtual int GetAttributeTypeForArray(vtkAbstractArray *arr)
|
| Retrieves the attribute type that an array came from. This is
| useful for obtaining which attribute type a input array to an
| algorithm came from (retrieved from
| GetInputAbstractArrayToProcesss).
|
| GetAttributes(...)
| GetAttributes(self, type:int) -> vtkDataSetAttributes
| C++: virtual vtkDataSetAttributes *GetAttributes(int type)
|
| Returns the attributes of the data object of the specified
| attribute type. The type may be: POINT - Defined in vtkDataSet
| subclasses. CELL - Defined in vtkDataSet subclasses. VERTEX -
| Defined in vtkGraph subclasses. EDGE - Defined in vtkGraph
| subclasses. ROW - Defined in vtkTable. The other attribute
| type, FIELD, will return nullptr since field data is stored as a
| vtkFieldData instance, not a vtkDataSetAttributes instance. To
| retrieve field data, use GetAttributesAsFieldData.
|
| @warning This method NEEDS to be
| overridden in subclasses to work as documented. If not, it
| returns nullptr for any type but FIELD.
|
| GetDataReleased(...)
| GetDataReleased(self) -> int
| C++: virtual vtkTypeBool GetDataReleased()
|
| Get the flag indicating the data has been released.
|
| GetFieldData(...)
| GetFieldData(self) -> vtkFieldData
| C++: virtual vtkFieldData *GetFieldData()
|
| GetGlobalReleaseDataFlag(...)
| GetGlobalReleaseDataFlag() -> int
| C++: static vtkTypeBool GetGlobalReleaseDataFlag()
|
| GetInformation(...)
| GetInformation(self) -> vtkInformation
| C++: virtual vtkInformation *GetInformation()
|
| Set/Get the information object associated with this data object.
|
| GetNamedFieldInformation(...)
| GetNamedFieldInformation(info:vtkInformation,
| fieldAssociation:int, name:str) -> vtkInformation
| C++: static vtkInformation *GetNamedFieldInformation(
| vtkInformation *info, int fieldAssociation, const char *name)
|
| Return the information object within the input information
| object's field data corresponding to the specified association
| (FIELD_ASSOCIATION_POINTS or FIELD_ASSOCIATION_CELLS) and name.
|
| GetUpdateTime(...)
| GetUpdateTime(self) -> int
| C++: vtkMTimeType GetUpdateTime()
|
| Used by Threaded ports to determine if they should initiate an
| asynchronous update (still in development).
|
| GlobalReleaseDataFlagOff(...)
| GlobalReleaseDataFlagOff(self) -> None
| C++: void GlobalReleaseDataFlagOff()
|
| GlobalReleaseDataFlagOn(...)
| GlobalReleaseDataFlagOn(self) -> None
| C++: void GlobalReleaseDataFlagOn()
|
| ORIGIN(...)
| ORIGIN() -> vtkInformationDoubleVectorKey
| C++: static vtkInformationDoubleVectorKey *ORIGIN()
|
| \ingroup InformationKeys
|
| PIECE_EXTENT(...)
| PIECE_EXTENT() -> vtkInformationIntegerVectorKey
| C++: static vtkInformationIntegerVectorKey *PIECE_EXTENT()
|
| \ingroup InformationKeys
|
| POINT_DATA_VECTOR(...)
| POINT_DATA_VECTOR() -> vtkInformationInformationVectorKey
| C++: static vtkInformationInformationVectorKey *POINT_DATA_VECTOR(
| )
|
| \ingroup InformationKeys
|
| ReleaseData(...)
| ReleaseData(self) -> None
| C++: void ReleaseData()
|
| Release data back to system to conserve memory resource. Used
| during visualization network execution. Releasing this data does
| not make down-stream data invalid.
|
| RemoveNamedFieldInformation(...)
| RemoveNamedFieldInformation(info:vtkInformation,
| fieldAssociation:int, name:str) -> None
| C++: static void RemoveNamedFieldInformation(vtkInformation *info,
| int fieldAssociation, const char *name)
|
| Remove the info associated with an array
|
| SIL(...)
| SIL() -> vtkInformationDataObjectKey
| C++: static vtkInformationDataObjectKey *SIL()
|
| \ingroup InformationKeys
|
| SPACING(...)
| SPACING() -> vtkInformationDoubleVectorKey
| C++: static vtkInformationDoubleVectorKey *SPACING()
|
| \ingroup InformationKeys
|
| SetActiveAttribute(...)
| SetActiveAttribute(info:vtkInformation, fieldAssociation:int,
| attributeName:str, attributeType:int) -> vtkInformation
| C++: static vtkInformation *SetActiveAttribute(
| vtkInformation *info, int fieldAssociation,
| const char *attributeName, int attributeType)
|
| Set the named array to be the active field for the specified type
| (SCALARS, VECTORS, NORMALS, TCOORDS, or TENSORS) and association
| (FIELD_ASSOCIATION_POINTS or FIELD_ASSOCIATION_CELLS). Returns
| the active field information object and creates on entry if one
| not found.
|
| SetActiveAttributeInfo(...)
| SetActiveAttributeInfo(info:vtkInformation, fieldAssociation:int,
| attributeType:int, name:str, arrayType:int, numComponents:int,
| numTuples:int) -> None
| C++: static void SetActiveAttributeInfo(vtkInformation *info,
| int fieldAssociation, int attributeType, const char *name,
| int arrayType, int numComponents, int numTuples)
|
| Set the name, array type, number of components, and number of
| tuples within the passed information object for the active
| attribute of type attributeType (in specified association,
| FIELD_ASSOCIATION_POINTS or FIELD_ASSOCIATION_CELLS). If there
| is not an active attribute of the specified type, an entry in the
| information object is created. If arrayType, numComponents, or
| numTuples equal to -1, or name=nullptr the value is not changed.
|
| SetFieldData(...)
| SetFieldData(self, __a:vtkFieldData) -> None
| C++: virtual void SetFieldData(vtkFieldData *)
|
| Assign or retrieve a general field data to this data object.
|
| SetGlobalReleaseDataFlag(...)
| SetGlobalReleaseDataFlag(val:int) -> None
| C++: static void SetGlobalReleaseDataFlag(vtkTypeBool val)
|
| Turn on/off flag to control whether every object releases its
| data after being used by a filter.
|
| SetInformation(...)
| SetInformation(self, __a:vtkInformation) -> None
| C++: virtual void SetInformation(vtkInformation *)
|
| SetPointDataActiveScalarInfo(...)
| SetPointDataActiveScalarInfo(info:vtkInformation, arrayType:int,
| numComponents:int) -> None
| C++: static void SetPointDataActiveScalarInfo(
| vtkInformation *info, int arrayType, int numComponents)
|
| Convenience version of previous method for use (primarily) by the
| Imaging filters. If arrayType or numComponents == -1, the value
| is not changed.
|
| VERTEX_DATA_VECTOR(...)
| VERTEX_DATA_VECTOR() -> vtkInformationInformationVectorKey
| C++: static vtkInformationInformationVectorKey *VERTEX_DATA_VECTOR(
| )
|
| \ingroup InformationKeys
|
| __rrshift__(self, value, /)
| Return value>>self.
|
| __rshift__(self, value, /)
| Return self>>value.
|
| ----------------------------------------------------------------------
| Data descriptors inherited from vtkmodules.vtkCommonDataModel.vtkDataObject:
|
| data_released
| read-only, Calls GetDataReleased
|
| global_release_data_flag
| read-write, Calls GetGlobalReleaseDataFlag/SetGlobalReleaseDataFlag
|
| information
| read-write, Calls GetInformation/SetInformation
|
| update_time
| read-only, Calls GetUpdateTime
|
| ----------------------------------------------------------------------
| Data and other attributes inherited from vtkmodules.vtkCommonDataModel.vtkDataObject:
|
| AttributeTypes = <class 'vtkmodules.vtkCommonDataModel.vtkDataObject.A...
|
| CELL = 1
|
| EDGE = 5
|
| FIELD = 2
|
| FIELD_ASSOCIATION_CELLS = 1
|
| FIELD_ASSOCIATION_EDGES = 5
|
| FIELD_ASSOCIATION_NONE = 2
|
| FIELD_ASSOCIATION_POINTS = 0
|
| FIELD_ASSOCIATION_POINTS_THEN_CELLS = 3
|
| FIELD_ASSOCIATION_ROWS = 6
|
| FIELD_ASSOCIATION_VERTICES = 4
|
| FIELD_OPERATION_MODIFIED = 2
|
| FIELD_OPERATION_PRESERVED = 0
|
| FIELD_OPERATION_REINTERPOLATED = 1
|
| FIELD_OPERATION_REMOVED = 3
|
| FieldAssociations = <class 'vtkmodules.vtkCommonDataModel.vtkDataObjec...
|
| FieldOperations = <class 'vtkmodules.vtkCommonDataModel.vtkDataObject....
|
| NUMBER_OF_ASSOCIATIONS = 7
|
| NUMBER_OF_ATTRIBUTE_TYPES = 7
|
| POINT = 0
|
| POINT_THEN_CELL = 3
|
| ROW = 6
|
| VERTEX = 4
|
| ----------------------------------------------------------------------
| Methods inherited from vtkmodules.vtkCommonCore.vtkObject:
|
| AddObserver(...)
| AddObserver(self, event:int, command:Callback, priority:float=0.0) -> int
| C++: unsigned long AddObserver(const char* event,
| vtkCommand* command, float priority=0.0f)
|
| Add an event callback command(o:vtkObject, event:int) for an event type.
| Returns a handle that can be used with RemoveEvent(event:int).
|
| BreakOnError(...)
| BreakOnError() -> None
| C++: static void BreakOnError()
|
| This method is called when vtkErrorMacro executes. It allows the
| debugger to break on error.
|
| DebugOff(...)
| DebugOff(self) -> None
| C++: virtual void DebugOff()
|
| Turn debugging output off.
|
| DebugOn(...)
| DebugOn(self) -> None
| C++: virtual void DebugOn()
|
| Turn debugging output on.
|
| GetCommand(...)
| GetCommand(self, tag:int) -> vtkCommand
| C++: vtkCommand *GetCommand(unsigned long tag)
|
| GetDebug(...)
| GetDebug(self) -> bool
| C++: bool GetDebug()
|
| Get the value of the debug flag.
|
| GetGlobalWarningDisplay(...)
| GetGlobalWarningDisplay() -> int
| C++: static vtkTypeBool GetGlobalWarningDisplay()
|
| GetObjectDescription(...)
| GetObjectDescription(self) -> str
| C++: std::string GetObjectDescription() override;
|
| The object description printed in messages and PrintSelf output.
| To be used only for reporting purposes.
|
| GetObjectName(...)
| GetObjectName(self) -> str
| C++: virtual std::string GetObjectName()
|
| GlobalWarningDisplayOff(...)
| GlobalWarningDisplayOff() -> None
| C++: static void GlobalWarningDisplayOff()
|
| GlobalWarningDisplayOn(...)
| GlobalWarningDisplayOn() -> None
| C++: static void GlobalWarningDisplayOn()
|
| HasObserver(...)
| HasObserver(self, event:int, __b:vtkCommand) -> int
| C++: vtkTypeBool HasObserver(unsigned long event, vtkCommand *)
| HasObserver(self, event:str, __b:vtkCommand) -> int
| C++: vtkTypeBool HasObserver(const char *event, vtkCommand *)
| HasObserver(self, event:int) -> int
| C++: vtkTypeBool HasObserver(unsigned long event)
| HasObserver(self, event:str) -> int
| C++: vtkTypeBool HasObserver(const char *event)
|
| InvokeEvent(...)
| InvokeEvent(self, event:int, callData:Any) -> int
| C++: int InvokeEvent(unsigned long event, void* callData)
| InvokeEvent(self, event:str, callData:Any) -> int
| C++: int InvokeEvent(const char* event, void* callData)
| InvokeEvent(self, event:int) -> int
| C++: int InvokeEvent(unsigned long event)
| InvokeEvent(self, event:str) -> int
| C++: int InvokeEvent(const char* event)
|
| This method invokes an event and returns whether the event was
| aborted or not. If the event was aborted, the return value is 1,
| otherwise it is 0.
|
| Modified(...)
| Modified(self) -> None
| C++: virtual void Modified()
|
| Update the modification time for this object. Many filters rely
| on the modification time to determine if they need to recompute
| their data. The modification time is a unique monotonically
| increasing unsigned long integer.
|
| RemoveAllObservers(...)
| RemoveAllObservers(self) -> None
| C++: void RemoveAllObservers()
|
| RemoveObserver(...)
| RemoveObserver(self, __a:vtkCommand) -> None
| C++: void RemoveObserver(vtkCommand *)
| RemoveObserver(self, tag:int) -> None
| C++: void RemoveObserver(unsigned long tag)
|
| RemoveObservers(...)
| RemoveObservers(self, event:int, __b:vtkCommand) -> None
| C++: void RemoveObservers(unsigned long event, vtkCommand *)
| RemoveObservers(self, event:str, __b:vtkCommand) -> None
| C++: void RemoveObservers(const char *event, vtkCommand *)
| RemoveObservers(self, event:int) -> None
| C++: void RemoveObservers(unsigned long event)
| RemoveObservers(self, event:str) -> None
| C++: void RemoveObservers(const char *event)
|
| SetDebug(...)
| SetDebug(self, debugFlag:bool) -> None
| C++: void SetDebug(bool debugFlag)
|
| Set the value of the debug flag. A true value turns debugging on.
|
| SetGlobalWarningDisplay(...)
| SetGlobalWarningDisplay(val:int) -> None
| C++: static void SetGlobalWarningDisplay(vtkTypeBool val)
|
| This is a global flag that controls whether any debug, warning or
| error messages are displayed.
|
| SetObjectName(...)
| SetObjectName(self, objectName:str) -> None
| C++: virtual void SetObjectName(const std::string &objectName)
|
| Set/get the name of this object for reporting purposes. The name
| appears in warning and debug messages and in the Print output.
| Setting the object name does not change the MTime and does not
| invoke a ModifiedEvent. Derived classes implementing copying
| methods are expected not to copy the ObjectName.
|
| ----------------------------------------------------------------------
| Data descriptors inherited from vtkmodules.vtkCommonCore.vtkObject:
|
| debug
| read-write, Calls GetDebug/SetDebug
|
| global_warning_display
| read-write, Calls GetGlobalWarningDisplay/SetGlobalWarningDisplay
|
| object_description
| read-only, Calls GetObjectDescription
|
| object_name
| read-write, Calls GetObjectName/SetObjectName
|
| ----------------------------------------------------------------------
| Methods inherited from vtkmodules.vtkCommonCore.vtkObjectBase:
|
| FastDelete(...)
| FastDelete(self) -> None
| C++: virtual void FastDelete()
|
| Delete a reference to this object. This version will not invoke
| garbage collection and can potentially leak the object if it is
| part of a reference loop. Use this method only when it is known
| that the object has another reference and would not be collected
| if a full garbage collection check were done.
|
| GetAddressAsString(...)
| GetAddressAsString(self, classname:str) -> str
|
| Get address of C++ object in format 'Addr=%p' after casting to
| the specified type. This method is obsolete, you can get the
| same information from o.__this__.
|
| GetClassName(...)
| GetClassName(self) -> str
| C++: const char *GetClassName()
|
| Return the class name as a string.
|
| GetIsInMemkind(...)
| GetIsInMemkind(self) -> bool
| C++: bool GetIsInMemkind()
|
| A local state flag that remembers whether this object lives in
| the normal or extended memory space.
|
| GetReferenceCount(...)
| GetReferenceCount(self) -> int
| C++: int GetReferenceCount()
|
| Return the current reference count of this object.
|
| GetUsingMemkind(...)
| GetUsingMemkind() -> bool
| C++: static bool GetUsingMemkind()
|
| A global state flag that controls whether vtkObjects are
| constructed in the usual way (the default) or within the extended
| memory space.
|
| InitializeObjectBase(...)
| InitializeObjectBase(self) -> None
| C++: void InitializeObjectBase()
|
| Register(...)
| Register(self, o:vtkObjectBase)
| C++: virtual void Register(vtkObjectBase *o)
|
| Increase the reference count by 1.
|
| SetMemkindDirectory(...)
| SetMemkindDirectory(directoryname:str) -> None
| C++: static void SetMemkindDirectory(const char *directoryname)
|
| The name of a directory, ideally mounted -o dax, to memory map an
| extended memory space within. This must be called before any
| objects are constructed in the extended space. It can not be
| changed once setup.
|
| SetReferenceCount(...)
| SetReferenceCount(self, __a:int) -> None
| C++: void SetReferenceCount(int)
|
| Sets the reference count. (This is very dangerous, use with
| care.)
|
| UnRegister(...)
| UnRegister(self, o:vtkObjectBase)
| C++: virtual void UnRegister(vtkObjectBase* o)
|
| Decrease the reference count (release by another object). This
| has the same effect as invoking Delete() (i.e., it reduces the
| reference count by 1).
|
| UsesGarbageCollector(...)
| UsesGarbageCollector(self) -> bool
| C++: virtual bool UsesGarbageCollector()
|
| Indicate whether the class uses `vtkGarbageCollector` or not.
|
| Most classes will not need to do this, but if the class
| participates in a strongly-connected reference count cycle,
| participation can resolve these cycles.
|
| If overriding this method to return true, the `ReportReferences`
| method should be overridden to report references that may be in
| cycles.
|
| ----------------------------------------------------------------------
| Class methods inherited from vtkmodules.vtkCommonCore.vtkObjectBase:
|
| override(...)
| This method can be used to override a VTK class with a Python subclass.
| The class type passed to override will afterwards be instantiated
| instead of the type override is called on.
| For example,
|
| class foo(vtk.vtkPoints):
| pass
| vtk.vtkPoints.override(foo)
|
| will lead to foo being instantied every time vtkPoints() is called.
| The main objective of this functionality is to enable developers to
| extend VTK classes with more pythonic subclasses that contain
| convenience functionality.
|
| ----------------------------------------------------------------------
| Data descriptors inherited from vtkmodules.vtkCommonCore.vtkObjectBase:
|
| class_name
| read-only, Calls GetClassName
|
| is_in_memkind
| read-only, Calls GetIsInMemkind
|
| memkind_directory
| write-only, Calls SetMemkindDirectory
|
| reference_count
| read-write, Calls GetReferenceCount/SetReferenceCount
|
| using_memkind
| read-only, Calls GetUsingMemkind
numpy.random.random() を使って3Dデータを生成します.ここでは,ご自分の3D numpy配列を自由に使ってください.
arr = np.random.random((100, 100, 100))
arr.shape
(100, 100, 100)
クラス :pyvista.ImageData を作成します.
注釈
おそらく Fortran-ordering で配列を ravel する必要があります: arr.ravel(order="F") とします.
vol = pv.ImageData()
vol.dimensions = arr.shape
vol["array"] = arr.ravel(order="F")
ImageDataのプロット
vol.plot()
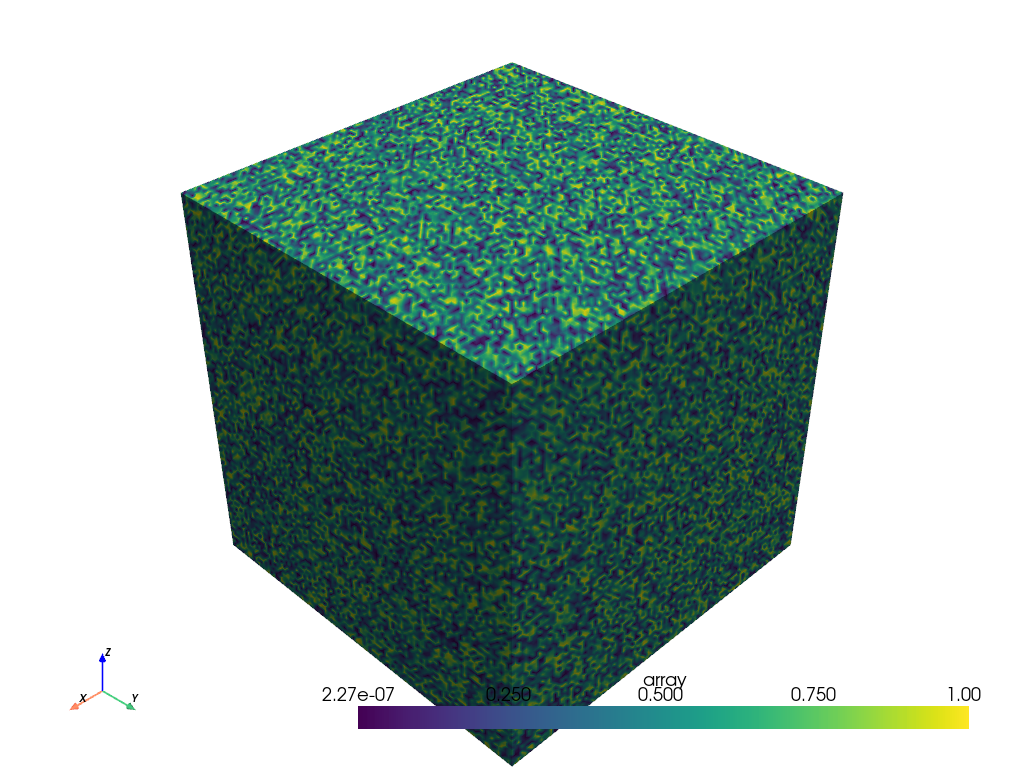
例#
PyVista には ImageData を使う例がいくつかあります.
ボリュームレンダリング の詳細については,PyVistaのドキュメントを参照してください
以下にデータセットの例を挙げます:
from pyvista import examples

vol = examples.download_knee_full()

pl = pv.Plotter()
pl.add_volume(vol, cmap="bone", opacity="sigmoid")
pl.show()
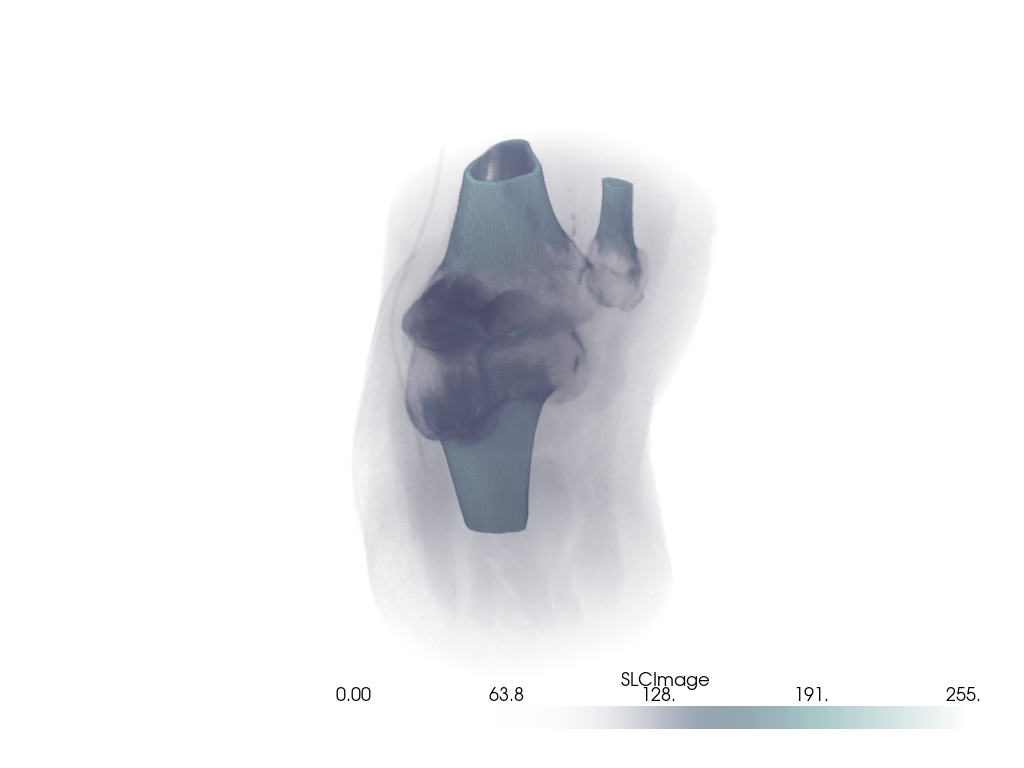
vol = pv.Wavelet()
vol.plot(volume=True)
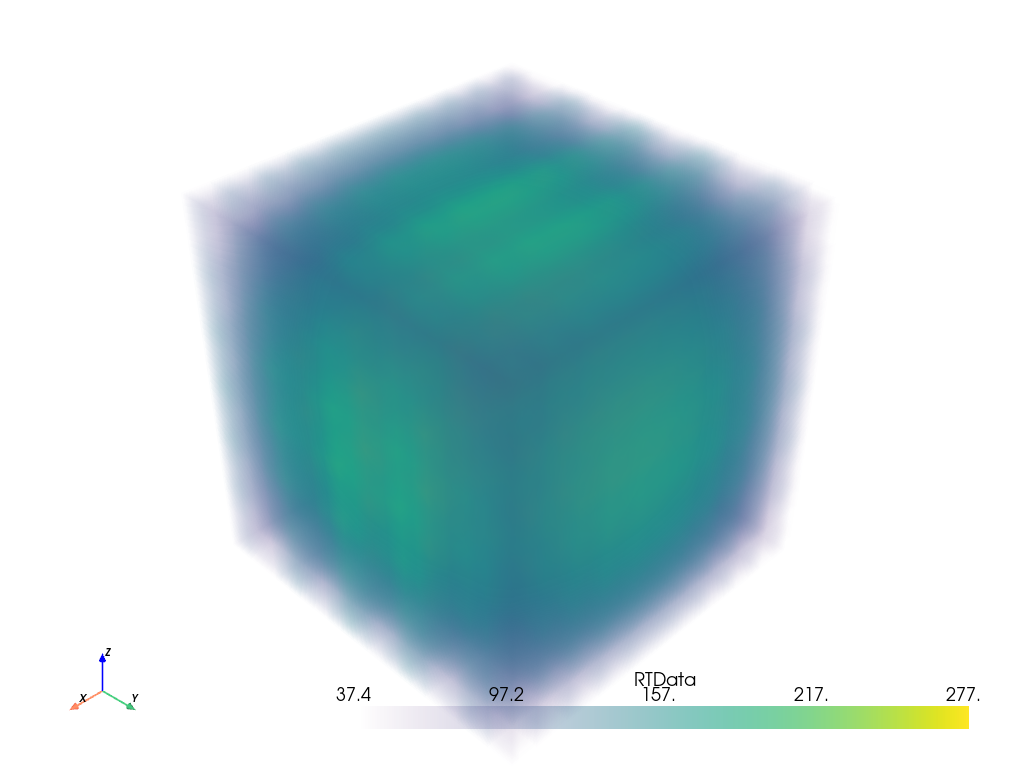
Total running time of the script: (0 minutes 6.028 seconds)