注釈
完全なサンプルコードをダウンロードしたり、Binderを使ってブラウザでこのサンプルを実行するには、 最後に進んでください 。
基本的な幾何学的オブジェクトを作成します#
これは,PyVistaの "Hello, world!" です.
import pyvista as pv
これは,VTKで利用可能ないくつかのジオメトリックオブジェクトを介して実行され,PyVistaは生成するための簡単で便利なメソッドを提供します.
ジオメトリオブジェクトをいくつか作成してみましょう!
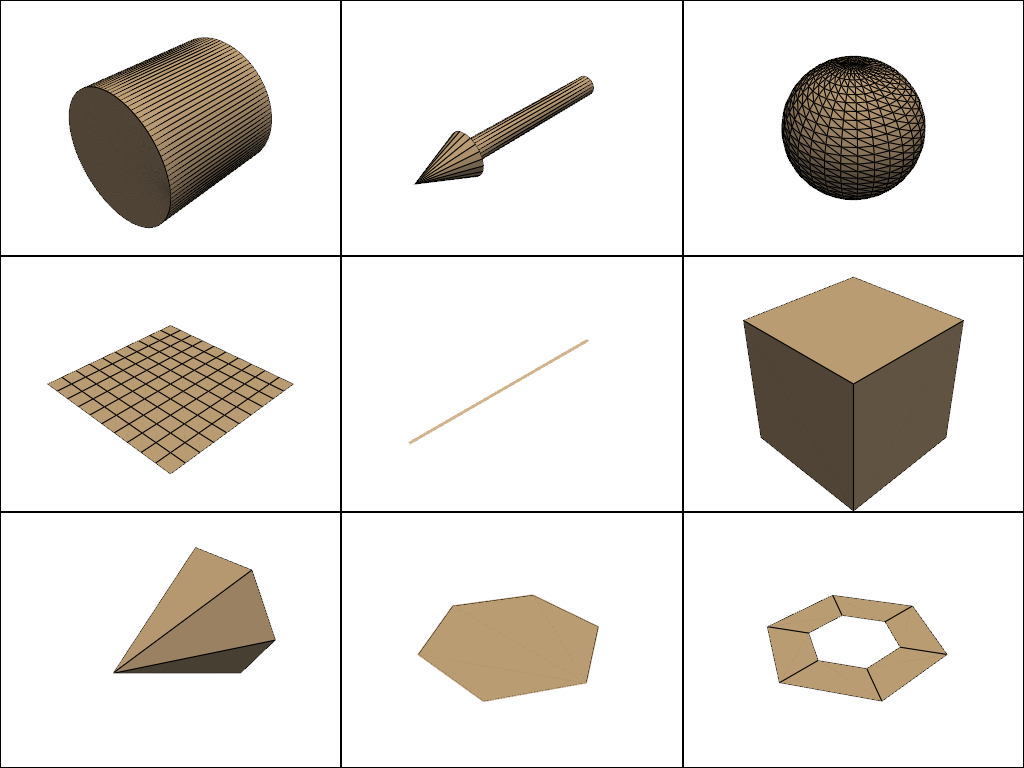
ここで,すべてを1つのウィンドウにプロットします.
pl = pv.Plotter(shape=(3, 3))
# Top row
pl.subplot(0, 0)
pl.add_mesh(cyl, color="tan", show_edges=True)
pl.subplot(0, 1)
pl.add_mesh(arrow, color="tan", show_edges=True)
pl.subplot(0, 2)
pl.add_mesh(sphere, color="tan", show_edges=True)
# Middle row
pl.subplot(1, 0)
pl.add_mesh(plane, color="tan", show_edges=True)
pl.subplot(1, 1)
pl.add_mesh(line, color="tan", line_width=3)
pl.subplot(1, 2)
pl.add_mesh(box, color="tan", show_edges=True)
# Bottom row
pl.subplot(2, 0)
pl.add_mesh(cone, color="tan", show_edges=True)
pl.subplot(2, 1)
pl.add_mesh(poly, color="tan", show_edges=True)
pl.subplot(2, 2)
pl.add_mesh(disc, color="tan", show_edges=True)
# Render all of them
pl.show()
# Export this plotter as an interactive scene to a HTML file.
# p.export_html("a_basic.html")
Total running time of the script: (0 minutes 3.045 seconds)