プロットオプションとアニメーション#
PyVistaプロッティングAPIの多くの機能を使って,説得力のある3Dビジュアリゼーションとタッチオンアニメーションを作成するデモを行います(講演10分,演習10分)
Tip
このチュートリアルのセクションは PyVista's Example Gallery のプロットセクションから採用されたものです.
PyVistaは,3Dデータの表示方法を変更するための様々な可能性を提供します.
Matplotlibのカラーマップを用いたスカラー値のカラーマッピング異なる種類のメッシュのエッジとノードの表示
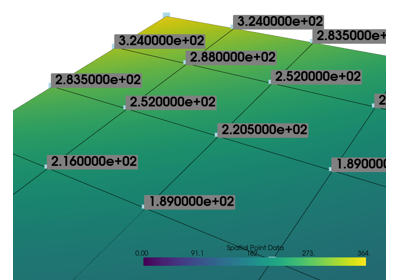
メッシュの横にある3D空間のポイントにラベルを貼ることができる
並列比較の作成
データセットを透明にする,またはスカラー値を使用して不透明度をマップします
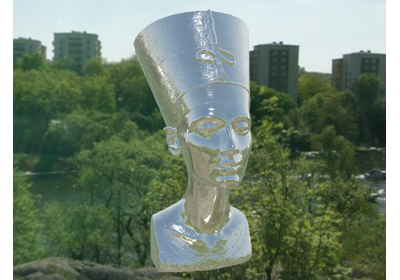
メッシュ上にまとったテクスチャ/イメージを追加する(テクスチャマッピング)
スムースシェーディングやアイドームライティングなどの洗練されたライティングテクニックを使用する
GIFまたはムービーファイルとしてアニメーションを作成します
このセクションでは,PyVista の pyvista.Plotter API の概要と,これらのタスクの実行方法について説明します.このレッスンのゴールは,PyVistaのプロットAPIの包括的な概要ではなく,それがどのように動作し,どのように使えばいいのかを示すことです!このレッスンは,PyVistaのプロットAPIがどのように動作するかを説明します.
基礎編#
PyVistaのプロットAPIはデータセントリックで,3DデータはMatplotlibライクな方法で表示パラメータを変えて個別にシーンに追加されます.
Plotterオブジェクトにメッシュを追加する#
プロットする場合,ユーザーはまず pyvista.Plotter のインスタンスを作成する必要があります(Matplotlib の図形のようなものです).それから, pyvista.Plotter.add_mesh() メソッドを通して,プロッタのインスタンスにデータを追加します.このワークフローは,典型的には次のようになります.
import pyvista as pv
from pyvista import examples

mesh = pv.Wavelet()

pl = pv.Plotter()
pl.add_mesh(mesh)
pl.show()
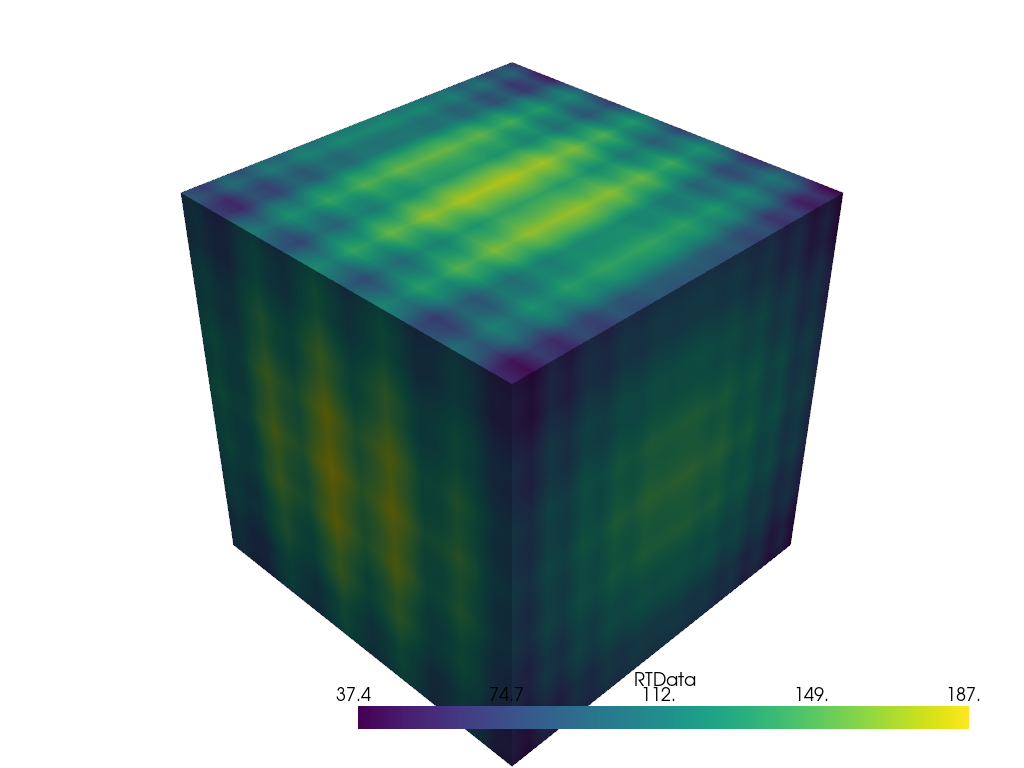
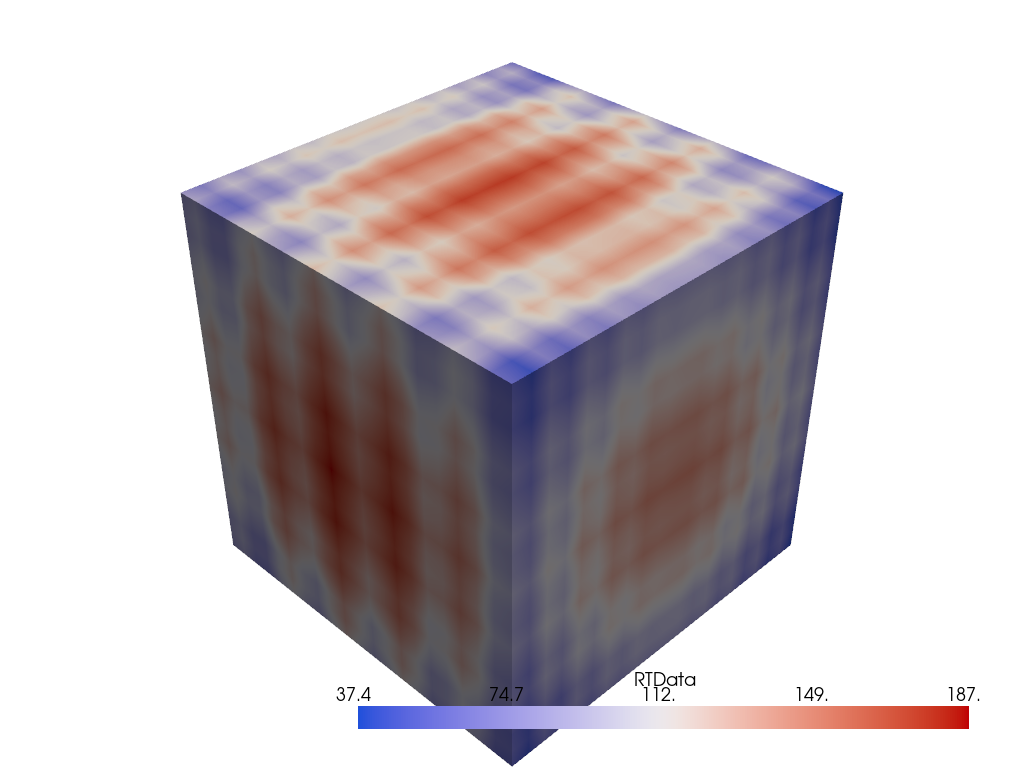
pyvista.Plotter.add_mesh() メソッドのパラメータを使用すると,メッシュの表示方法をカスタマイズすることができます.例えば, cmap 引数でカラーマップを変更することができます.
pl = pv.Plotter()
pl.add_mesh(mesh, cmap='coolwarm')
pl.show()
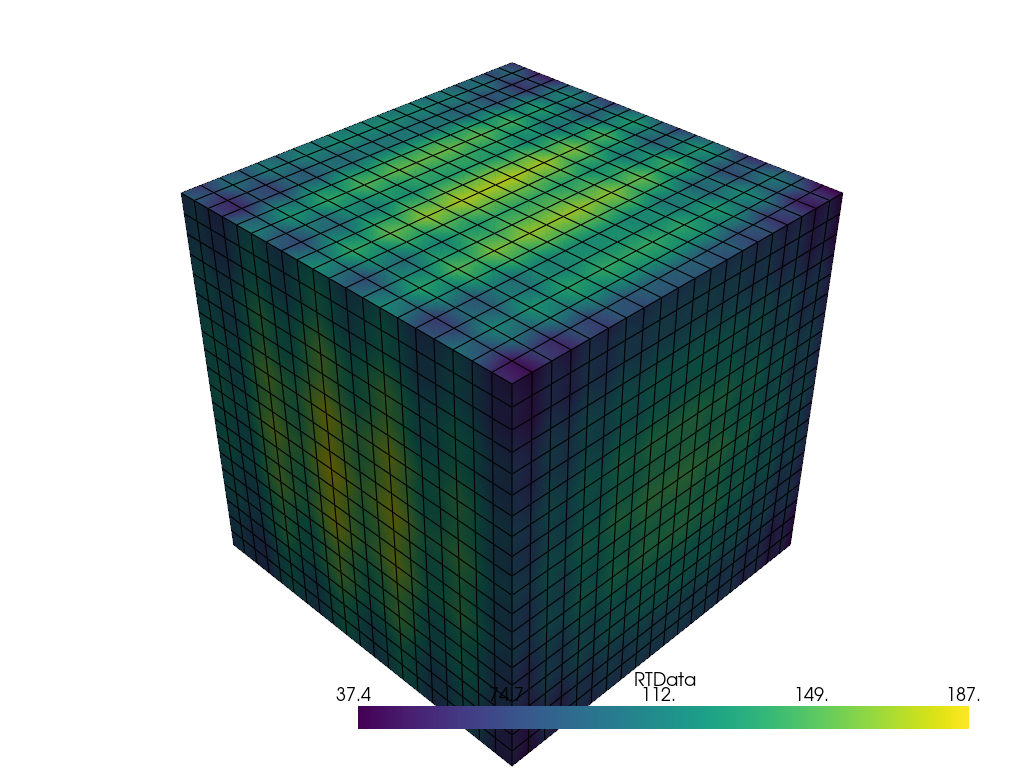
また, show_edges でメッシュのエッジを表示することもできます.
pl = pv.Plotter()
pl.add_mesh(mesh, show_edges=True)
pl.show()
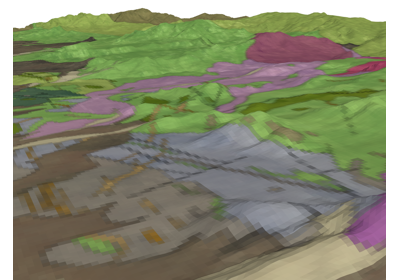
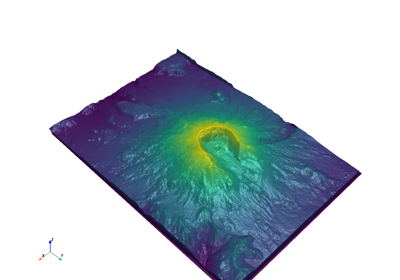
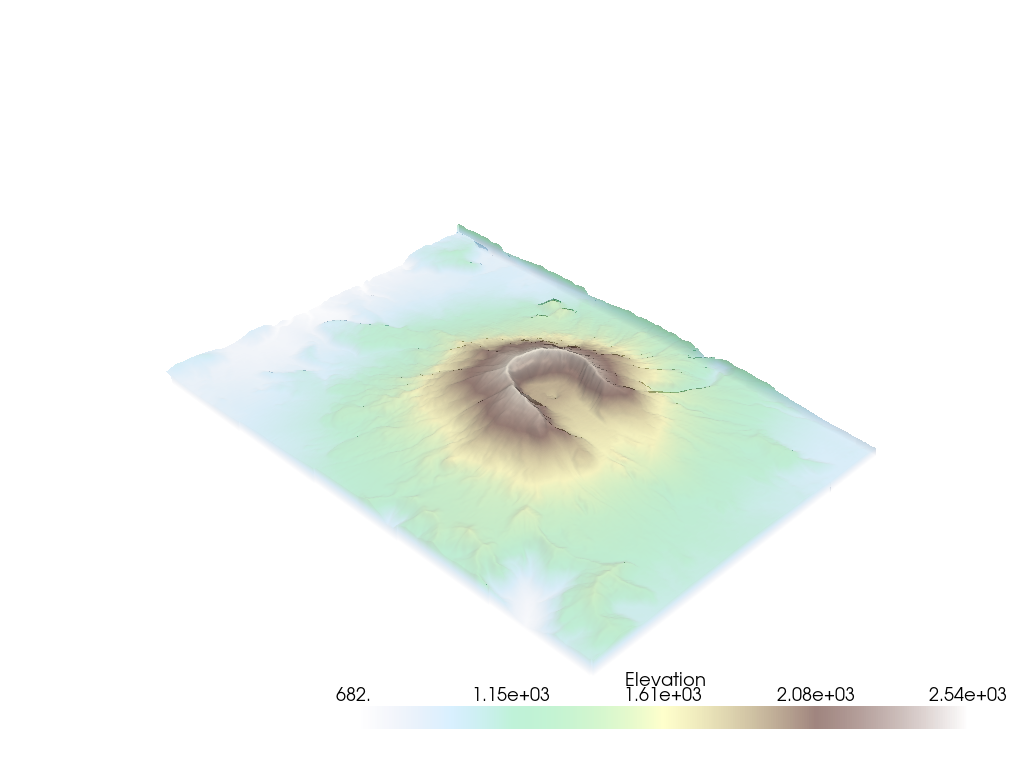
また, opacity 引数で不透明度をスカラー値や線形伝達関数に調整することもできます.
import pyvista as pv
from pyvista import examples

mesh = examples.download_st_helens().warp_by_scalar()

pl = pv.Plotter()
pl.add_mesh(mesh, cmap='terrain', opacity="linear")
pl.show()
add_mesh のすべてのオプションを見てみましょう.
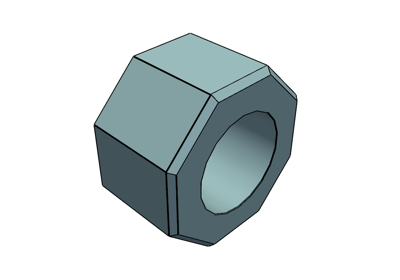
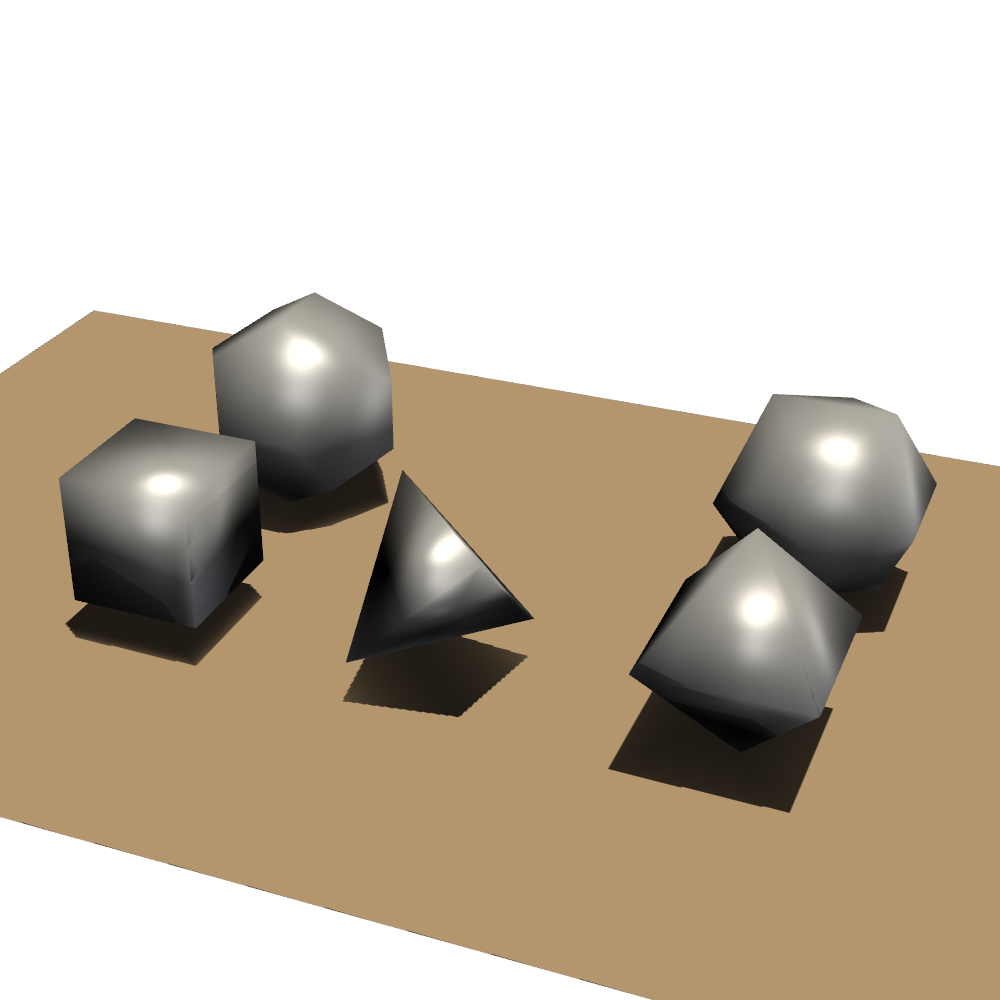
add_mesh メソッドは,同じ Plotter のシーンに異なるデータを追加するために何度も呼び出すことができます.例えば,多くの異なるメッシュオブジェクトを作成し,それらを一緒にプロットすることができます.
import pyvista as pv
from pyvista import examples

kinds = [
    'tetrahedron',
    'cube',
    'octahedron',
    'dodecahedron',
    'icosahedron',
]
centers = [
    (0, 1, 0),
    (0, 0, 0),
    (0, 2, 0),
    (-1, 0, 0),
    (-1, 2, 0),
]

solids = [pv.PlatonicSolid(kind, radius=0.4, center=center) for kind, center in zip(kinds, centers)]

pl = pv.Plotter(window_size=[1000, 1000])
for solid in solids:
    pl.add_mesh(
        solid, color='silver', specular=1.0, specular_power=10
    )
pl.view_vector((5.0, 2, 3))
pl.add_floor('-z', lighting=True, color='tan', pad=1.0)
pl.enable_shadows()
pl.show()
サブプロット#
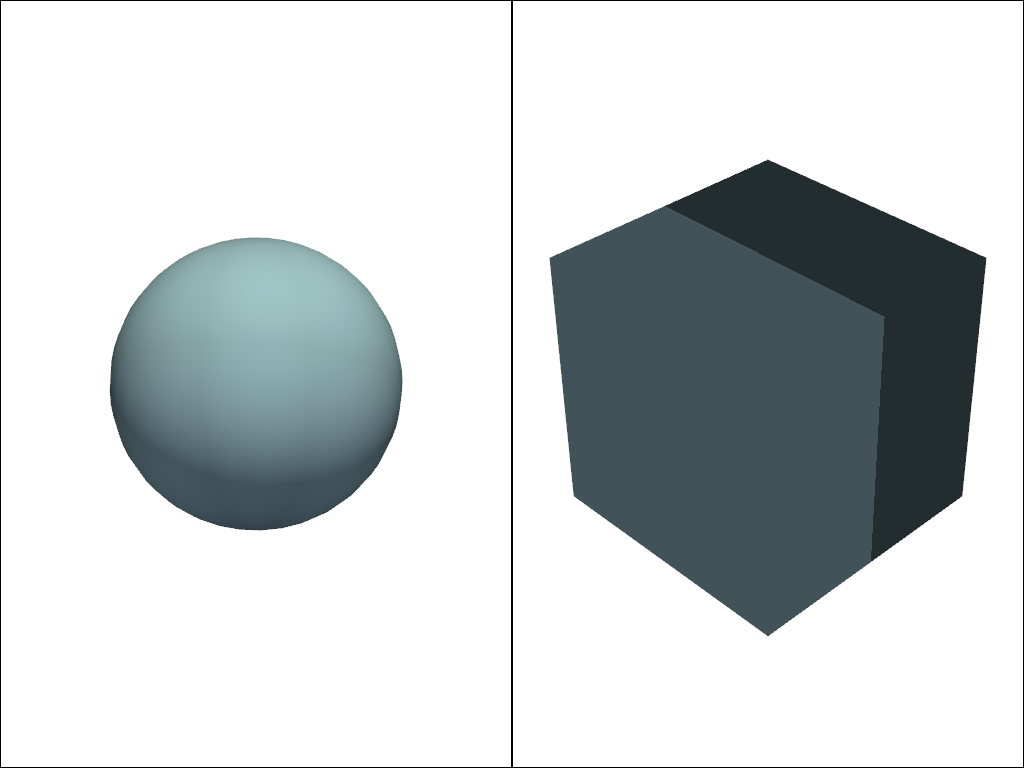
PyVistaのサブプロットAPIを使えば,データセットを横に並べて比較することも簡単にできます.まず pyvista.Plotter オブジェクトの形状を指定して,次に pyvista.Plotter.subplot() メソッドでアクティブなサブプロットを登録します.これは Matplotlib の API でサブプロットを行う方法と同じように行います.
import pyvista as pv

pl = pv.Plotter(shape=(1, 2))

pl.subplot(0, 0)
pl.add_mesh(pv.Sphere())

pl.subplot(0, 1)
pl.add_mesh(pv.Cube())

pl.show()
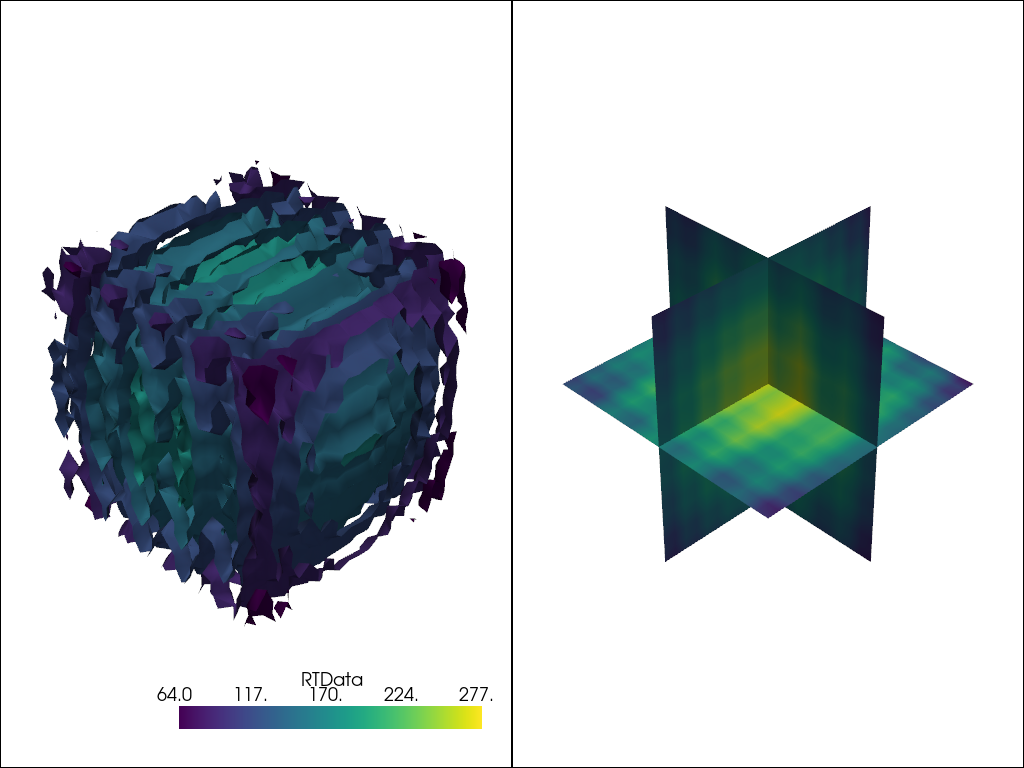
以下は,1つのデータセットのコンターとスライスを並べて比較した例です.
Tip
両方のビューのカメラをリンクさせるには pyvista.Plotter.link_views() メソッドを使用します.
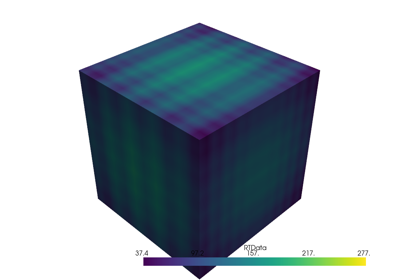
import pyvista as pv

mesh = pv.Wavelet()
cntr = mesh.contour()
slices = mesh.slice_orthogonal()

pl = pv.Plotter(shape=(1, 2))

pl.add_mesh(cntr)

pl.subplot(0, 1)
pl.add_mesh(slices)

pl.link_views()
pl.view_isometric()
pl.show()
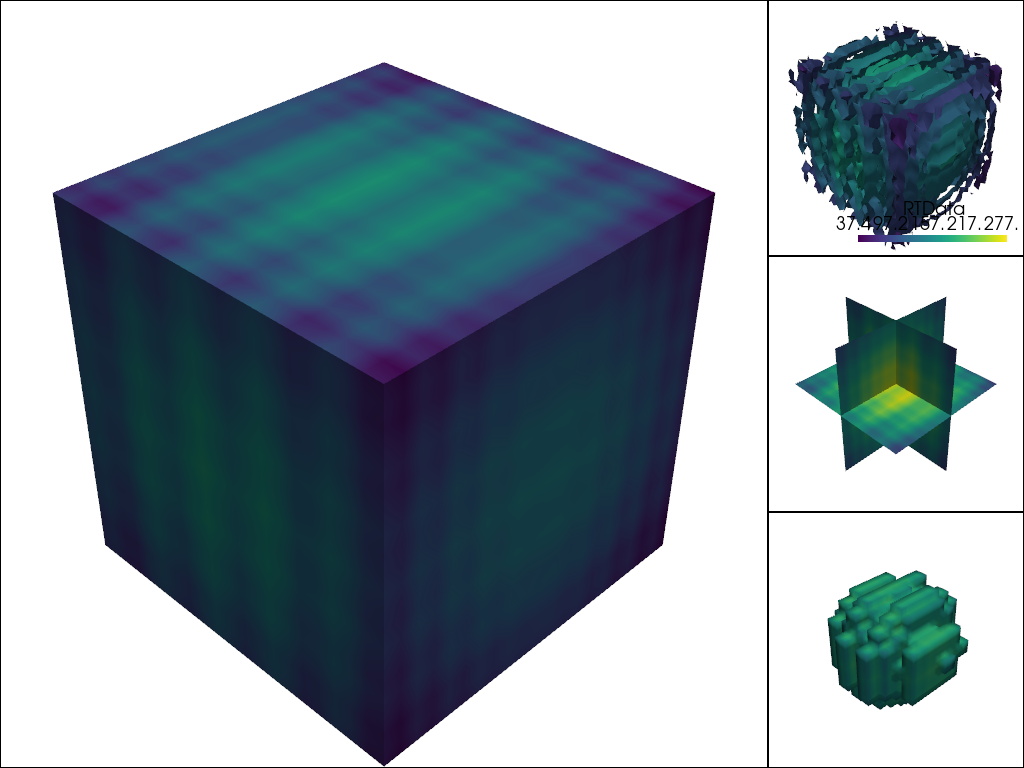
その他のカスタムレイアウトは, shape 引数の文字列記述子でサポートされています.
shape="3|1"とは,左側に3区画,右側に1区画という意味です.shape="4/2"は,上に4プロット,下に2プロットを意味します.
ここでは,右側に3つ,左側に1つのプロットを作成した例を示します.
import pyvista as pv

mesh = pv.Wavelet()
cntr = mesh.contour()
slices = mesh.slice_orthogonal()
thresh = mesh.threshold(200)

pl = pv.Plotter(shape="1|3")

pl.subplot(1)
pl.add_mesh(cntr)

pl.subplot(2)
pl.add_mesh(slices)

pl.subplot(3)
pl.add_mesh(thresh)

pl.subplot(0)
pl.add_mesh(mesh)

pl.link_views()
pl.view_isometric()
pl.show()
注釈
サブプロットの包括的な概要は Multi-Window Plotting Example にあります.この例では,より複雑なレイアウトを作成する方法について詳しく説明しています.
シーンの制御#
Tip
pyvista.Plotter のメソッドの一覧は, API documentation を参照してください.
軸と境界#
軸は pyvista.Plotter.show_axes() を使ってシーンに追加することができます.
import pyvista as pv
from pyvista import examples
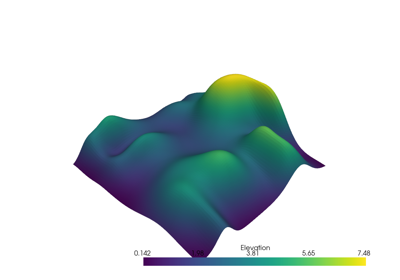
mesh = examples.load_random_hills()
pl = pv.Plotter()
pl.add_mesh(mesh)
pl.show_axes()
pl.show()

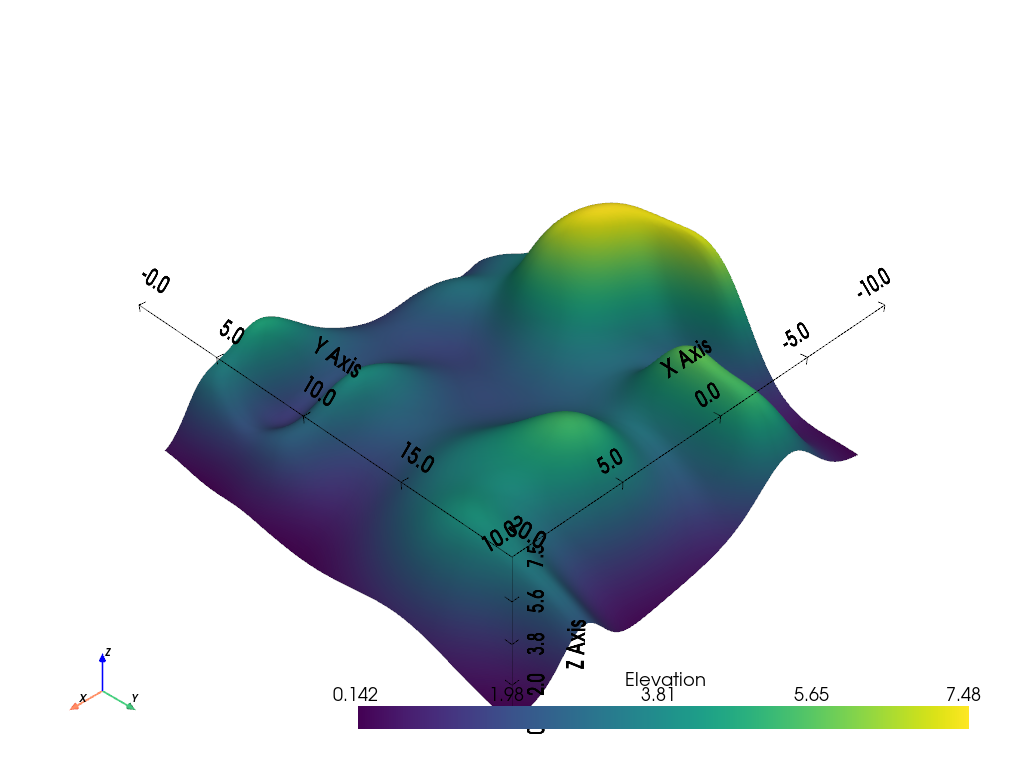
境界線も同様に pyvista.Plotter.show_bounds() で表示されます.
Tip
詳しくは Plotting Bounds を参照してください.
import pyvista as pv
from pyvista import examples

mesh = examples.load_random_hills()

pl = pv.Plotter()
pl.add_mesh(mesh)
pl.show_axes()
pl.show_bounds()
pl.show()