注釈
完全なサンプルコードをダウンロードしたり、Binderを使ってブラウザでこのサンプルを実行するには、 最後に進んでください 。
レッスンの概要#
import pyvista as pv
from pyvista import examples

mesh = pv.Wavelet()
add_mesh#
プロットする場合,ユーザーはまず pyvista.Plotter のインスタンスを作成する必要があります(Matplotlib の図形のようなものです).それから, pyvista.Plotter.add_mesh() メソッドを通して,プロッタのインスタンスにデータを追加します.このワークフローは,典型的には次のようになります.
pl = pv.Plotter()
pl.add_mesh(mesh)
pl.show()
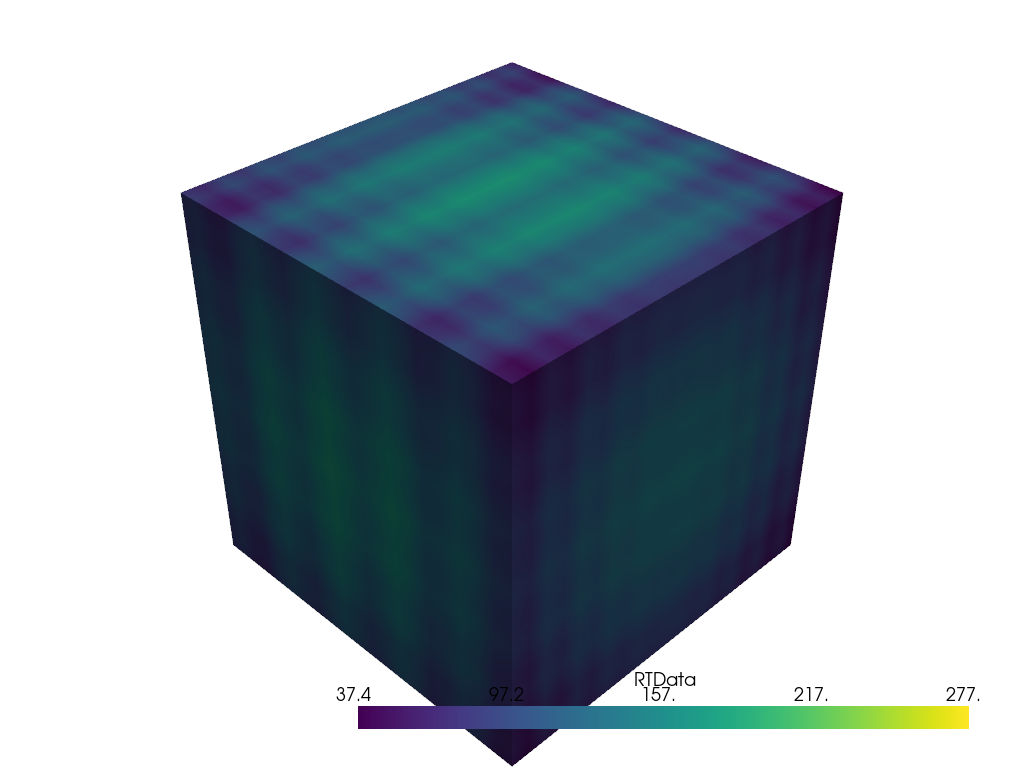
pyvista.Plotter.add_mesh() メソッドのパラメータを使用すると,メッシュの表示方法をカスタマイズすることができます.例えば, cmap 引数でカラーマップを変更することができます.
pl = pv.Plotter()
pl.add_mesh(mesh, cmap="coolwarm")
pl.show()
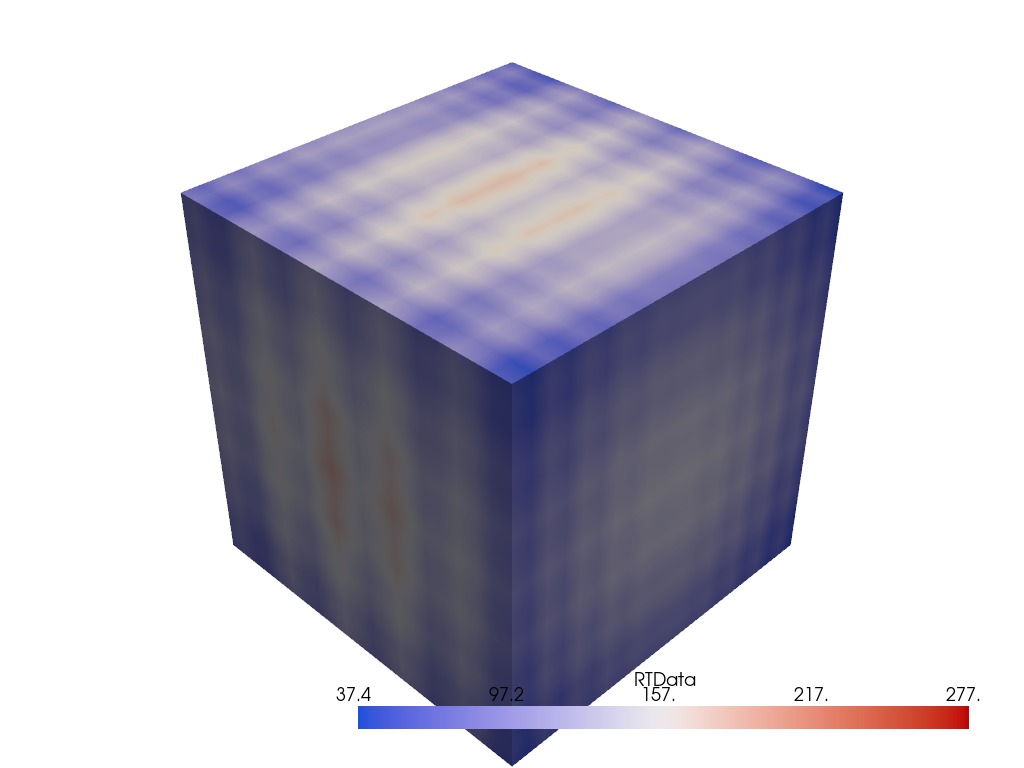
また, show_edges でメッシュのエッジを表示することもできます.
pl = pv.Plotter()
pl.add_mesh(mesh, show_edges=True)
pl.show()
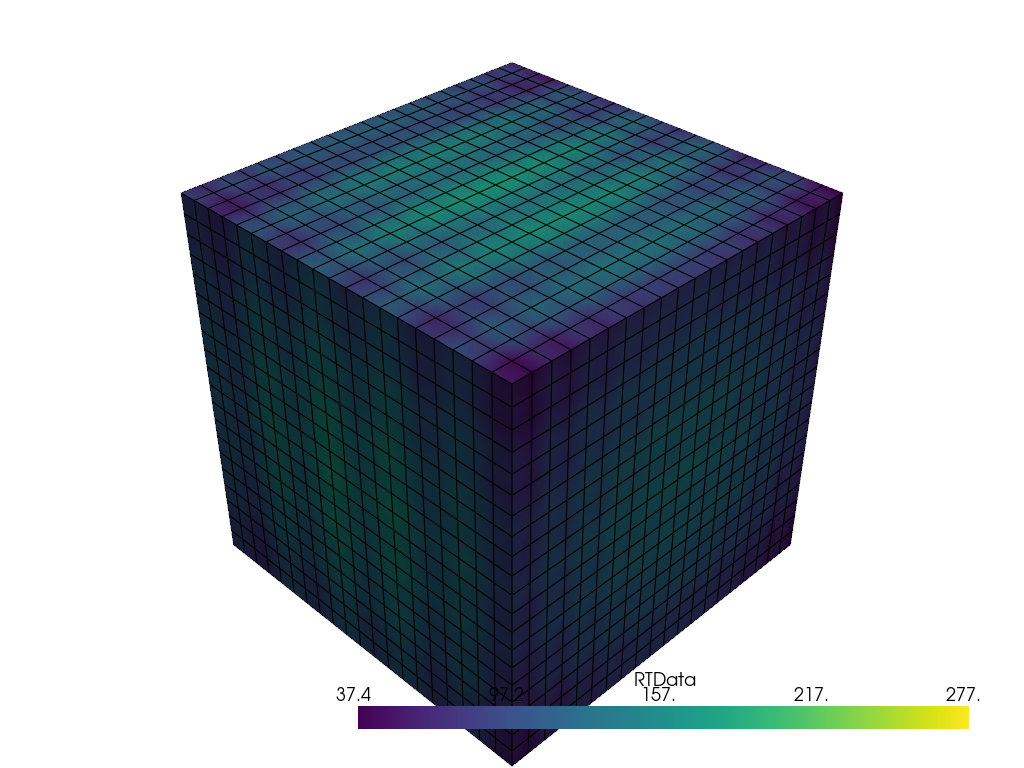
また, opacity 引数で不透明度をスカラー値や線形伝達関数に調整することもできます.
mesh = examples.download_st_helens().warp_by_scalar()

pl = pv.Plotter()
pl.add_mesh(mesh, cmap="terrain", opacity="linear")
pl.show()
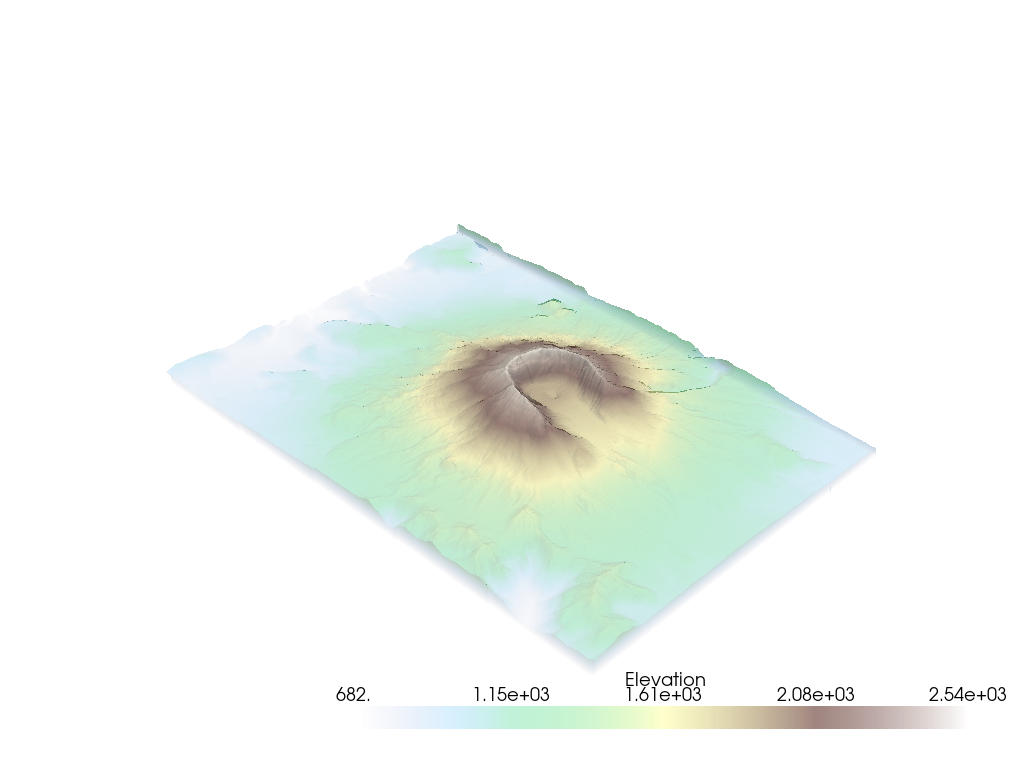
add_mesh のすべてのオプションを見てみましょう.
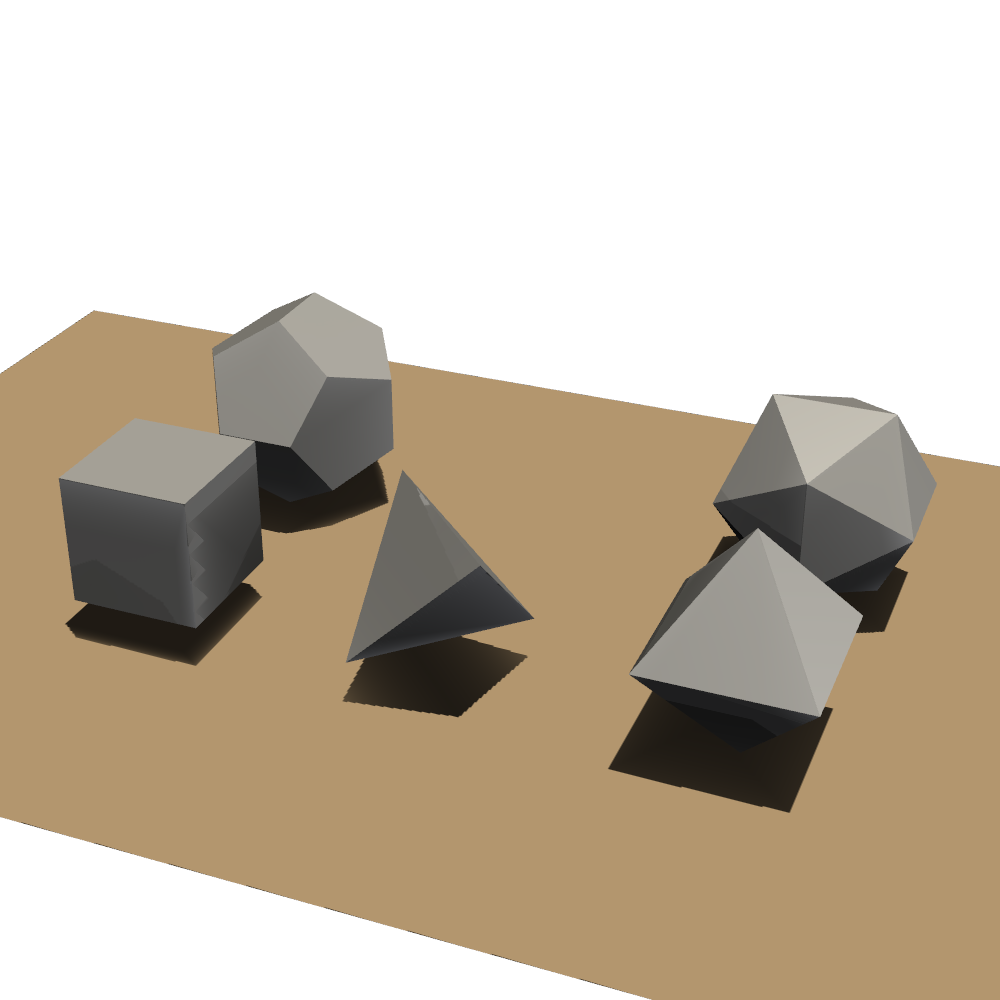
add_mesh メソッドは,同じ Plotter のシーンに異なるデータを追加するために何度も呼び出すことができます.例えば,多くの異なるメッシュオブジェクトを作成し,それらを一緒にプロットすることができます.
kinds = [
    "tetrahedron",
    "cube",
    "octahedron",
    "dodecahedron",
    "icosahedron",
]
centers = [
    (0, 1, 0),
    (0, 0, 0),
    (0, 2, 0),
    (-1, 0, 0),
    (-1, 2, 0),
]

solids = [pv.PlatonicSolid(kind, radius=0.4, center=center) for kind, center in zip(kinds, centers)]

pl = pv.Plotter(window_size=[1000, 1000])
for _ind, solid in enumerate(solids):
    pl.add_mesh(solid, color="silver", specular=1.0, specular_power=10)
pl.view_vector((5.0, 2, 3))
pl.add_floor("-z", lighting=True, color="tan", pad=1.0)
pl.enable_shadows()
pl.show()
サブプロット#
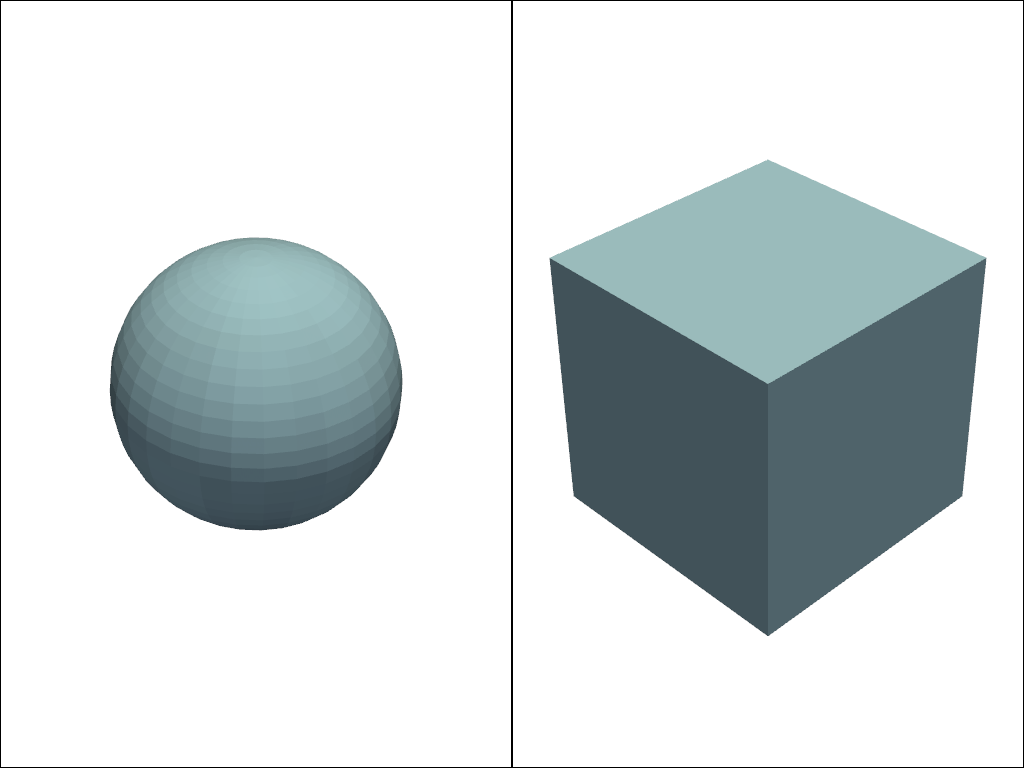
PyVistaのサブプロットAPIを使えば,データセットを横に並べて比較することも簡単にできます.まず pyvista.Plotter オブジェクトの形状を指定して,次に pyvista.Plotter.subplot() メソッドでアクティブなサブプロットを登録します.これは Matplotlib の API でサブプロットを行う方法と同じように行います.
pl = pv.Plotter(shape=(1, 2))

pl.subplot(0, 0)
pl.add_mesh(pv.Sphere())

pl.subplot(0, 1)
pl.add_mesh(pv.Cube())

pl.show()
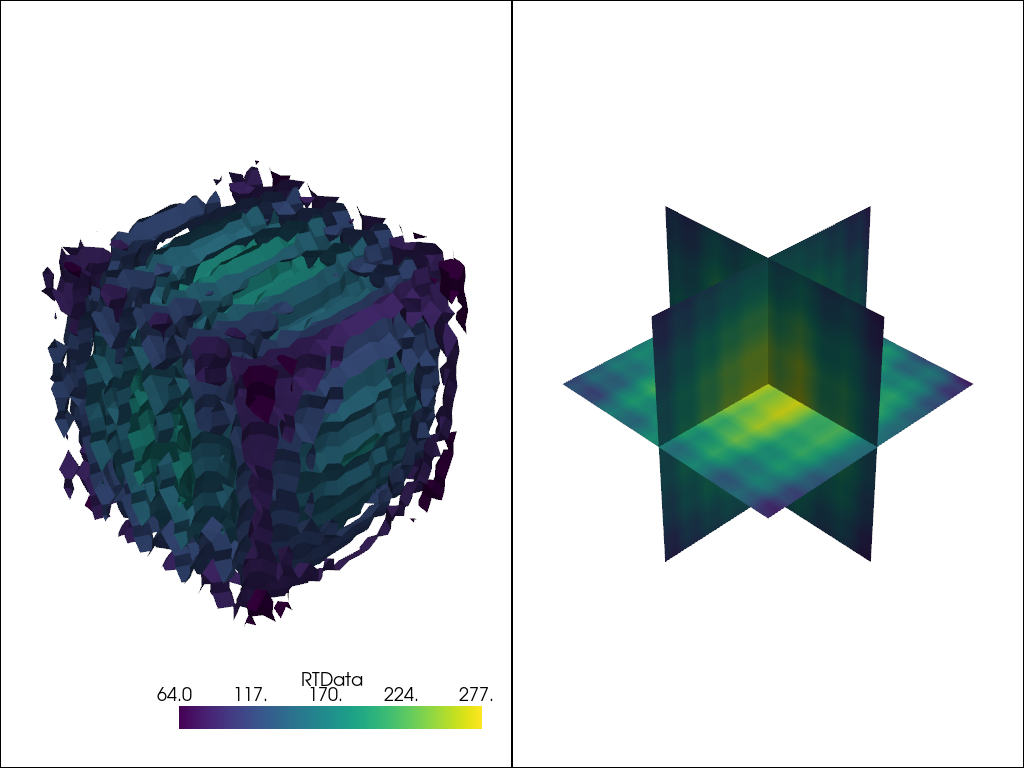
以下は,1つのデータセットのコンターとスライスを並べて比較した例です.
Tip
両方のビューのカメラをリンクさせるには pyvista.Plotter.link_views() メソッドを使用します.
mesh = pv.Wavelet()
cntr = mesh.contour()
slices = mesh.slice_orthogonal()

pl = pv.Plotter(shape=(1, 2))

pl.add_mesh(cntr)

pl.subplot(0, 1)
pl.add_mesh(slices)

pl.link_views()
pl.view_isometric()
pl.show()
軸と境界#
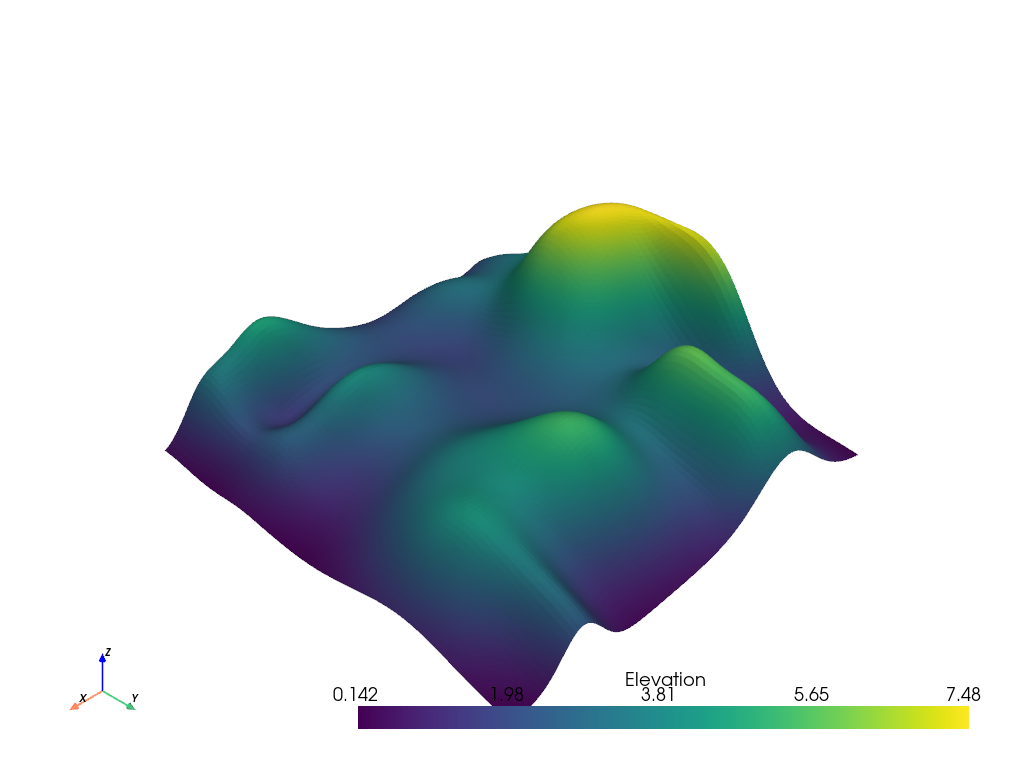
軸は pyvista.Plotter.show_axes() を使ってシーンに追加することができます.
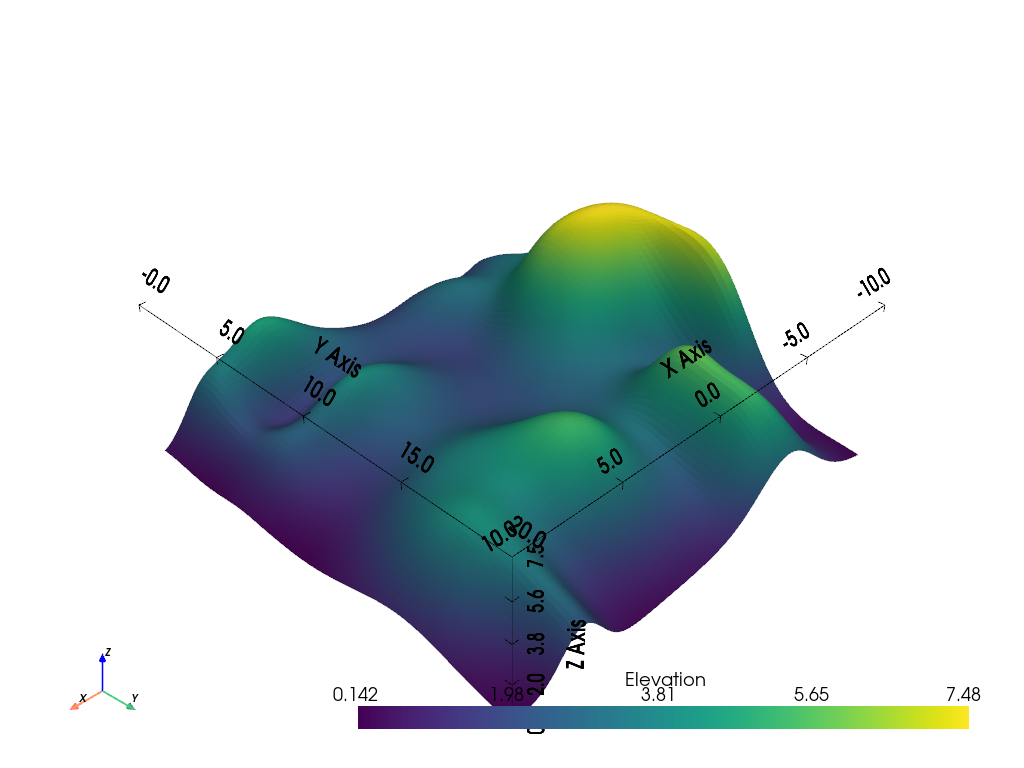
mesh = examples.load_random_hills()

pl = pv.Plotter()
pl.add_mesh(mesh)
pl.show_axes()
pl.show()
境界線も同様に pyvista.Plotter.show_bounds() で表示されます.
Tip
詳しくは Plotting Bounds を参照してください.
pl = pv.Plotter()
pl.add_mesh(mesh)
pl.show_axes()
pl.show_bounds()
pl.show()
Total running time of the script: (0 minutes 5.337 seconds)
