注釈
完全なサンプルコードをダウンロードしたり、Binderを使ってブラウザでこのサンプルを実行するには、 最後に進んでください 。
点群を作成#
頂点のポイントクラウドとそれらのポイントのスカラー配列から pyvista.PolyData オブジェクトを作成します.
import numpy as np
import pyvista as pv
from pyvista import examples
点群は一般的に pyvista.PolyData を使用して構築され, 個々の点に関連付けられたスカラーまたはベクトルデータ配列を簡単に持つことができます.この例では, まず examples モジュールから入手可能な点群を使って逆算してみます.ただし,これは独自の頂点位置のNumPy配列を使用してPyVistaメッシュを作成するのと同じです.
# Define some helpers - ignore these and use your own data if you like!
def generate_points(subset=0.02):
    """A helper to make a 3D NumPy array of points (n_points by 3)."""
    dataset = examples.download_lidar()
    ids = np.random.randint(low=0, high=dataset.n_points - 1, size=int(dataset.n_points * subset))
    return dataset.points[ids]


points = generate_points()
# Output the first 5 rows to prove it's a numpy array (n_points by 3)
# Columns are (X, Y, Z)
points[0:5, :]
pyvista_ndarray([[4.80946175e+05, 4.40010030e+06, 1.76384998e+03],
                 [4.80985375e+05, 4.40020070e+06, 1.77631995e+03],
                 [4.80990075e+05, 4.40013820e+06, 1.76121997e+03],
                 [4.80954375e+05, 4.40013250e+06, 1.76226001e+03],
                 [4.80943175e+05, 4.40009460e+06, 1.78154004e+03]])
サンプルデータまたは自分のプロジェクトからの点/頂点のNumPy配列ができたので,それらの点からPyVistaメッシュを作成します.
ここで,ポイントが正しくロードされたことを示すために、サニティチェックを実行します.
True
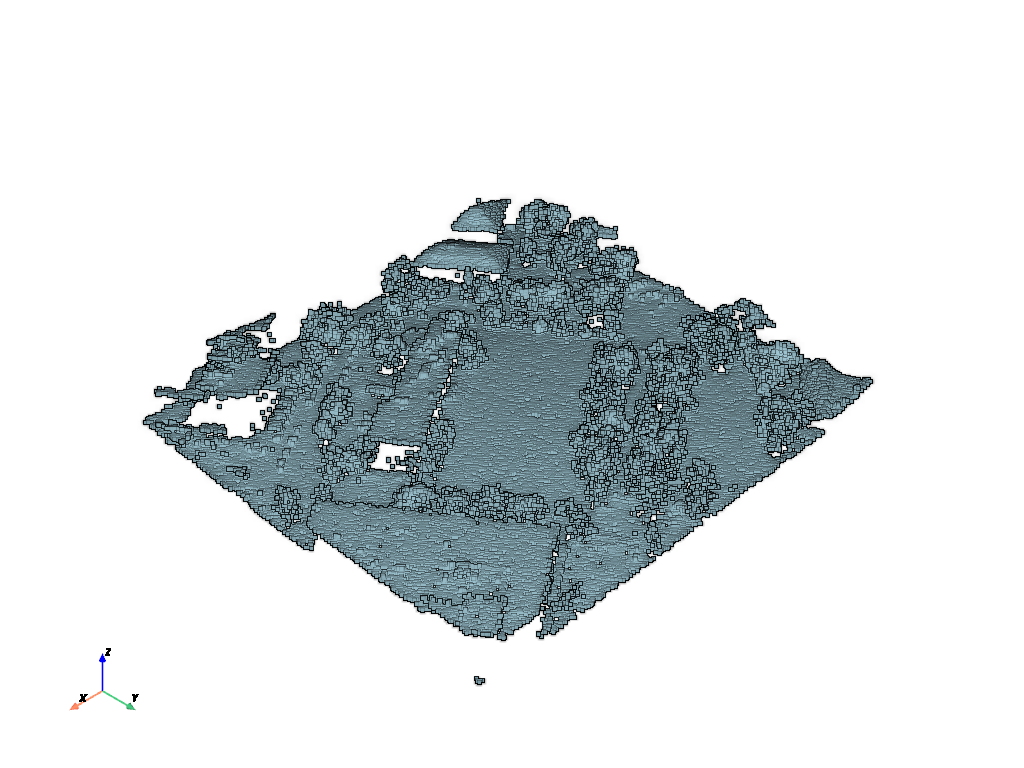
これでPyVistaメッシュができたので,プロットすることができます.ここでは,eye domeライティングを使用するオプションを追加します.これは,ポイントクラウド( EDL についてもっと学ぶ)を使用して深さの認識を向上させるシェーディング技法です.
point_cloud.plot(eye_dome_lighting=True)
ここで,メッシュのすべてのノードに関連付けるデータアトリビュート(スカラーまたはベクトル配列)があるとします.最初の軸に沿ったメッシュ内のノードの数と同じ長さのNumPyデータ配列を簡単に追加できます.例えば,この新しい point_cloud メッシュにいくつかの配列を追加しましょう.
points配列と同じ長さのスカラ値の配列を作成します.この配列の各要素は,同じインデックスのポイントに対応します.
注釈
points 配列のコンポーネントを使用するか,メッシュの n_points プロパティを使用すると,その長さの配列を作成することができます.
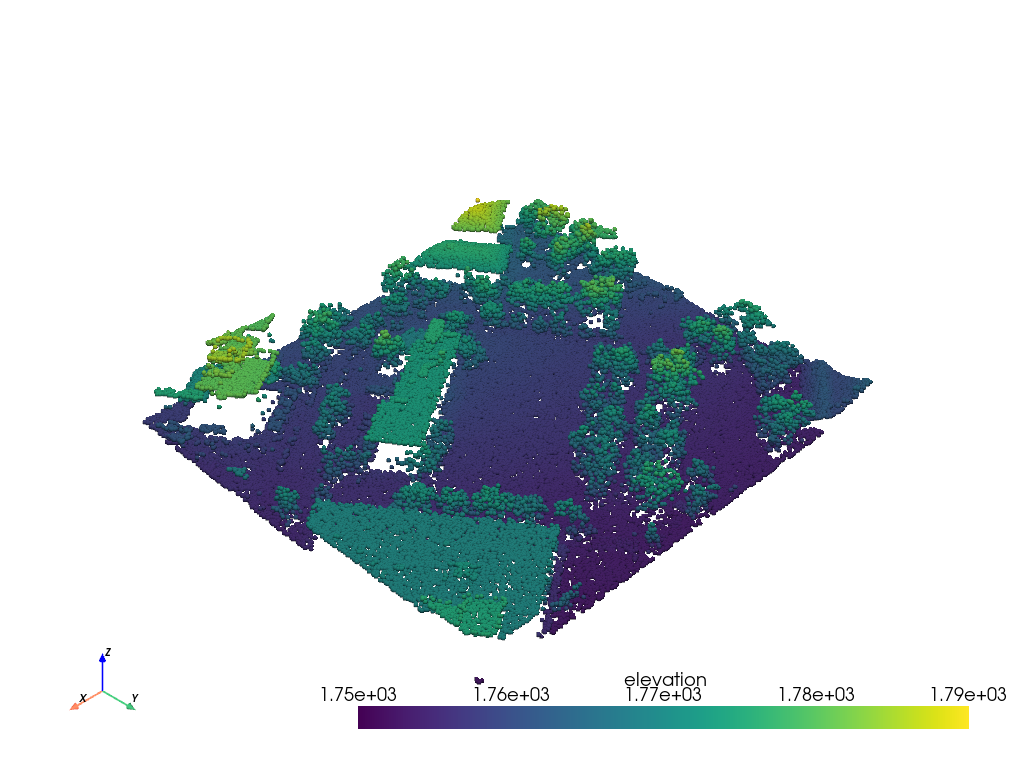
そのデータを "elevation" という名前でメッシュに追加します.
point_cloud["elevation"] = data
今回は, render_points_as_spheres を使って,すべての点を球体としてレンダリングしてみましょう.
point_cloud.plot(render_points_as_spheres=True)
そのデータは退屈ですよね?複数のスカラ値を持つデータ配列,例えば3つの要素を持つベクトルを追加することもできます.ポイントクラウド内のすべてのノードのベクトルを計算し,それらのベクトルをメッシュに追加する簡単な関数を作成します.
今回は numpy.random.random() を使って,100点からなる全く新しいランダムな点群を作成する.
# Create a random point cloud with Cartesian coordinates
points = np.random.rand(100, 3)
# Construct PolyData from those points
point_cloud = pv.PolyData(points)


def compute_vectors(mesh):
    """Create normalized vectors pointing outward from the center of the cloud."""
    origin = mesh.center
    vectors = mesh.points - origin
    return vectors / np.linalg.norm(vectors, axis=1)[:, None]


vectors = compute_vectors(point_cloud)
vectors[0:5, :]
pyvista_ndarray([[ 0.8055592 ,  0.2497612 , -0.53730226],
                 [ 0.69938892,  0.48263592,  0.52717901],
                 [ 0.42691044,  0.16885574,  0.88838911],
                 [-0.64397113,  0.33563093, -0.68749768],
                 [-0.16588821,  0.98611185,  0.00803216]])
ベクトル配列を点データとして新しいメッシュに追加します:
point_cloud["vectors"] = vectors
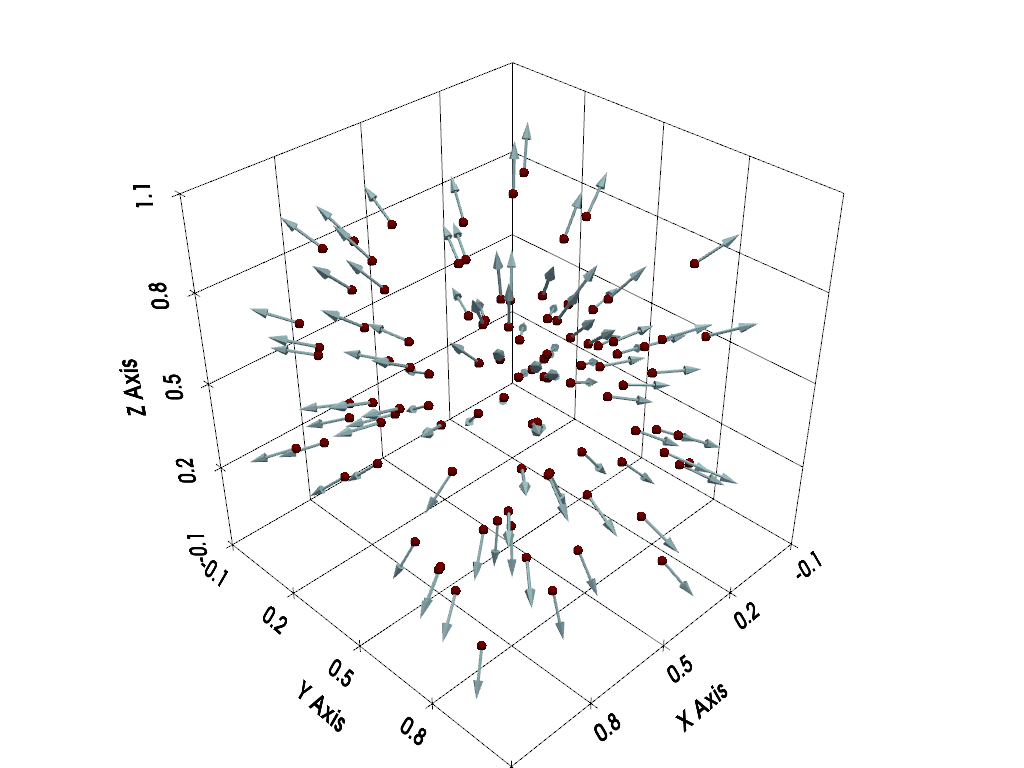
さて,これらのベクトルを使って,グリフフィルタで矢印を作ることができます(詳しくは グリフの例 を参照してください).
arrows = point_cloud.glyph(
    orient="vectors",
    scale=False,
    factor=0.15,
)

# Display the arrows
plotter = pv.Plotter()
plotter.add_mesh(point_cloud, color="maroon", point_size=10.0, render_points_as_spheres=True)
plotter.add_mesh(arrows, color="lightblue")
# plotter.add_point_labels([point_cloud.center,], ['Center',],
#                          point_color='yellow', point_size=20)
plotter.show_grid()
plotter.show()
Total running time of the script: (0 minutes 6.632 seconds)