注釈
Go to the end をクリックすると完全なサンプルコードをダウンロードできます.
CFDデータをプロットする#
SimScale Project Library にあるSimScaleの公開サンプルにホストされているOpenFoamのCFD例をプロットします.
このサンプルデータセットは pyvista.POpenFOAMReader を使って読み込まれました.このリーダーを使用した完全な例については OpenFOAMデータのプロット を参照してください.
import numpy as np

import pyvista as pv
from pyvista import examples
サンプルデータセットをダウンロードし,ロードします.
block = examples.download_openfoam_tubes()
block
断面図のプロット#
データセットの外形を流速の断面図とともにプロットします.
# first, get the first block representing the air within the tube.
air = block[0]

# generate a slice in the XZ plane
y_slice = air.slice('y')

pl = pv.Plotter()
pl.add_mesh(y_slice, scalars='U', lighting=False, scalar_bar_args={'title': 'Flow Velocity'})
pl.add_mesh(air, color='w', opacity=0.25)
pl.enable_anti_aliasing()
pl.show()

流線のプロット - 流体速度#
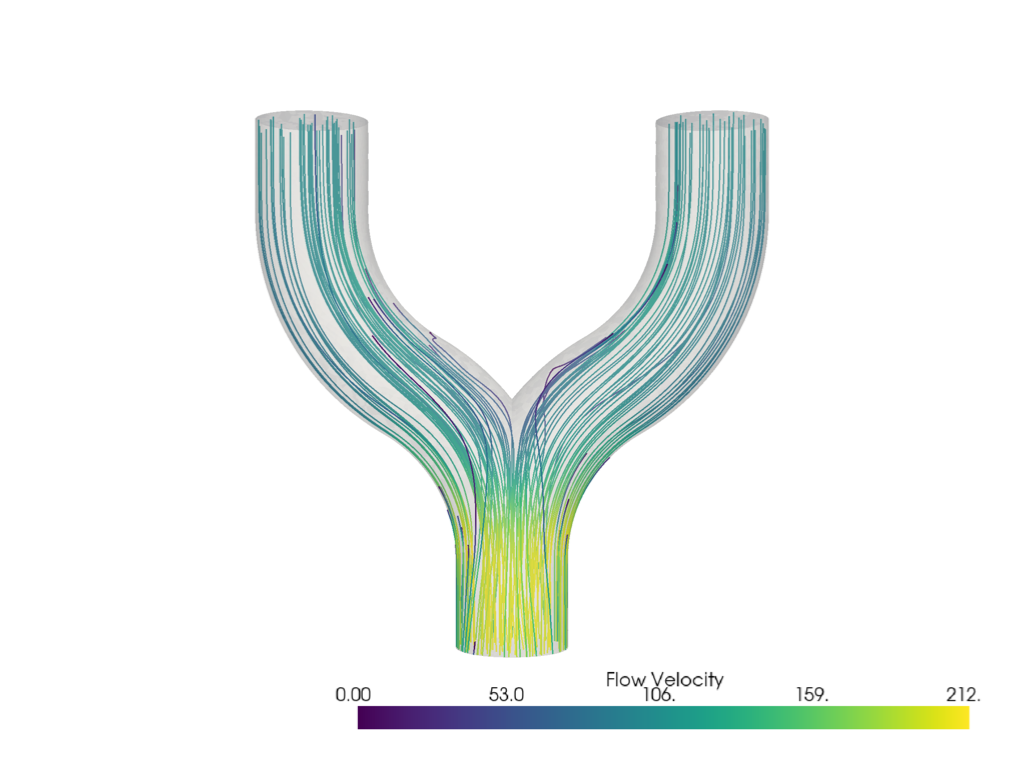
streamlines_from_source() を使って流線を生成します.
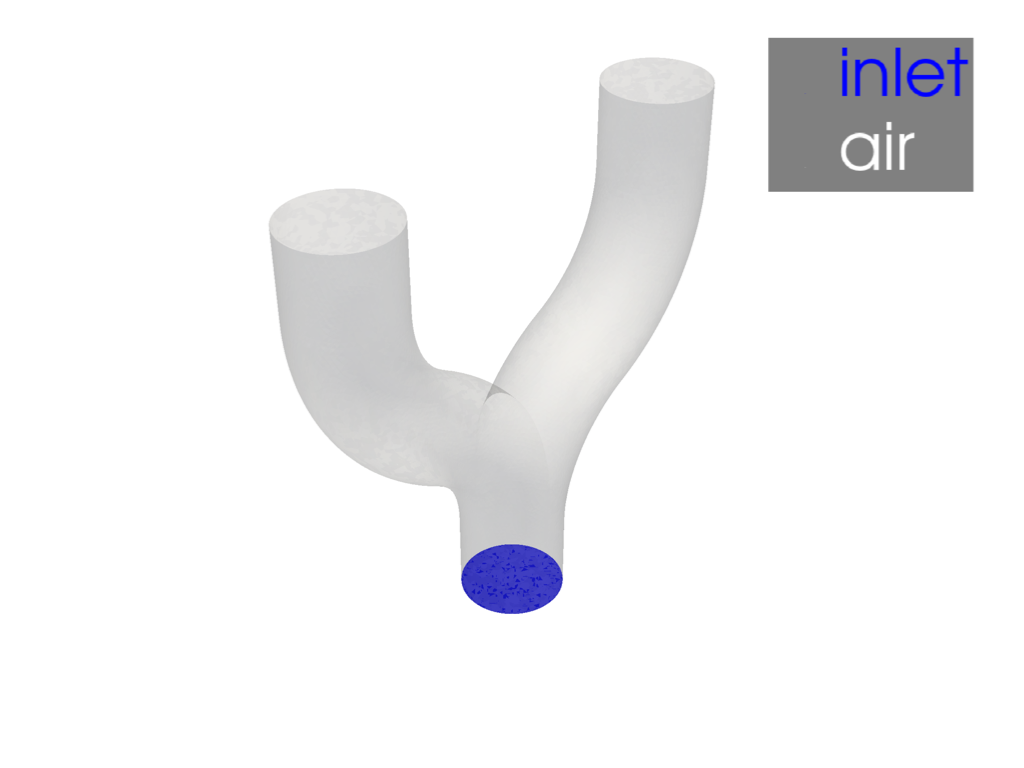
# Let's use the inlet as a source. First plot it.
inlet = block[1][2]
pl = pv.Plotter()
pl.add_mesh(inlet, color='b', label='inlet')
pl.add_mesh(air, opacity=0.2, color='w', label='air')
pl.enable_anti_aliasing()
pl.add_legend(face=None)
pl.show()

では,実際に流線を生成してみましょう.元のインレットは1000点あるので,これを5点おきに使って200点程度に減らしてみましょう.
注釈
もし,インレットの均一なサブサンプリングが必要なら, pyvista/pyacvd を使うことができます.
pset = pv.PointSet(inlet.points[::5])
lines = air.streamlines_from_source(
    pset,
    vectors='U',
    max_time=1.0,
)

pl = pv.Plotter()
pl.add_mesh(
    lines,
    render_lines_as_tubes=True,
    line_width=3,
    lighting=False,
    scalar_bar_args={'title': 'Flow Velocity'},
    scalars='U',
    rng=(0, 212),
)
pl.add_mesh(air, color='w', opacity=0.25)
pl.enable_anti_aliasing()
pl.camera_position = 'xz'
pl.show()

ボリューメトリックプロット - 渦粘性係数の可視化#
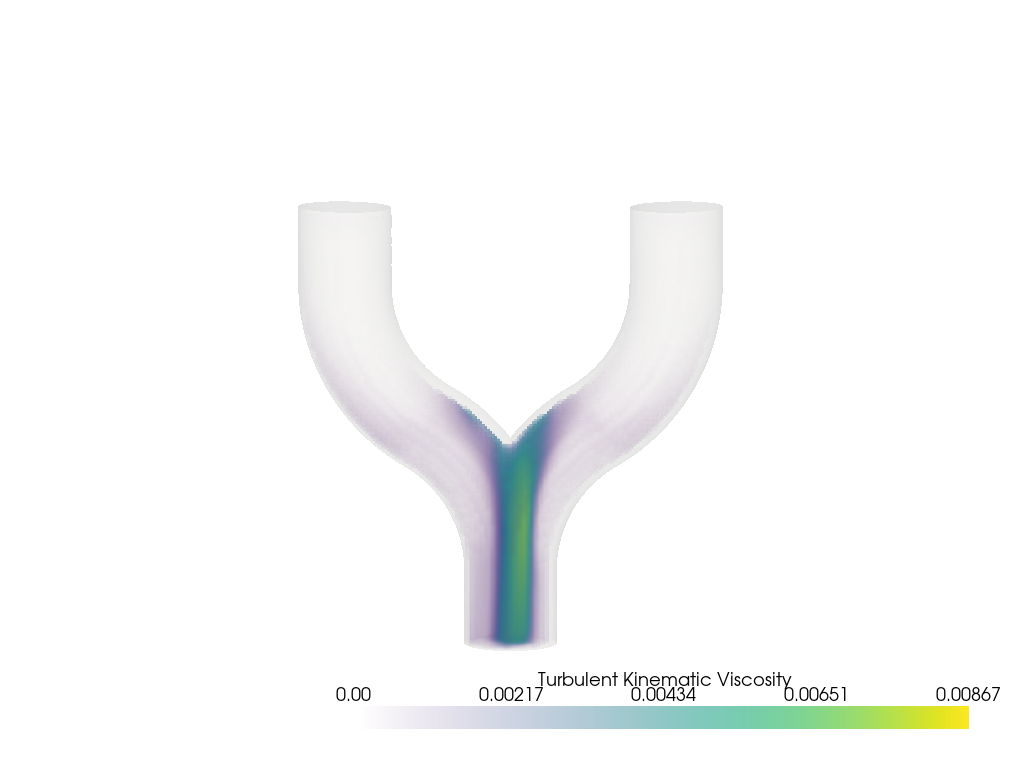
流体の渦粘性係数は,乱流モデリングにおいて,乱流運動が流体内の運動量輸送に及ぼす影響を記述するために用いられる派生量です.
この例では,まず pyvista.UnstructuredGrid から pyvista.ImageData に sample() で結果を抽出してみます.これは add_volume() を使って可視化できるようにするためです.
bounds = np.array(air.bounds) * 1.2
origin = (bounds[0], bounds[2], bounds[4])
spacing = (0.003, 0.003, 0.003)
dimensions = (
    int((bounds[1] - bounds[0]) // spacing[0] + 2),
    int((bounds[3] - bounds[2]) // spacing[1] + 2),
    int((bounds[5] - bounds[4]) // spacing[2] + 2),
)
grid = pv.ImageData(dimensions=dimensions, spacing=spacing, origin=origin)
grid = grid.sample(air)

pl = pv.Plotter()
vol = pl.add_volume(
    grid,
    scalars='nut',
    opacity='linear',
    scalar_bar_args={'title': 'Turbulent Kinematic Viscosity'},
)
vol.prop.interpolation_type = 'linear'
pl.add_mesh(air, color='w', opacity=0.1)
pl.camera_position = 'xz'
pl.show()

Total running time of the script: (0 minutes 10.963 seconds)