注釈
Go to the end to download the full example code
VTKアルゴリズムでプロットする#
動的なビジュアライゼーションのために, vtkAlgorithm を Plotter に渡します.
注釈
"動的な可視化" とは,入力データ/ソースが変化すると,リアルタイムに可視化されることを意味します.
vtkAlgorithm は,VTK のすべてのソース,フィルタ,シンクのスーパークラスです.これは,データ処理アルゴリズムを実行するための一般的なインターフェイスを定義しています.パイプライン接続は,接続を通過するデータの種類に依存しない入力ポートと出力ポートに関連付けられます.
add_mesh() などのメソッドを用いて,シーンにデータを追加する際に vtkAlgorithm の出力ポートを PyVista の描画パイプラインに接続することが可能です.
この例では,いくつかの vtkAlgorithm フィルタを直接使用し,それを PyVista に渡して動的な視覚化を行う方法を説明します.
import vtk

import pyvista as pv
from pyvista import examples
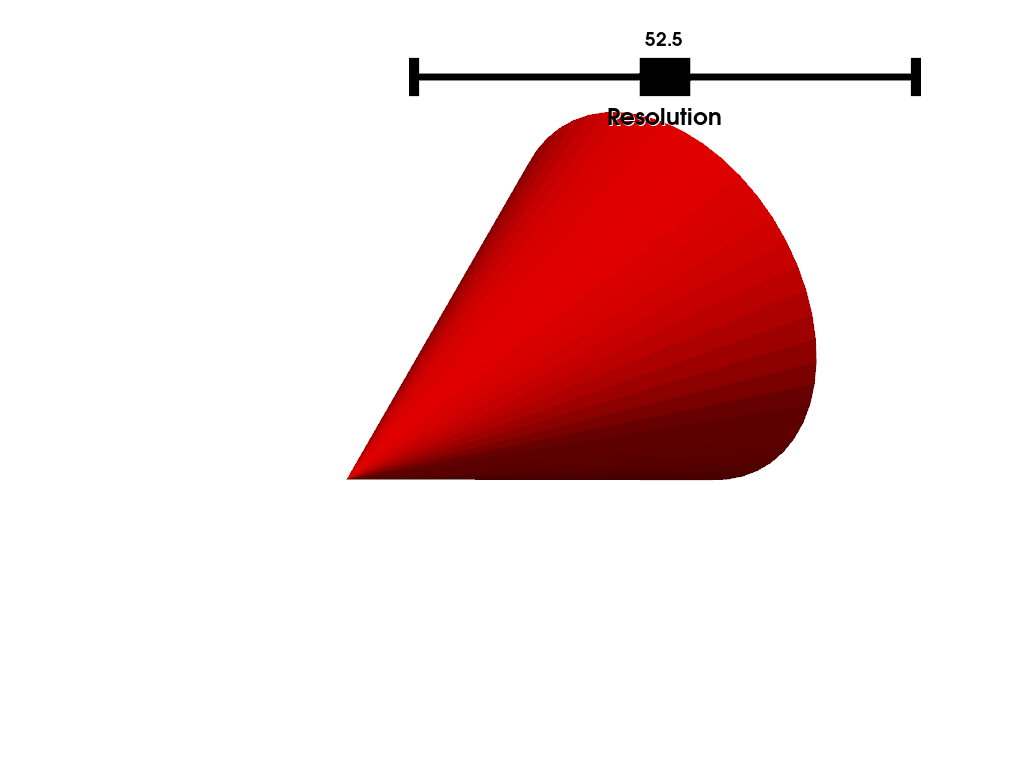
ソースアルゴリズムとして vtkConeSource を使用します.このソースは,インスタンスのパラメータに応じて動的にコーンオブジェクトを作成します.この例では, vtkConeSource.SetResolution() を介して,コーンソースアルゴリズムの解像度を設定するコールバックを接続します.
algo = pv.ConeSource()


def update_resolution(value):
    """Callback to set the resolution of the cone generator."""
    res = round(value)
    algo.resolution = res
vtkConeSource (vtkAlgorithm のサブクラス) を直接プロッタに渡し,スライダウィジェットを解像度を調整するコールバックに接続します.
p = pv.Plotter()
p.add_mesh(algo, color='red')
p.add_slider_widget(update_resolution, [5, 100], title='Resolution')
p.show()
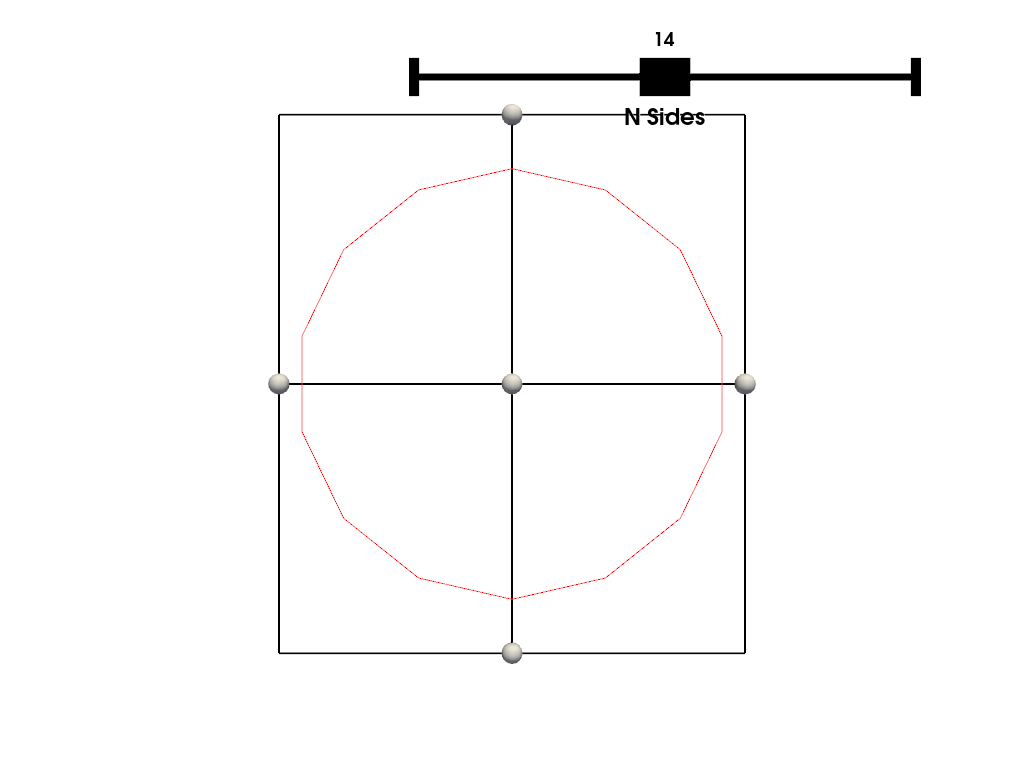
ここでは, vtkRegularPolygonSource を使用した別の例を示します.
poly_source = vtk.vtkRegularPolygonSource()
poly_source.GeneratePolygonOff()
poly_source.SetRadius(5.0)
poly_source.SetCenter(0.0, 0.0, 0.0)


def update_n_sides(value):
    """Callback to set the number of sides."""
    res = round(value)
    poly_source.SetNumberOfSides(res)


p = pv.Plotter()
p.add_mesh_clip_box(poly_source, color='red')
p.add_slider_widget(update_n_sides, [3, 25], title='N Sides')
p.view_xy()
p.show()
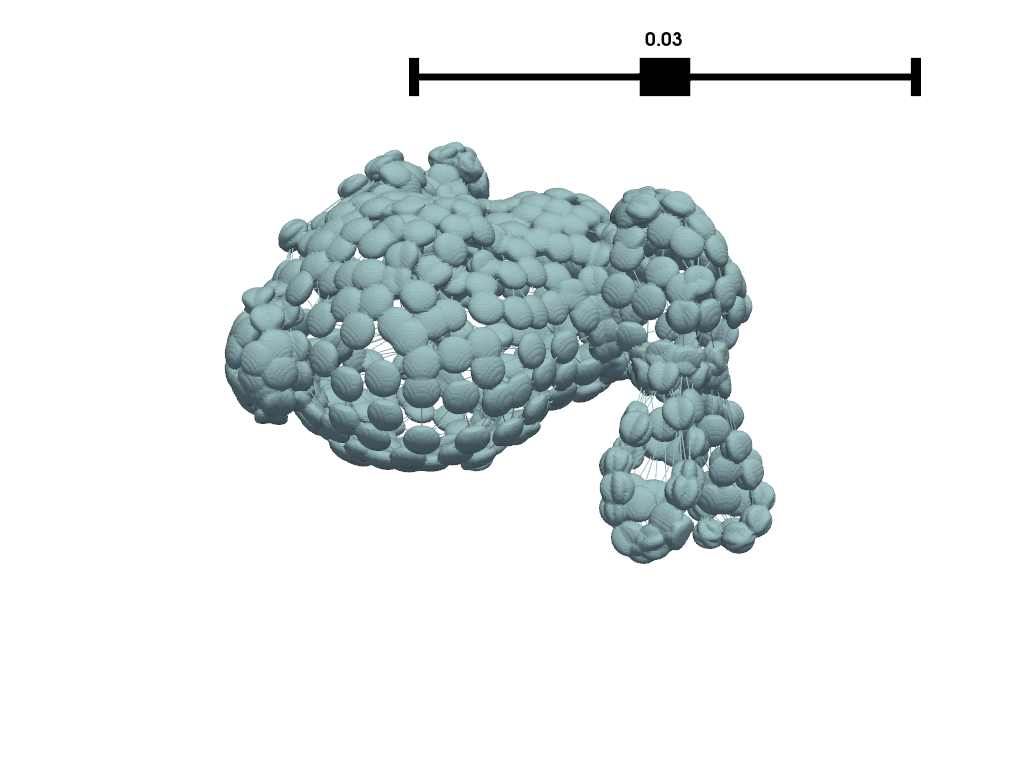
フィルタパイプライン#
これは,任意の vtkAlgorithm サブクラスを使用して,動的にデータの生成やフィルタリングを行うことができます.以下は,VTKフィルタのパイプラインを一緒に実行する例です.
# Source mesh object (static)
mesh = examples.download_bunny_coarse()

# Initialize VTK algorithm to modify dynamically
splatter = vtk.vtkGaussianSplatter()

# Pass PyVista object as input to VTK
splatter.SetInputData(mesh)

# Set parameters of splatter filter
n = 200
splatter.SetSampleDimensions(n, n, n)
splatter.SetRadius(0.02)
splatter.SetExponentFactor(-10)
splatter.SetEccentricity(2)
splatter.Update()

# Pipe splatter filter into a contour filter
contour = vtk.vtkContourFilter()
contour.SetInputConnection(splatter.GetOutputPort())
contour.SetInputArrayToProcess(0, 0, 0, 0, 'SplatterValues')
contour.SetNumberOfContours(1)
contour.SetValue(0, 0.95 * splatter.GetRadius())

# Use PyVista to plot output of contour filter
p = pv.Plotter(notebook=0)
p.add_mesh(mesh, style='wireframe')
p.add_mesh(contour, color=True)
p.add_slider_widget(splatter.SetRadius, [0.01, 0.05])
p.show()
Total running time of the script: (0 minutes 4.804 seconds)