Synthetic Dataset Benchmarks#
These benchmarks evaluate zvtk performance on synthetic
pyvista.UnstructuredGrid`s generated from
:class:`pyvista.ImageData
. Dataset sizes range from a handful of KB to over 5
GB.
File Size Comparison#
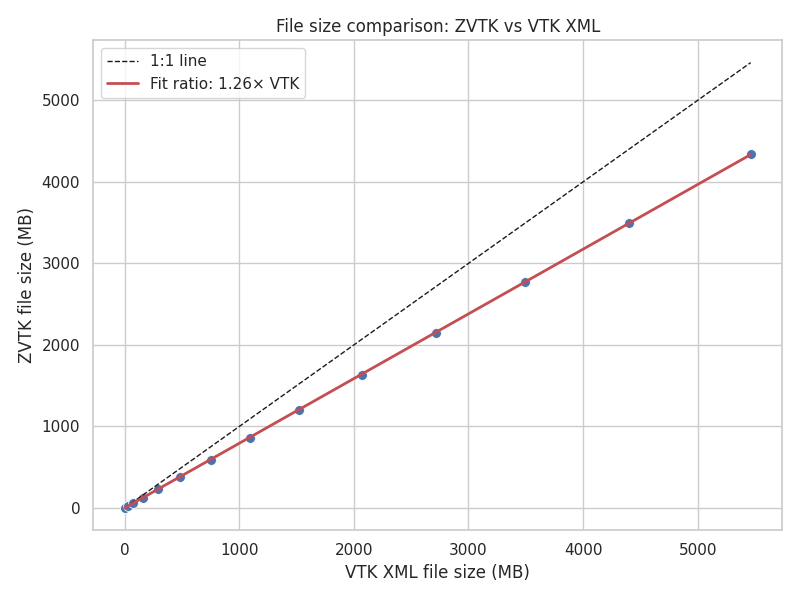
File size comparison for synthetic unstructured grids#
zvtk consistently produces smaller files than VTK XML. The red line indicates
the linear fit ratio between zvtk and VTK file sizes, showing a 26% reduction
in file size for zvtk files vs. VTK XML using zlib (default).
Write Time Comparison#
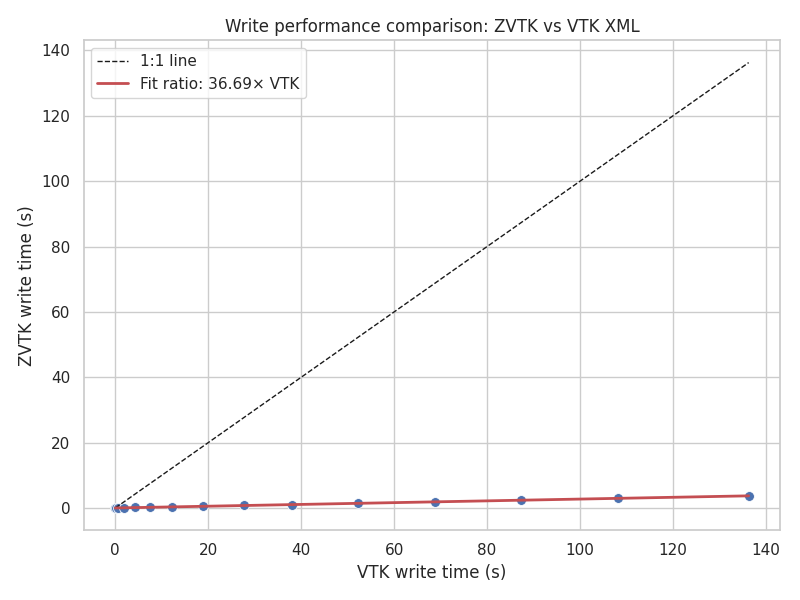
Write time comparison for synthetic unstructured grids#
zvtk write times are consistently lower than VTK XML, about 37 times faster
for this dataset.
Read Time Comparison#
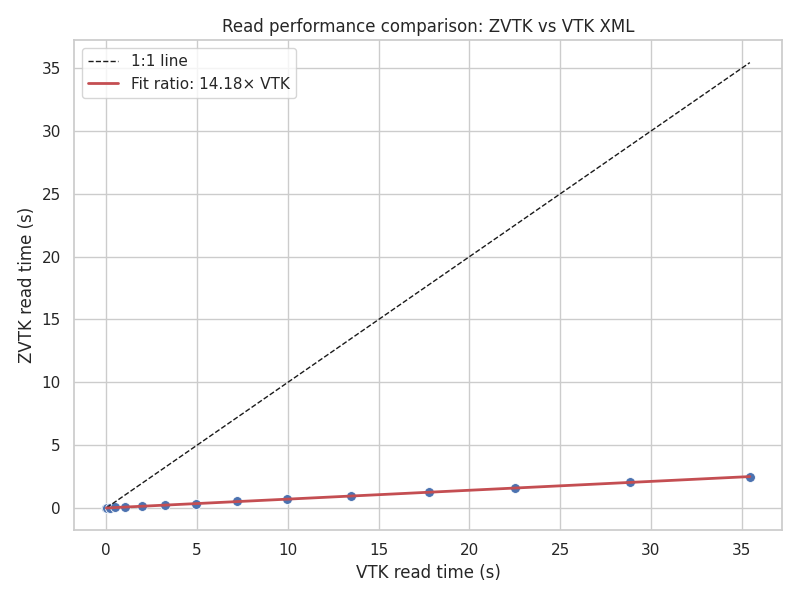
Read time comparison for synthetic unstructured grids#
Reading zvtk files is substantially faster than VTK XML across all dataset
sizes, about 14 times faster than VTK.
Speedup vs Dataset Size#
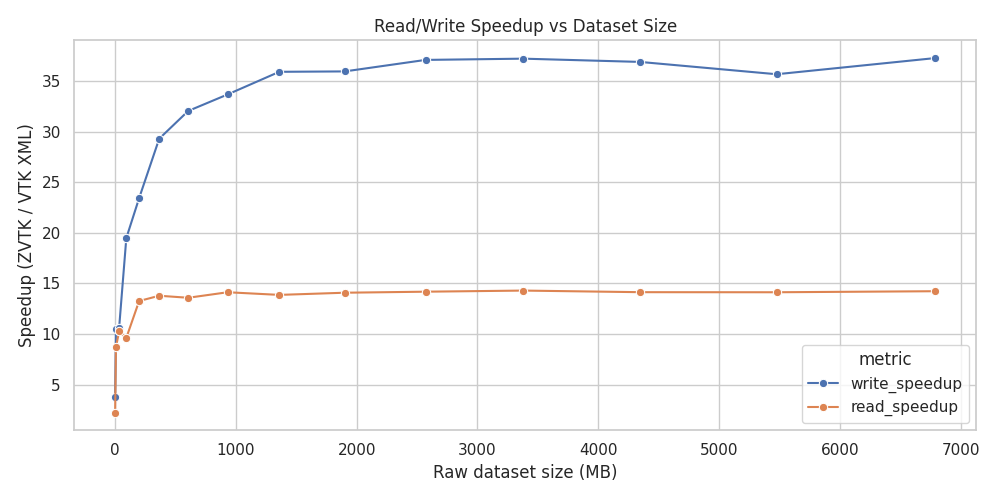
Read/Write speedup (zvtk / VTK XML) versus dataset size#
Both read and write operations achieve multiple-fold speedups with zvtk.
Larger datasets show the most pronounced improvements.
Compression Ratios vs Dataset Size#
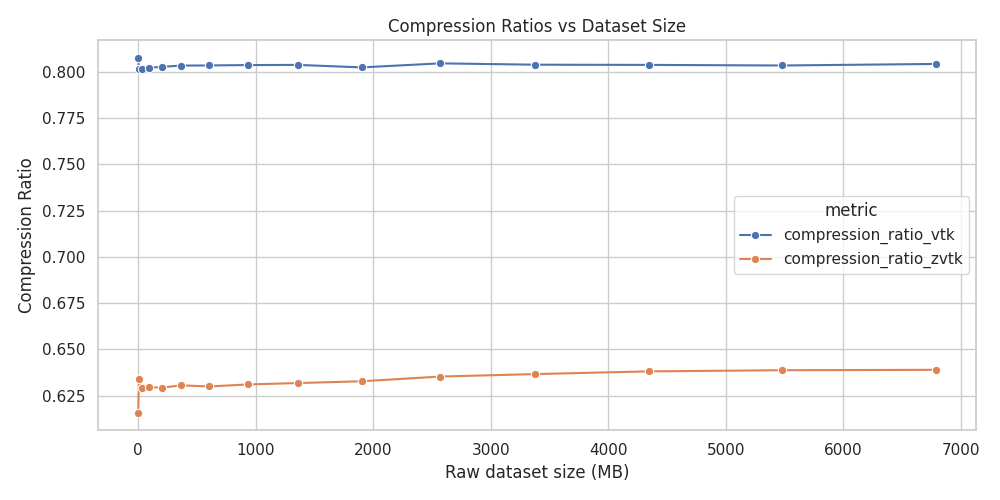
Compression ratios (zvtk vs VTK XML) versus dataset size#
ZVTK maintains higher compression than VTK XML for all synthetic dataset sizes.
Benchmark Script#
The benchmarks were executed using the following Python script:
"""
Synthetic DataSet benchmarks.

Create a synatic unstructured grid from imagedata.

"""

from __future__ import annotations

from pathlib import Path
import time

import matplotlib.pyplot as plt
import numpy as np
import pandas as pd
import pyvista as pv
import seaborn as sns
from tqdm import tqdm

import zvtk

tmp_dir = Path("/tmp/zvtk_test")
tmp_dir.mkdir(exist_ok=True)

rng = np.random.default_rng(42)
results = []

# Synthetic ImageData -> UnstructuredGrid
for n_dim in tqdm(range(10, 300, 20)):  # adjust step for speed
    name = f"synthetic_{n_dim}^3"
    imdata = pv.ImageData(dimensions=(n_dim, n_dim, n_dim))
    ugrid = imdata.to_tetrahedra()

    # Add point/cell data
    ugrid["sample_point_data"] = rng.random((ugrid.n_points, 3))
    ugrid["sample_cell_data"] = rng.random((ugrid.n_cells, 3))

    # Save/read timing for VTK
    filename = tmp_dir / f"{name}.vtu"
    tstart = time.time()
    ugrid.save(filename)
    vtk_write_time = time.time() - tstart

    tstart = time.time()
    pv.read(filename)
    vtk_read_time = time.time() - tstart

    vtk_fs = filename.stat().st_size

    # Save/read timing for zvtk
    out_file = tmp_dir / f"{name}.zvtk"
    tstart = time.time()
    writer = zvtk.Writer(ugrid, out_file)
    writer.write(n_threads=4)
    zvtk_write_time = time.time() - tstart
    zvtk_fs = out_file.stat().st_size

    tstart = time.time()
    reader = zvtk.Reader(out_file)
    reader.read()
    zvtk_read_time = time.time() - tstart

    print(reader.nbytes / 1024**2)
    results.append(
        {
            "name": name,
            "ds_type": "UnstructuredGrid",
            "raw_nbytes": reader.nbytes,
            "vtk_nbytes": vtk_fs,
            "zvtk_nbytes": zvtk_fs,
            "vtk_write_time": vtk_write_time,
            "zvtk_write_time": zvtk_write_time,
            "vtk_read_time": vtk_read_time,
            "zvtk_read_time": zvtk_read_time,
        }
    )

# Build DataFrame and compute ratios
df = pd.DataFrame(results)
df["write_speedup"] = df["vtk_write_time"] / df["zvtk_write_time"]
df["read_speedup"] = df["vtk_read_time"] / df["zvtk_read_time"]
df["compression_ratio_vtk"] = df["vtk_nbytes"] / df["raw_nbytes"]
df["compression_ratio_zvtk"] = df["zvtk_nbytes"] / df["raw_nbytes"]

summary = df.sort_values("raw_nbytes", ascending=False)


summary = df.copy()  # synthetic benchmark results

sns.set(style="whitegrid")

# Convert bytes to MB for better readability
summary["raw_MB"] = summary["raw_nbytes"] / 1e6
summary["vtk_MB"] = summary["vtk_nbytes"] / 1e6
summary["zvtk_MB"] = summary["zvtk_nbytes"] / 1e6


###############################################################################
# 1. File size comparison with ratio fit
plt.figure(figsize=(8, 6))
sns.scatterplot(data=summary, x="vtk_MB", y="zvtk_MB", s=50)

# 1:1 reference line
max_val = max(summary["vtk_MB"].max(), summary["zvtk_MB"].max())
plt.plot([0, max_val], [0, max_val], "k--", lw=1, label="1:1 line")

# Linear fit forced through origin to get ratio
ratio_coef = 1 / float(np.sum(summary["vtk_MB"] * summary["zvtk_MB"]) / np.sum(summary["vtk_MB"] ** 2))
fit_line = 1 / ratio_coef * summary["vtk_MB"]
plt.plot(summary["vtk_MB"], fit_line, "r-", lw=2, label=f"Fit ratio: {ratio_coef:.2f}× VTK")

plt.xlabel("VTK XML file size (MB)")
plt.ylabel("ZVTK file size (MB)")
plt.title("File size comparison: ZVTK vs VTK XML")
plt.legend()
plt.tight_layout()
plt.show()

###############################################################################
# 2. Write time comparison with ratio fit
plt.figure(figsize=(8, 6))
sns.scatterplot(data=summary, x="vtk_write_time", y="zvtk_write_time", s=50)

max_val = max(summary["vtk_write_time"].max(), summary["zvtk_write_time"].max())
plt.plot([0, max_val], [0, max_val], "k--", lw=1, label="1:1 line")

ratio_coef = 1 / float(
    np.sum(summary["vtk_write_time"] * summary["zvtk_write_time"]) / np.sum(summary["vtk_write_time"] ** 2)
)
fit_line = 1 / ratio_coef * summary["vtk_write_time"]
plt.plot(summary["vtk_write_time"], fit_line, "r-", lw=2, label=f"Fit ratio: {ratio_coef:.2f}× VTK")

plt.xlabel("VTK write time (s)")
plt.ylabel("ZVTK write time (s)")
plt.title("Write performance comparison: ZVTK vs VTK XML")
plt.legend()
plt.tight_layout()
plt.show()

###############################################################################
# 3. Read time comparison with ratio fit
plt.figure(figsize=(8, 6))
sns.scatterplot(data=summary, x="vtk_read_time", y="zvtk_read_time", s=50)

max_val = max(summary["vtk_read_time"].max(), summary["zvtk_read_time"].max())
plt.plot([0, max_val], [0, max_val], "k--", lw=1, label="1:1 line")

ratio_coef = 1 / float(
    np.sum(summary["vtk_read_time"] * summary["zvtk_read_time"]) / np.sum(summary["vtk_read_time"] ** 2)
)
fit_line = 1 / ratio_coef * summary["vtk_read_time"]
plt.plot(summary["vtk_read_time"], fit_line, "r-", lw=2, label=f"Fit ratio: {ratio_coef:.2f}× VTK")

plt.xlabel("VTK read time (s)")
plt.ylabel("ZVTK read time (s)")
plt.title("Read performance comparison: ZVTK vs VTK XML")
plt.legend()
plt.tight_layout()
plt.show()


###############################################################################
# 4. Ratios summary (speedup and compression)
# 4a. Speedup summary
summary_speedup = summary.melt(
    id_vars=["raw_MB"],
    value_vars=["write_speedup", "read_speedup"],
    var_name="metric",
    value_name="value",
)

plt.figure(figsize=(10, 5))
sns.lineplot(data=summary_speedup, x="raw_MB", y="value", hue="metric", marker="o")
plt.xlabel("Raw dataset size (MB)")
plt.ylabel("Speedup (ZVTK / VTK XML)")
plt.title("Read/Write Speedup vs Dataset Size")
plt.tight_layout()
plt.show()

# 4b. Compression ratio summary
summary_compression = summary.melt(
    id_vars=["raw_MB"],
    value_vars=["compression_ratio_vtk", "compression_ratio_zvtk"],
    var_name="metric",
    value_name="value",
)

plt.figure(figsize=(10, 5))
sns.lineplot(data=summary_compression, x="raw_MB", y="value", hue="metric", marker="o")
plt.xlabel("Raw dataset size (MB)")
plt.ylabel("Compression Ratio")
plt.title("Compression Ratios vs Dataset Size")
plt.tight_layout()
plt.show()