PyVista Examples Benchmarks#
The following benchmarks evaluate zvtk performance against VTK’s native XML writer using datasets from pyvista.examples.
Datasets tested include:
File Size Comparison#
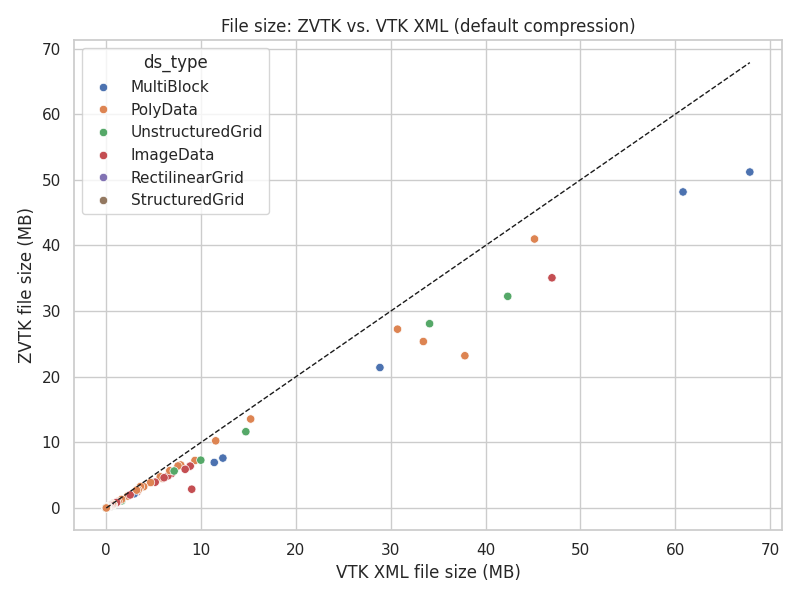
File size: ZVTK vs. VTK XML (default compression)#
Most datasets show smaller file sizes when using zvtk compared to VTK XML.
Points fall below the unity line (dashed), indicating reduced disk usage with
Zstandard compression.
Write Time Comparison#
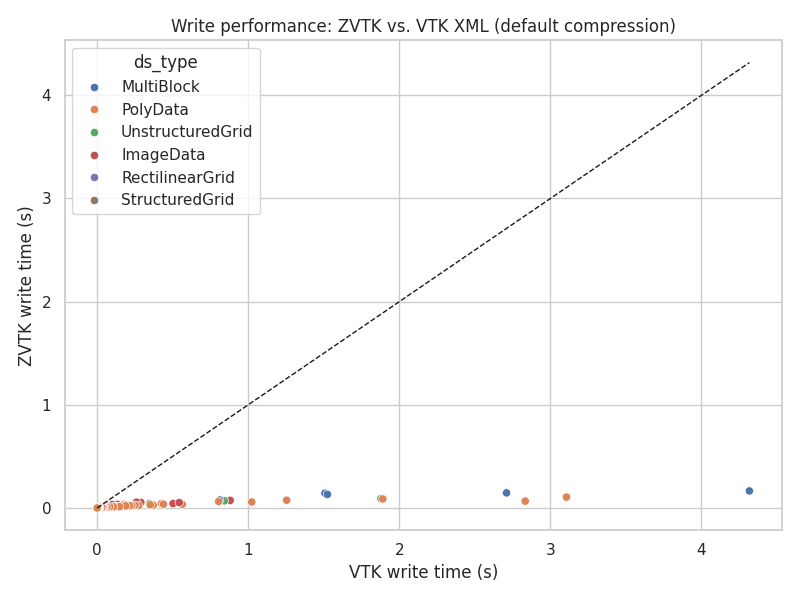
Write performance: ZVTK vs. VTK XML (default compression)#
Write operations with zvtk are several times faster across all dataset
types. Larger datasets benefit more from multi-threaded compression.
Read Time Comparison#
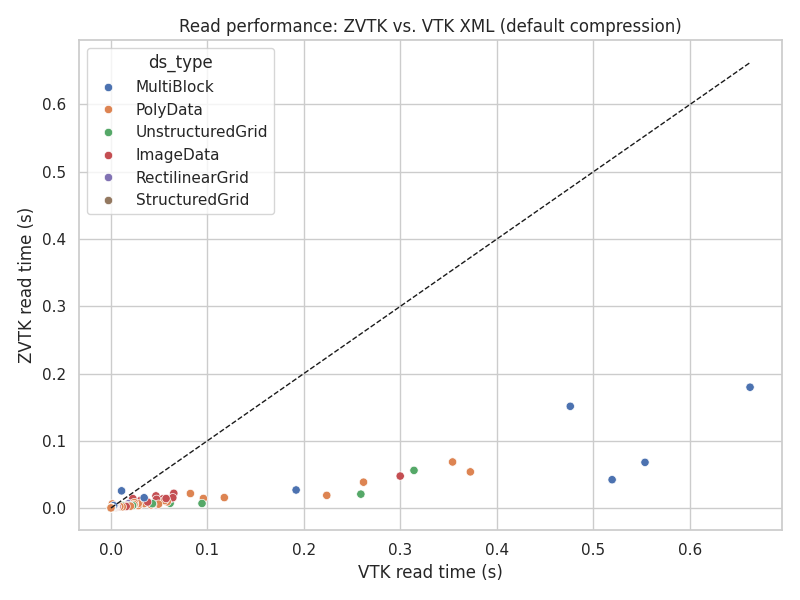
Read performance: ZVTK vs. VTK XML (default compression)#
Reading zvtk files is significantly faster than VTK XML.
Note
Performance gains persist even without multi-threading.
Top 10 Largest Datasets: Speedup and Compression Ratios#
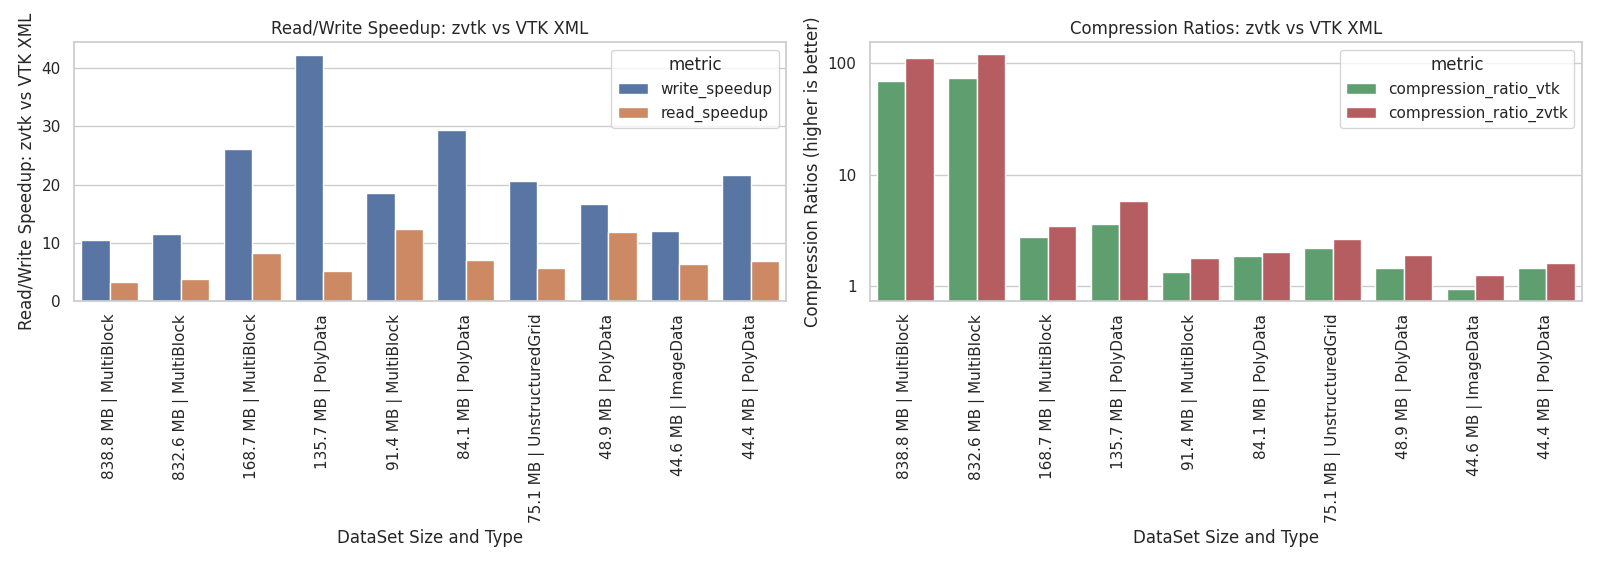
Read/Write Speedup and Compression Ratios for Top 10 pyvista.examples Datasets#
The left panel shows read/write speedups: all top datasets achieve multiple-fold
speed increases when using zvtk.
The right panel shows compression ratios (log scale): zvtk achieves higher
compression than VTK XML in all cases while retaining full dataset fidelity.
Benchmark Script#
The benchmarks were executed using the following Python script:
"""Benchmarks using PyVista examples."""

from __future__ import annotations

from pathlib import Path
import shutil
import time

import matplotlib.pyplot as plt
import pandas as pd
import pyvista as pv
from pyvista import examples
import seaborn as sns
from tqdm import tqdm

import zvtk

tmp_dir = Path("/tmp/zvtk_test")
tmp_dir.mkdir(exist_ok=True)

# supported pyvista objects
allowed = (
    pv.MultiBlock,
    pv.PolyData,
    pv.ImageData,
    pv.UnstructuredGrid,
    pv.RectilinearGrid,
    pv.ExplicitStructuredGrid,
    pv.PointSet,
    pv.StructuredGrid,
)


def get_dir_size(path: Path) -> float:
    return sum(f.stat().st_size for f in Path(path).rglob("*") if f.is_file())


def timed_read_write(ds: pv.DataSet | pv.MultiBlock, n_try: int = 5) -> tuple[float, float, int]:
    if isinstance(ds, pv.MultiBlock):
        suffix = ".vtm"
    elif isinstance(ds, pv.PolyData):
        suffix = ".vtp"
    elif isinstance(ds, pv.ImageData):
        suffix = ".vti"
    elif isinstance(ds, pv.UnstructuredGrid):
        suffix = ".vtu"
    elif isinstance(ds, pv.RectilinearGrid):
        suffix = ".vtr"
    elif isinstance(ds, pv.StructuredGrid):
        suffix = ".vts"
    else:
        raise TypeError(f"Unsupported type {type(ds)}")

    filename = Path(f"/tmp/dataset{suffix}")
    mblock_path = Path("/tmp/dataset")
    if mblock_path.exists():
        shutil.rmtree(mblock_path)

    tstart = time.time()
    for _ in range(n_try):
        ds.save(filename)

    write_time = (time.time() - tstart) / n_try

    tstart = time.time()
    for _ in range(n_try):
        pv.read(filename)

    read_time = (time.time() - tstart) / n_try

    if isinstance(ds, pv.MultiBlock):
        vtk_fs = get_dir_size(mblock_path)
    else:
        vtk_fs = filename.stat().st_size

    return write_time, read_time, vtk_fs


results = []
for name in tqdm(dir(examples)):
    if not name.startswith("download_"):
        continue
    if name.startswith("download_file"):
        continue

    func = getattr(examples, name)
    if not callable(func):
        continue

    try:
        ds = func()  # get dataset
    except Exception as err:
        print(f"skipping '{name}' due to:\n\n{err}")

    if not isinstance(ds, allowed):
        continue

    # unfair comparison non-native XYZ type
    if isinstance(ds, pv.PointSet):
        continue

    # read/write using VTK's native XML format
    vtk_write_time, vtk_read_time, vtk_fs = timed_read_write(ds)

    # read/write using zvtk using standard settings:
    # - 4 threads
    # - default compression
    out_file = tmp_dir / f"{name}.zvtk"
    tstart = time.time()
    n_try_zvtk = 10
    for _ in range(n_try_zvtk):
        writer = zvtk.Writer(ds, out_file)
        writer.write(n_threads=4)
        zvtk_fs = out_file.stat().st_size
    zvtk_write_time = (time.time() - tstart) / n_try_zvtk

    tstart = time.time()
    n_try_zvtk = 10
    for _ in range(n_try_zvtk):
        reader = zvtk.Reader(out_file)
        reader.read()
    zvtk_read_time = (time.time() - tstart) / n_try_zvtk

    results.append(
        {
            "name": name,
            "ds_type": type(ds).__name__,
            "raw_nbytes": reader.nbytes,
            "zvtk_nbytes": zvtk_fs,
            "zvtk_write_time": zvtk_write_time,
            "zvtk_read_time": zvtk_read_time,
            "vtk_nbytes": vtk_fs,
            "vtk_write_time": vtk_write_time,
            "vtk_read_time": vtk_read_time,
        }
    )


df = pd.DataFrame(results)
df["write_speedup"] = df["vtk_write_time"] / df["zvtk_write_time"]
df["read_speedup"] = df["vtk_read_time"] / df["zvtk_read_time"]
df["compression_ratio_zvtk"] = df["zvtk_nbytes"] / df["raw_nbytes"]
df["compression_ratio_vtk"] = df["vtk_nbytes"] / df["raw_nbytes"]

summary = df[
    [
        "name",
        "ds_type",
        "raw_nbytes",
        "vtk_nbytes",
        "zvtk_nbytes",
        "compression_ratio_zvtk",
        "compression_ratio_vtk",
        "vtk_write_time",
        "zvtk_write_time",
        "write_speedup",
        "vtk_read_time",
        "zvtk_read_time",
        "read_speedup",
    ]
].sort_values("raw_nbytes", ascending=False)


###############################################################################
# 1. File size comparison

sns.set(style="whitegrid")

summary["vtk_MB"] = summary["vtk_nbytes"] / 1e6
summary["zvtk_MB"] = summary["zvtk_nbytes"] / 1e6

plt.figure(figsize=(8, 6))
sns.scatterplot(data=summary, x="vtk_MB", y="zvtk_MB", hue="ds_type")

min_val = min(summary["vtk_MB"].min(), summary["zvtk_MB"].min())
max_val = max(summary["vtk_MB"].max(), summary["zvtk_MB"].max())
plt.plot([min_val, max_val], [min_val, max_val], "k--", lw=1)

plt.xlabel("VTK XML file size (MB)")
plt.ylabel("ZVTK file size (MB)")
plt.title("File size: ZVTK vs. VTK XML (default compression)")
plt.tight_layout()
plt.show()

###############################################################################
# 2. Write time comparison
plt.figure(figsize=(8, 6))
sns.scatterplot(data=summary, x="vtk_write_time", y="zvtk_write_time", hue="ds_type")
plt.plot(
    [summary["vtk_write_time"].min(), summary["vtk_write_time"].max()],
    [summary["vtk_write_time"].min(), summary["vtk_write_time"].max()],
    "k--",
    lw=1,
)
plt.xlabel("VTK write time (s)")
plt.ylabel("ZVTK write time (s)")
plt.title("Write performance: ZVTK vs. VTK XML (default compression)")
plt.tight_layout()
plt.show()

###############################################################################
# 3. Read time comparison
plt.figure(figsize=(8, 6))
sns.scatterplot(data=summary, x="vtk_read_time", y="zvtk_read_time", hue="ds_type")
plt.plot(
    [summary["vtk_read_time"].min(), summary["vtk_read_time"].max()],
    [summary["vtk_read_time"].min(), summary["vtk_read_time"].max()],
    "k--",
    lw=1,
)
plt.xlabel("VTK read time (s)")
plt.ylabel("ZVTK read time (s)")
plt.title("Read performance: ZVTK vs. VTK XML (default compression)")
plt.tight_layout()
plt.show()


###############################################################################
# 4. Ratios summary (bar plot)
import matplotlib.pyplot as plt
import matplotlib.ticker as mticker
import seaborn as sns

top10 = summary.nlargest(10, "raw_nbytes").copy()
top10["compression_ratio_vtk"] = 1 / top10["compression_ratio_vtk"]
top10["compression_ratio_zvtk"] = 1 / top10["compression_ratio_zvtk"]

# Build DataSet Size and Types with size (MB) and dataset type
top10["DataSet Size and Type"] = (top10["raw_nbytes"] / 1e6).round(1).astype(str) + " MB | " + top10["ds_type"]

palette = sns.color_palette()

fig, axes = plt.subplots(1, 2, figsize=(16, 6))
plt.suptitle("Top 10 pyvista.examples Datasets by Size")

sns.barplot(
    data=top10.melt(
        id_vars=["DataSet Size and Type"],
        value_vars=["write_speedup", "read_speedup"],
        var_name="metric",
        value_name="value",
    ),
    x="DataSet Size and Type",
    y="value",
    hue="metric",
    palette=palette[:2],
    ax=axes[0],
)
axes[0].set_title("Read/Write Speedup: zvtk vs VTK XML")
axes[0].tick_params(axis="x", rotation=90)
axes[0].set_ylabel("Read/Write Speedup: zvtk vs VTK XML")

sns.barplot(
    data=top10.melt(
        id_vars=["DataSet Size and Type"],
        value_vars=["compression_ratio_vtk", "compression_ratio_zvtk"],
        var_name="metric",
        value_name="value",
    ),
    x="DataSet Size and Type",
    y="value",
    hue="metric",
    palette=palette[2:4],
    ax=axes[1],
)
axes[1].set_yscale("log")
axes[1].yaxis.set_major_formatter(mticker.ScalarFormatter())  # non-log label
axes[1].set_title("Compression Ratios: zvtk vs VTK XML")
axes[1].tick_params(axis="x", rotation=90)
axes[1].set_ylabel("Compression Ratios (higher is better)")

plt.tight_layout()
plt.show()