Note
Click here to download the full example code
Create and Visualize a Spline using PyVista#
Create a spline/polyline from a numpy array of XYZ vertices.
import numpy as np

import pyvista as pv
Create a dataset to plot
def make_points():
    """Helper to make XYZ points"""
    n_points = 200
    theta = np.linspace(-4 * np.pi, 0.5 * np.pi, n_points)
    z = np.linspace(-2, 2, n_points)
    r = z**2 + 1
    x = r * np.sin(theta)**2
    y = r * np.cos(theta)
    return np.column_stack((x, y, z))


points = make_points()
points[0:5, :]
Out:
array([[ 1.19980783e-30,  5.00000000e+00, -2.00000000e+00],
       [ 2.47886671e-02,  4.90759204e+00, -1.97989950e+00],
       [ 9.70671893e-02,  4.79203274e+00, -1.95979899e+00],
       [ 2.13061187e-01,  4.65468074e+00, -1.93969849e+00],
       [ 3.68225287e-01,  4.49697646e+00, -1.91959799e+00]])
Now let’s make a function that can create line cells on a
pyvista.PolyData mesh given that the points are in order for the
segments they make.
def lines_from_points(points):
    """Given an array of points, make a line set"""
    poly = pv.PolyData()
    poly.points = points
    cells = np.full((len(points) - 1, 3), 2, dtype=np.int_)
    cells[:, 1] = np.arange(0, len(points) - 1, dtype=np.int_)
    cells[:, 2] = np.arange(1, len(points), dtype=np.int_)
    poly.lines = cells
    return poly


line = lines_from_points(points)
line
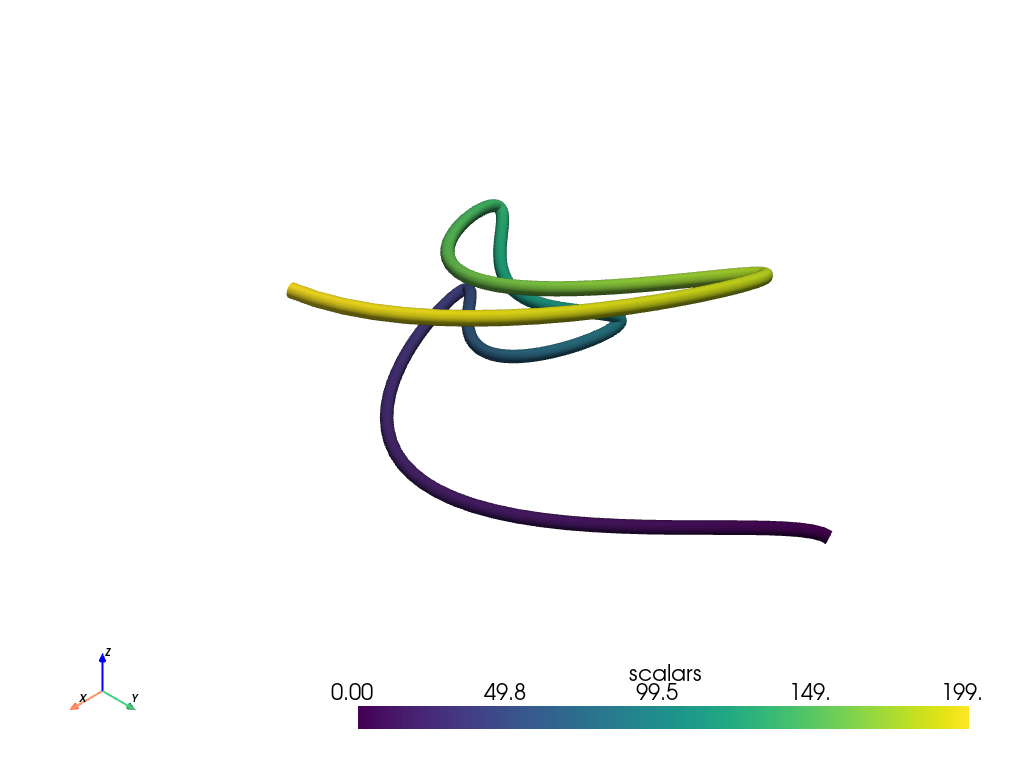
line["scalars"] = np.arange(line.n_points)
tube = line.tube(radius=0.1)
tube.plot(smooth_shading=True)

That tube has sharp edges at each line segment. This can be mitigated by creating a single PolyLine cell for all of the points
def polyline_from_points(points):
    poly = pv.PolyData()
    poly.points = points
    the_cell = np.arange(0, len(points), dtype=np.int_)
    the_cell = np.insert(the_cell, 0, len(points))
    poly.lines = the_cell
    return poly


polyline = polyline_from_points(points)
polyline["scalars"] = np.arange(polyline.n_points)
tube = polyline.tube(radius=0.1)
tube.plot(smooth_shading=True)
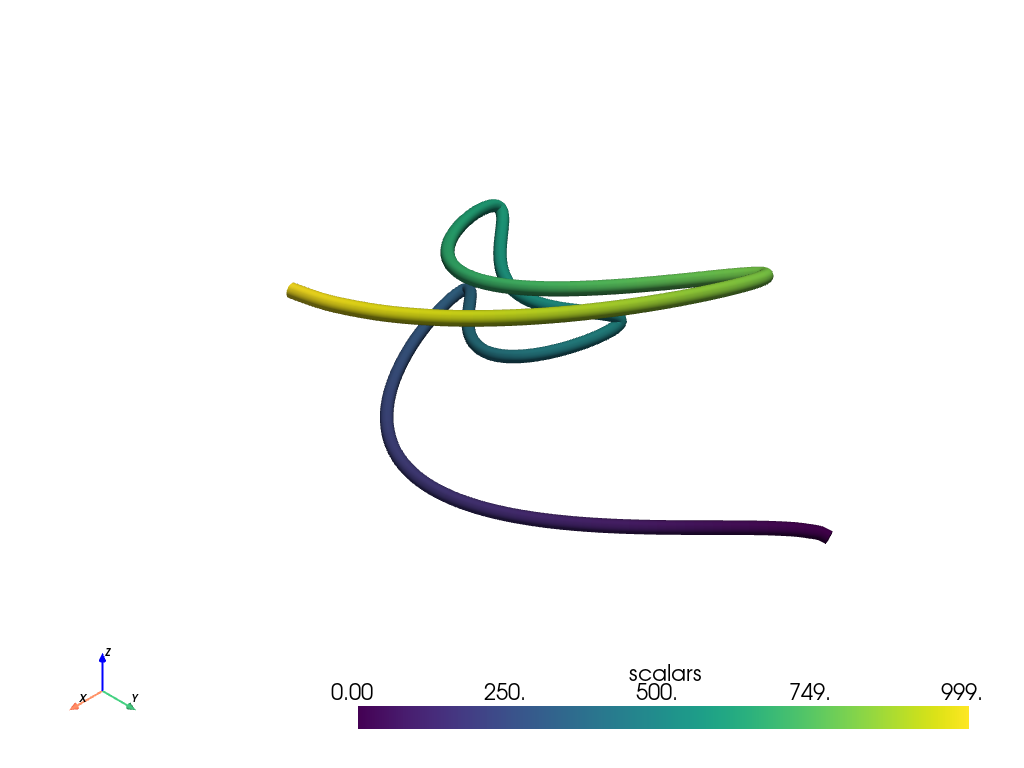
You could also interpolate those points onto a parametric spline
# Create spline with 1000 interpolation points
spline = pv.Spline(points, 1000)
Plot spline as a tube
# add scalars to spline and plot it
spline["scalars"] = np.arange(spline.n_points)
tube = spline.tube(radius=0.1)
tube.plot(smooth_shading=True)
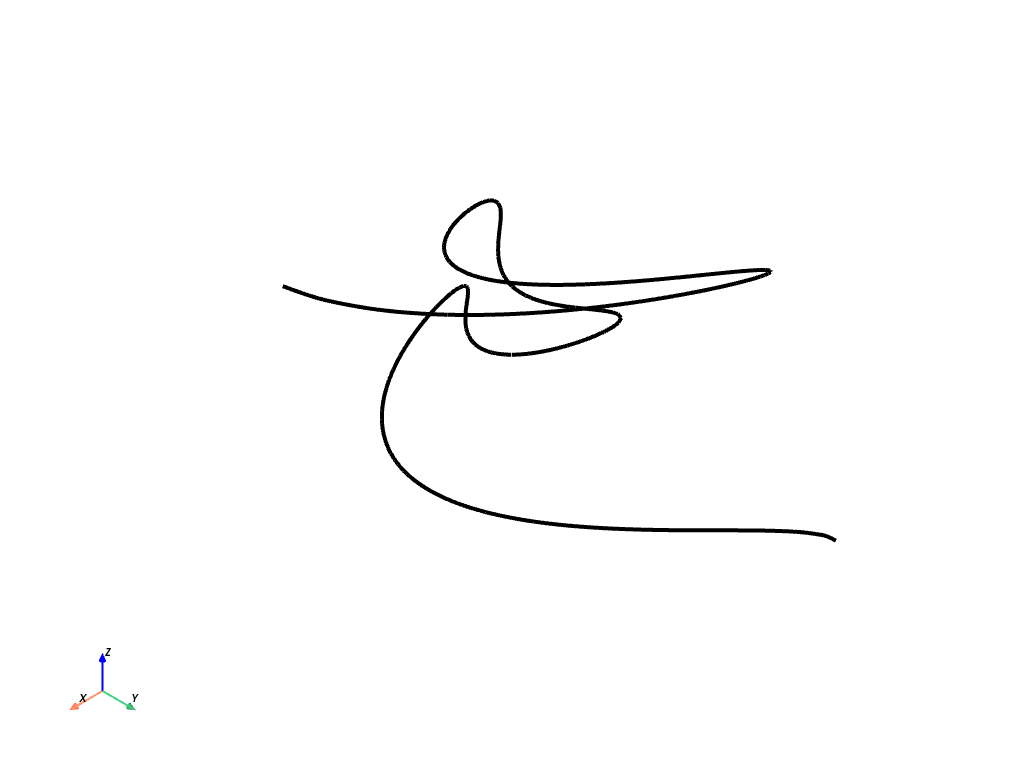
The spline can also be plotted as a plain line
# generate same spline with 400 interpolation points
spline = pv.Spline(points, 400)

# plot without scalars
spline.plot(line_width=4, color="k")
Ribbons#
Ayy of the lines from the examples above can be used to create ribbons.
Take a look at the pyvista.PolyDataFilters.ribbon() filter.
ribbon = spline.compute_arc_length().ribbon(width=0.75, scalars='arc_length')
ribbon.plot(color=True)

Total running time of the script: ( 0 minutes 1.724 seconds)